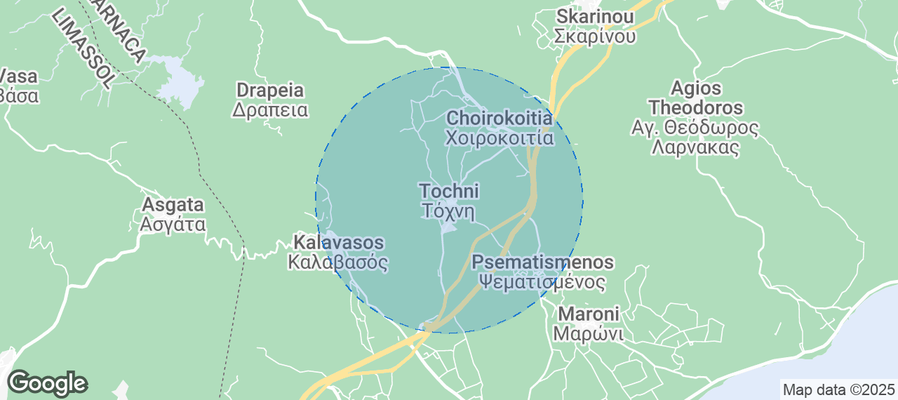
Tochni Airbnb Market Analysis 2026: Short Term Rental Data & Vacation Rental Statistics in Cyprus, Cyprus
Is Airbnb profitable in Tochni in 2026? Explore comprehensive Airbnb analytics for Tochni, Cyprus, Cyprus to uncover income potential. This 2026 STR market report for Tochni, based on AirROI data from December 2024 to November 2025, reveals key trends in the niche market of 18 active listings.
Whether you're considering an Airbnb investment in Tochni, optimizing your existing vacation rental, or exploring rental arbitrage opportunities, understanding the Tochni Airbnb data is crucial. Leveraging the low regulation environment is key to maximizing your short term rental income potential. Let's dive into the specifics.
Key Tochni Airbnb Performance Metrics Overview
Monthly Airbnb Revenue Variations & Income Potential in Tochni (2026)
Understanding the monthly revenue variations for Airbnb listings in Tochni is key to maximizing your short term rental income potential. Seasonality significantly impacts earnings. Our analysis, based on data from the past 12 months, shows that the peak revenue month for STRs in Tochni is typically April, while January often presents the lowest earnings, highlighting opportunities for strategic pricing adjustments during shoulder and low seasons. Explore the typical Airbnb income in Tochni across different performance tiers:
- Best-in-class properties (Top 10%) achieve $3,146+ monthly, often utilizing dynamic pricing and superior guest experiences.
- Strong performing properties (Top 25%) earn $1,598 or more, indicating effective management and desirable locations/amenities.
- Typical properties (Median) generate around $915 per month, representing the average market performance.
- Entry-level properties (Bottom 25%) see earnings around $399, often with potential for optimization.
Average Monthly Airbnb Earnings Trend in Tochni
Tochni Airbnb Occupancy Rate Trends (2026)
Maximize your bookings by understanding the Tochni STR occupancy trends. Seasonal demand shifts significantly influence how often properties are booked. Typically, Novembersees the highest demand (peak season occupancy), while January experiences the lowest (low season). Effective strategies, like adjusting minimum stays or offering promotions, can boost occupancy during slower periods. Here's how different property tiers perform in Tochni:
- Best-in-class properties (Top 10%) achieve 57%+ occupancy, indicating high desirability and potentially optimized availability.
- Strong performing properties (Top 25%) maintain 39% or higher occupancy, suggesting good market fit and guest satisfaction.
- Typical properties (Median) have an occupancy rate around 30%.
- Entry-level properties (Bottom 25%) average 16% occupancy, potentially facing higher vacancy.
Average Monthly Occupancy Rate Trend in Tochni
Average Daily Rate (ADR) Airbnb Trends in Tochni (2026)
Effective short term rental pricing strategy in Tochni involves understanding monthly ADR fluctuations. The Average Daily Rate (ADR) for Airbnb in Tochni typically peaks in August and dips lowest during April. Leveraging Airbnb dynamic pricing tools or strategies based on this seasonality can significantly boost revenue. Here's a look at the typical nightly rates achieved:
- Best-in-class properties (Top 10%) command rates of $212+ per night, often due to premium features or locations.
- Strong performing properties (Top 25%) achieve nightly rates of $137 or more.
- Typical properties (Median) charge around $109 per night.
- Entry-level properties (Bottom 25%) earn around $77 per night.
Average Daily Rate (ADR) Trend by Month in Tochni
Get Live Tochni Market Intelligence 👇
Explore Real-time Analytics
Airbnb Seasonality Analysis & Trends in Tochni (2025)
Peak Season (April, November, May)
- Revenue averages $1,976 per month
- Occupancy rates average 48.6%
- Daily rates average $127
Shoulder Season
- Revenue averages $1,239 per month
- Occupancy maintains around 32.0%
- Daily rates hold near $129
Low Season (January, February, December)
- Revenue drops to average $726 per month
- Occupancy decreases to average 15.4%
- Daily rates adjust to average $126
Seasonality Insights for Tochni
- The Airbnb seasonality in Tochni shows highly seasonal trends requiring careful strategy. While the sections above show seasonal averages, it's also insightful to look at the extremes:
- During the high season, the absolute peak month showcases Tochni's highest earning potential, with monthly revenues capable of climbing to $2,200, occupancy reaching a high of 56.0%, and ADRs peaking at $130.
- Conversely, the slowest single month of the year, typically falling within the low season, marks the market's lowest point. In this month, revenue might dip to $322, occupancy could drop to 7.8%, and ADRs may adjust down to $124.
- Understanding both the seasonal averages and these monthly peaks and troughs in revenue, occupancy, and ADR is crucial for maximizing your Airbnb profit potential in Tochni.
Seasonal Strategies for Maximizing Profit
- Peak Season: Maximize revenue through premium pricing and potentially longer minimum stays. Ensure high availability.
- Low Season: Offer competitive pricing, special promotions (e.g., extended stay discounts), and flexible cancellation policies. Target off-season travelers like remote workers or budget-conscious guests.
- Shoulder Seasons: Implement dynamic pricing that balances peak and low rates. Target weekend travelers or specific events. Offer slightly more flexible terms than peak season.
- Regularly analyze your own performance against these Tochni seasonality benchmarks and adjust your pricing and availability strategy accordingly.
Best Areas for Airbnb Investment in Tochni (2026)
Exploring the top neighborhoods for short-term rentals in Tochni? This section highlights key areas, outlining why they are attractive for hosts and guests, along with notable local attractions. Consider these locations based on your target guest profile and investment strategy.
| Neighborhood / Area | Why Host Here? (Target Guests & Appeal) | Key Attractions & Landmarks |
|---|---|---|
| Tochni Village | Authentic Cypriot village experience with traditional architecture and hospitality. It's appealing for tourists looking for a quiet retreat while being close to the coast. | Traditional Cypriot restaurants, Village Square, Charming narrow streets, Local artisan shops |
| Governor's Beach | Popular beach destination known for its clear waters and sandy shores. Perfect for sunbathers and water sports enthusiasts. | Governor's Beach, Water sports activities, Beachside cafes, Scenic walking paths |
| Larnaca | Nearby city with vibrant nightlife, shopping, and cultural attractions. It draws tourists who want both beach and city experiences. | Finikoudes Beach, Larnaca Salt Lake, Hala Sultan Tekke, Larnaca Marina |
| Limassol | A bustling coastal city offering nightlife, shopping, and historical sites. It is a favorite among tourists seeking a mix of relaxation and entertainment. | Limassol Castle, Promenade, Molokai Beach, Marina and luxury shops |
| Famagusta | A historical city with rich history and beautiful coastline. Attracts visitors interested in history and beautiful beaches. | Ancient ruins of Salamis, St. Nicholas Cathedral, Karpaz Peninsula, Beautiful beaches |
| Paphos | A UNESCO World Heritage site known for its ancient ruins and stunning coastlines. Great for culture enthusiasts and beach lovers. | Paphos Archaeological Park, Tomb of the Kings, Kato Paphos Harbor, Coral Bay |
| Ayia Napa | Famous for its nightlife, beaches, and water activities. A hotspot for young travelers looking for fun and adventure. | Nissi Beach, Ayia Napa Monastery, WaterWorld Waterpark, Nightclubs and beach bars |
| Troodos Mountains | Great for those seeking nature, hiking, and the cool climate of the mountains. Ideal for tourists looking for outdoor activities and scenic views. | Mount Olympus, Troodos Square, Koilon Village, Scenic hiking trails |
Understanding Airbnb License Requirements & STR Laws in Tochni (2026)
While Tochni, Cyprus, Cyprus currently shows low STR regulations, specific Airbnb license requirements might still exist or change. Always verify the latest short term rental regulations and Airbnb license requirements directly with local government authorities for Tochni to ensure full compliance before hosting.
(Source: AirROI data, 2026, based on 6% licensed listings)
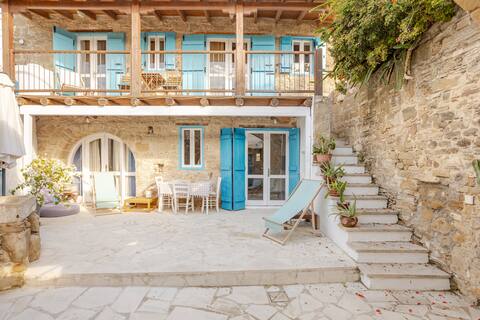
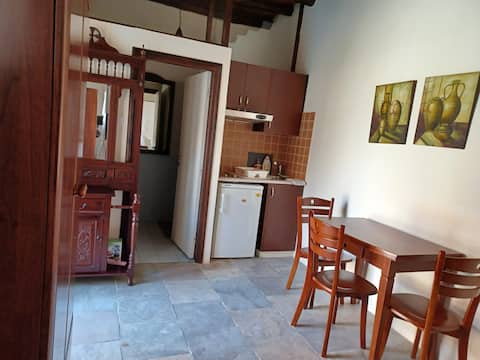
Top Performing Airbnb Properties in Tochni (2026)
Benchmark your potential! Explore examples of top-performing Airbnb properties in Tochnibased on Trailing Twelve Month (TTM) revenue. Analyze their characteristics, revenue, occupancy rate, and ADR to understand what drives success in this market.

Carob Tree Villa | 3 BR Rustic Home | Pool Access
Entire Place • 3 bedrooms
Whole traditional independent house
Entire Place • 1 bedroom

Historical private house
Entire Place • 1 bedroom

2 connected flats | Breakfast & Dinner inc. for 4
Private Room • 2 bedrooms

Panoramic View private Village House
Entire Place • 1 bedroom
Traditional studio at Vrakas House
Private Room • N/A
Note: Performance varies based on location, size, amenities, seasonality, and management quality. Data reflects the past 12 months.
Top Performing Airbnb Hosts in Tochni (2026)
Learn from the best! This table showcases top-performing Airbnb hosts in Tochni based on the number of properties managed and estimated total revenue over the past year. Analyze their scale and performance metrics.
| Host Name | Properties | Grossing Revenue | Stay Reviews | Avg Rating |
|---|---|---|---|---|
| Kyriakos | 1 | $43,445 | 55 | 4.85/5.0 |
| Sofronis | 9 | $22,233 | 287 | 4.72/5.0 |
| Olivier | 1 | $19,529 | 173 | 4.82/5.0 |
| Γιώργος | 3 | $15,516 | 132 | 4.97/5.0 |
| Hugh | 3 | $5,393 | 76 | 4.85/5.0 |
| Maria | 1 | $2,337 | 5 | 4.60/5.0 |
Analyzing the strategies of top hosts, such as their property selection, pricing, and guest communication, can offer valuable lessons for optimizing your own Airbnb operations in Tochni.
Dive Deeper: Advanced Tochni STR Market Data (2026)
Ready to unlock more insights? AirROI provides access to advanced metrics and comprehensive Airbnb data for Tochni. Explore detailed analytics beyond this report to refine your investment strategy, optimize pricing, and maximize your vacation rental profits.
Explore Advanced MetricsTochni Short-Term Rental Market Composition (2026): Property & Room Types
Room Type Distribution
Property Type Distribution
Market Composition Insights for Tochni
- The Tochni Airbnb market composition is heavily skewed towards Entire Home/Apt listings, which make up 83.3% of the 18 active rentals. This indicates strong guest preference for privacy and space.
- Looking at the property type distribution in Tochni, Apartment/Condo properties are the most common (55.6%), reflecting the local real estate landscape.
- Houses represent a significant 33.3% portion, catering likely to families or larger groups.
- The presence of 11.1% Hotel/Boutique listings indicates integration with traditional hospitality.
Tochni Airbnb Room Capacity Analysis (2026): Bedroom Distribution
Distribution of Listings by Number of Bedrooms
Room Capacity Insights for Tochni
- The dominant room capacity in Tochni is 1 bedroom listings, making up 66.7% of the market. This suggests a strong demand for properties suitable for couples or solo travelers.
- Together, 1 bedroom and 2 bedrooms properties represent 77.8% of the active Airbnb listings in Tochni, indicating a high concentration in these sizes.
- With over half the market (66.7%) consisting of studios or 1-bedroom units, Tochni is particularly well-suited for individuals or couples.
- Listings with 3+ bedrooms (5.6%) represent a smaller niche, potentially indicating an underserved market for larger group accommodations in Tochni.
Tochni Vacation Rental Guest Capacity Trends (2026)
Distribution of Listings by Guest Capacity
Guest Capacity Insights for Tochni
- The most common guest capacity trend in Tochni vacation rentals is listings accommodating 2 guests (50%). This suggests the primary traveler segment is likely couples or solo travelers.
- Properties designed for 2 guests and 5 guests dominate the Tochni STR market, accounting for 61.1% of listings.
- A significant 50.0% of listings cater specifically to 1-2 guests, highlighting strong demand from couples and solo travelers in Tochni.
- On average, properties in Tochni are equipped to host 2.7 guests.
Tochni Airbnb Booking Patterns (2026): Available vs. Booked Days
Available Days Distribution
Booked Days Distribution
Booking Pattern Insights for Tochni
- The most common availability pattern in Tochni falls within the 271-366 days range, representing 88.9% of listings. This suggests many properties have significant open periods on their calendars.
- Approximately 94.5% of listings show high availability (181+ days open annually), indicating potential for increased bookings or specific owner usage patterns.
- For booked days, the 1-30 days range is most frequent in Tochni (61.1%), reflecting common guest stay durations or potential owner blocking patterns.
- A notable 5.6% of properties secure long booking periods (181+ days booked per year), highlighting successful long-term rental strategies or significant owner usage.
Tochni Airbnb Minimum Stay Requirements Analysis
Distribution of Listings by Minimum Night Requirement
2 Nights
2 listings
11.1% of total
3 Nights
11 listings
61.1% of total
4-6 Nights
3 listings
16.7% of total
30+ Nights
2 listings
11.1% of total
Key Insights
- The most prevalent minimum stay requirement in Tochni is 3 Nights, adopted by 61.1% of listings. This highlights the market's preference for longer commitments.
- Very short stays (1-2 nights) are less common (11.1%), suggesting hosts prefer slightly longer bookings to optimize turnover.
- A significant segment (11.1%) caters to monthly stays (30+ nights) in Tochni, pointing to opportunities in the extended-stay market.
Recommendations
- Align with the market by considering a 3 Nights minimum stay, as 61.1% of Tochni hosts use this setting.
- Explore offering discounts for stays of 30+ nights to attract the 11.1% of the market seeking extended stays.
- Adjust minimum nights based on seasonality – potentially shorter during low season and longer during peak demand periods in Tochni.
Tochni Airbnb Cancellation Policy Trends Analysis (2026)
Flexible
1 listings
5.6% of total
Moderate
7 listings
38.9% of total
Firm
7 listings
38.9% of total
Strict
3 listings
16.7% of total
Cancellation Policy Insights for Tochni
- The prevailing Airbnb cancellation policy trend in Tochni is Moderate, used by 38.9% of listings.
- A majority (55.6%) of hosts in Tochni utilize Firm or Strict policies, indicating a market where hosts prioritize booking security.
Recommendations for Hosts
- Consider adopting a Moderate policy to align with the 38.9% market standard in Tochni.
- Regularly review your cancellation policy against competitors and market demand shifts in Tochni.
Tochni STR Booking Lead Time Analysis (2026)
Average Booking Lead Time by Month
Booking Lead Time Insights for Tochni
- The overall average booking lead time for vacation rentals in Tochni is 28 days.
- Guests book furthest in advance for stays during April (average 115 days), likely coinciding with peak travel demand or local events.
- The shortest booking windows occur for stays in February (average 6 days), indicating more last-minute travel plans during this time.
- Seasonally, Spring (58 days avg.) sees the longest lead times, while Winter (15 days avg.) has the shortest, reflecting typical travel planning cycles.
Recommendations for Hosts
- Use the overall average lead time (28 days) as a baseline for your pricing and availability strategy in Tochni.
- For April stays, consider implementing length-of-stay discounts or slightly higher rates for bookings made less than 115 days out to capitalize on advance planning.
- During February, focus on last-minute booking availability and promotions, as guests book with very short notice (6 days avg.).
- Target marketing efforts for the Spring season well in advance (at least 58 days) to capture early planners.
- Monitor your own booking lead times against these Tochni averages to identify opportunities for dynamic pricing adjustments.
Popular & Essential Airbnb Amenities in Tochni (2026)
Amenity Prevalence
Amenity Insights for Tochni
- Essential amenities in Tochni that guests expect include: Wifi, Air conditioning. Lacking these (any) could significantly impact bookings.
- Popular amenities like Essentials, Free street parking, Heating are common but not universal. Offering these can provide a competitive edge.
Recommendations for Hosts
- Ensure your listing includes all essential amenities for Tochni: Wifi, Air conditioning.
- Consider adding popular differentiators like Essentials or Free street parking to increase appeal.
- Highlight unique or less common amenities you offer (e.g., hot tub, dedicated workspace, EV charger) in your listing description and photos.
- Regularly check competitor amenities in Tochni to stay competitive.
Tochni Airbnb Guest Demographics & Profile Analysis (2026)
Guest Profile Summary for Tochni
- The typical guest profile for Airbnb in Tochni consists of predominantly international visitors (100%), with top international origins including United Kingdom, typically belonging to the Post-2000s (Gen Z/Alpha) group (50%), primarily speaking English or German.
- Domestic travelers account for 0.0% of guests.
- Key international markets include Germany (27.6%) and United Kingdom (17.2%).
- Top languages spoken are English (38.2%) followed by German (17.6%).
- A significant demographic segment is the Post-2000s (Gen Z/Alpha) group, representing 50% of guests.
Recommendations for Hosts
- Focus marketing internationally, particularly towards travelers from United Kingdom.
- Tailor amenities and listing descriptions to appeal to the dominant Post-2000s (Gen Z/Alpha) demographic (e.g., highlight fast WiFi, smart home features, local guides).
- Highlight unique local experiences or amenities relevant to the primary guest profile.
- Consider seasonal promotions aligned with peak travel times for key origin markets.
Nearby Short-Term Rental Market Comparison
How does the Tochni Airbnb market stack up against its neighbors? Compare key performance metrics like average monthly revenue, ADR, and occupancy rates in surrounding areas to understand the broader regional STR landscape.
| Market | Active Properties | Monthly Revenue | Daily Rate | Avg. Occupancy |
|---|---|---|---|---|
| Κοινότητα Κισσόνεργας | 64 | $2,807 | $330.13 | 38% |
| Yialia | 13 | $2,588 | $292.84 | 42% |
| Tsada | 15 | $2,520 | $211.57 | 51% |
| Kouklia | 91 | $2,295 | $321.54 | 37% |
| Peyia | 598 | $2,201 | $235.06 | 45% |
| Agios Athanasios | 10 | $2,143 | $172.46 | 54% |
| Argaka | 50 | $2,074 | $262.75 | 44% |
| Pomos | 57 | $1,981 | $242.76 | 36% |
| Tserkezoi Municipality | 15 | $1,948 | $238.34 | 33% |
| Mazotos | 17 | $1,876 | $265.57 | 33% |