Loket Airbnb Market Analysis 2026: Short Term Rental Data & Vacation Rental Statistics in Karlovy Vary Region, Czechia
Is Airbnb profitable in Loket in 2026? Explore comprehensive Airbnb analytics for Loket, Karlovy Vary Region, Czechia to uncover income potential. This 2026 STR market report for Loket, based on AirROI data from February 2025 to January 2026, reveals key trends in the niche market of 23 active listings.
Whether you're considering an Airbnb investment in Loket, optimizing your existing vacation rental, or exploring rental arbitrage opportunities, understanding the Loket Airbnb data is crucial. Leveraging the low regulation environment is key to maximizing your short term rental income potential. Let's dive into the specifics.
Key Loket Airbnb Performance Metrics Overview
Monthly Airbnb Revenue Variations & Income Potential in Loket (2026)
Understanding the monthly revenue variations for Airbnb listings in Loket is key to maximizing your short term rental income potential. Seasonality significantly impacts earnings. Our analysis, based on data from the past 12 months, shows that the peak revenue month for STRs in Loket is typically July, while January often presents the lowest earnings, highlighting opportunities for strategic pricing adjustments during shoulder and low seasons. Explore the typical Airbnb income in Loket across different performance tiers:
- Best-in-class properties (Top 10%) achieve $2,040+ monthly, often utilizing dynamic pricing and superior guest experiences.
- Strong performing properties (Top 25%) earn $1,391 or more, indicating effective management and desirable locations/amenities.
- Typical properties (Median) generate around $768 per month, representing the average market performance.
- Entry-level properties (Bottom 25%) see earnings around $398, often with potential for optimization.
Average Monthly Airbnb Earnings Trend in Loket
Loket Airbnb Occupancy Rate Trends (2026)
Maximize your bookings by understanding the Loket STR occupancy trends. Seasonal demand shifts significantly influence how often properties are booked. Typically, Julysees the highest demand (peak season occupancy), while January experiences the lowest (low season). Effective strategies, like adjusting minimum stays or offering promotions, can boost occupancy during slower periods. Here's how different property tiers perform in Loket:
- Best-in-class properties (Top 10%) achieve 57%+ occupancy, indicating high desirability and potentially optimized availability.
- Strong performing properties (Top 25%) maintain 43% or higher occupancy, suggesting good market fit and guest satisfaction.
- Typical properties (Median) have an occupancy rate around 28%.
- Entry-level properties (Bottom 25%) average 15% occupancy, potentially facing higher vacancy.
Average Monthly Occupancy Rate Trend in Loket
Average Daily Rate (ADR) Airbnb Trends in Loket (2026)
Effective short term rental pricing strategy in Loket involves understanding monthly ADR fluctuations. The Average Daily Rate (ADR) for Airbnb in Loket typically peaks in July and dips lowest during January. Leveraging Airbnb dynamic pricing tools or strategies based on this seasonality can significantly boost revenue. Here's a look at the typical nightly rates achieved:
- Best-in-class properties (Top 10%) command rates of $151+ per night, often due to premium features or locations.
- Strong performing properties (Top 25%) achieve nightly rates of $122 or more.
- Typical properties (Median) charge around $91 per night.
- Entry-level properties (Bottom 25%) earn around $73 per night.
Average Daily Rate (ADR) Trend by Month in Loket
Get Live Loket Market Intelligence 👇
Explore Real-time Analytics
Airbnb Seasonality Analysis & Trends in Loket (2026)
Peak Season (July, August, April)
- Revenue averages $1,475 per month
- Occupancy rates average 38.7%
- Daily rates average $113
Shoulder Season
- Revenue averages $1,071 per month
- Occupancy maintains around 34.4%
- Daily rates hold near $106
Low Season (January, February, November)
- Revenue drops to average $507 per month
- Occupancy decreases to average 16.0%
- Daily rates adjust to average $96
Seasonality Insights for Loket
- The Airbnb seasonality in Loket shows highly seasonal trends requiring careful strategy. While the sections above show seasonal averages, it's also insightful to look at the extremes:
- During the high season, the absolute peak month showcases Loket's highest earning potential, with monthly revenues capable of climbing to $1,780, occupancy reaching a high of 43.0%, and ADRs peaking at $122.
- Conversely, the slowest single month of the year, typically falling within the low season, marks the market's lowest point. In this month, revenue might dip to $390, occupancy could drop to 11.5%, and ADRs may adjust down to $95.
- Understanding both the seasonal averages and these monthly peaks and troughs in revenue, occupancy, and ADR is crucial for maximizing your Airbnb profit potential in Loket.
Seasonal Strategies for Maximizing Profit
- Peak Season: Maximize revenue through premium pricing and potentially longer minimum stays. Ensure high availability.
- Low Season: Offer competitive pricing, special promotions (e.g., extended stay discounts), and flexible cancellation policies. Target off-season travelers like remote workers or budget-conscious guests.
- Shoulder Seasons: Implement dynamic pricing that balances peak and low rates. Target weekend travelers or specific events. Offer slightly more flexible terms than peak season.
- Regularly analyze your own performance against these Loket seasonality benchmarks and adjust your pricing and availability strategy accordingly.
Best Areas for Airbnb Investment in Loket (2026)
Exploring the top neighborhoods for short-term rentals in Loket? This section highlights key areas, outlining why they are attractive for hosts and guests, along with notable local attractions. Consider these locations based on your target guest profile and investment strategy.
| Neighborhood / Area | Why Host Here? (Target Guests & Appeal) | Key Attractions & Landmarks |
|---|---|---|
| Loket Castle | A historical landmark providing a unique medieval experience. Attracts tourists interested in history and culture, with beautiful views and picturesque surroundings. | Loket Castle, Ohře River, Old Town, Church of St. Wenceslas, Local wineries |
| Spa Town of Karlovy Vary | Renowned for its hot springs and wellness tourism. A luxurious destination popular among tourists looking to relax and rejuvenate. | Mill Colonnade, Hot Spring, Diana Observation Tower, Karlovy Vary Museum, Becherovka Museum |
| Český Krumlov | A UNESCO World Heritage Site with a well-preserved medieval center. Popular among tourists who want to experience historic architecture and charm. | Český Krumlov Castle, Old Town, Vltava River, Egon Schiele Art Centrum, Historical Museum |
| Šumava National Park | Perfect for nature lovers and outdoor enthusiasts. Offers hiking, biking, and beautiful landscapes, attracting travelers seeking adventure. | Boubín Forest, Plešné Lake, Modrava Village, Černé Lake, Hiking Trails |
| Karlovy Vary International Film Festival | An annual film festival attracting celebrities and film enthusiasts from around the world. Offers unique opportunities for hosting guests during the event. | Film festival events, Film screenings, Cultural events, Local restaurants, Nightlife |
| Slavkovský les | Known for its natural beauty and hiking trails, it’s a great area for tourists interested in outdoor activities and tranquility. | Hiking trails, Lakes and ponds, Natural reserves, Scenic views, Wildlife watching |
| Marienbad (Mariánské Lázně) | Another famous spa town known for its mineral springs and beautiful parks. Ideal for visitors looking to enjoy the health benefits of its waters. | Colonnade, Dancing Fountain, Spa houses, Historical sites, Parks |
| Františkovy Lázně | A peaceful spa town attracting visitors looking for wellness and relaxation. It offers charming parks and therapeutic services. | Spa gardens, Thermal springs, Historic town center, Church of the Assumption, Cycling paths |
Understanding Airbnb License Requirements & STR Laws in Loket (2026)
While Loket, Karlovy Vary Region, Czechia currently shows low STR regulations, specific Airbnb license requirements might still exist or change. Always verify the latest short term rental regulations and Airbnb license requirements directly with local government authorities for Loket to ensure full compliance before hosting.
(Source: AirROI data, 2026, finding no licensed listings among those analyzed)
Top Performing Airbnb Properties in Loket (2026)
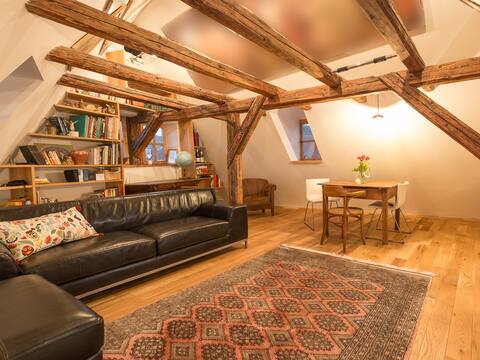
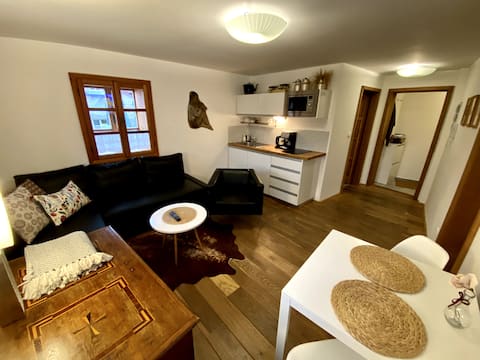
Benchmark your potential! Explore examples of top-performing Airbnb properties in Loketbased on Trailing Twelve Month (TTM) revenue. Analyze their characteristics, revenue, occupancy rate, and ADR to understand what drives success in this market.

Dvorská pastouška
Entire Place • 3 bedrooms

Loket OFF. Switch off with us.
Entire Place • 3 bedrooms
Apartment No. 59 Loket (room Delux)
Entire Place • 2 bedrooms
Apartment No. 59 Loket (room 2)
Entire Place • 1 bedroom

Julie Apartment
Entire Place • 2 bedrooms

Loket Island Suite
Entire Place • 2 bedrooms
Note: Performance varies based on location, size, amenities, seasonality, and management quality. Data reflects the past 12 months.
Top Performing Airbnb Hosts in Loket (2026)
Learn from the best! This table showcases top-performing Airbnb hosts in Loket based on the number of properties managed and estimated total revenue over the past year. Analyze their scale and performance metrics.
| Host Name | Properties | Grossing Revenue | Stay Reviews | Avg Rating |
|---|---|---|---|---|
| Barbora | 5 | $74,175 | 112 | 4.88/5.0 |
| Jakub | 4 | $41,918 | 139 | 4.86/5.0 |
| Lucie | 1 | $30,200 | 25 | 4.80/5.0 |
| Stanislav | 1 | $29,155 | 9 | 5.00/5.0 |
| Jitka | 1 | $14,961 | 72 | 4.97/5.0 |
| Marius | 1 | $14,940 | 9 | 4.89/5.0 |
| Mário | 3 | $13,088 | 16 | 4.81/5.0 |
| Josef | 2 | $5,711 | 102 | 4.84/5.0 |
| Martin | 1 | $5,057 | 7 | 4.43/5.0 |
| Marcela | 1 | $4,889 | 32 | 5.00/5.0 |
Analyzing the strategies of top hosts, such as their property selection, pricing, and guest communication, can offer valuable lessons for optimizing your own Airbnb operations in Loket.
Dive Deeper: Advanced Loket STR Market Data (2026)
Ready to unlock more insights? AirROI provides access to advanced metrics and comprehensive Airbnb data for Loket. Explore detailed analytics beyond this report to refine your investment strategy, optimize pricing, and maximize your vacation rental profits.
Explore Advanced MetricsLoket Short-Term Rental Market Composition (2026): Property & Room Types
Room Type Distribution
Property Type Distribution
Market Composition Insights for Loket
- The Loket Airbnb market composition is heavily skewed towards Entire Home/Apt listings, which make up 52.2% of the 23 active rentals. This indicates strong guest preference for privacy and space.
- However, a notable 47.8% share for Private Rooms suggests opportunities for budget-conscious travelers or hosts renting out spare rooms.
- Looking at the property type distribution in Loket, Apartment/Condo properties are the most common (47.8%), reflecting the local real estate landscape.
- The presence of 39.1% Hotel/Boutique listings indicates integration with traditional hospitality.
Loket Airbnb Room Capacity Analysis (2026): Bedroom Distribution
Distribution of Listings by Number of Bedrooms
Room Capacity Insights for Loket
- The dominant room capacity in Loket is 1 bedroom listings, making up 34.8% of the market. This suggests a strong demand for properties suitable for couples or solo travelers.
- Together, 1 bedroom and 2 bedrooms properties represent 56.5% of the active Airbnb listings in Loket, indicating a high concentration in these sizes.
- A significant 26.0% of listings offer 3+ bedrooms, catering to larger groups and families seeking more space in Loket.
Loket Vacation Rental Guest Capacity Trends (2026)
Distribution of Listings by Guest Capacity
Guest Capacity Insights for Loket
- The most common guest capacity trend in Loket vacation rentals is listings accommodating 4 guests (39.1%). This suggests the primary traveler segment is likely small families or groups.
- Properties designed for 4 guests and 8+ guests dominate the Loket STR market, accounting for 60.8% of listings.
- 21.7% of properties accommodate 6+ guests, serving the market segment for larger families or group travel in Loket.
- On average, properties in Loket are equipped to host 3.8 guests.
Loket Airbnb Booking Patterns (2026): Available vs. Booked Days
Available Days Distribution
Booked Days Distribution
Booking Pattern Insights for Loket
- The most common availability pattern in Loket falls within the 271-366 days range, representing 56.5% of listings. This suggests many properties have significant open periods on their calendars.
- Approximately 95.6% of listings show high availability (181+ days open annually), indicating potential for increased bookings or specific owner usage patterns.
- For booked days, the 31-90 days range is most frequent in Loket (43.5%), reflecting common guest stay durations or potential owner blocking patterns.
- A notable 8.7% of properties secure long booking periods (181+ days booked per year), highlighting successful long-term rental strategies or significant owner usage.
Loket Airbnb Minimum Stay Requirements Analysis
Distribution of Listings by Minimum Night Requirement
1 Night
9 listings
39.1% of total
2 Nights
12 listings
52.2% of total
4-6 Nights
1 listings
4.3% of total
30+ Nights
1 listings
4.3% of total
Key Insights
- The most prevalent minimum stay requirement in Loket is 2 Nights, adopted by 52.2% of listings. This highlights the market's preference for shorter, flexible bookings.
- A strong majority (91.3%) of the Loket Airbnb data shows acceptance of very short stays (1-2 nights), indicating a dynamic, high-turnover market.
Recommendations
- Align with the market by considering a 2 Nights minimum stay, as 52.2% of Loket hosts use this setting.
- Adjust minimum nights based on seasonality – potentially shorter during low season and longer during peak demand periods in Loket.
Loket Airbnb Cancellation Policy Trends Analysis (2026)
Super Strict 60 Days
2 listings
8.7% of total
Flexible
3 listings
13% of total
Moderate
3 listings
13% of total
Firm
14 listings
60.9% of total
Strict
1 listings
4.3% of total
Cancellation Policy Insights for Loket
- The prevailing Airbnb cancellation policy trend in Loket is Firm, used by 60.9% of listings.
- A majority (65.2%) of hosts in Loket utilize Firm or Strict policies, indicating a market where hosts prioritize booking security.
- Strict cancellation policies are quite rare (4.3%), potentially making listings with this policy less competitive unless justified by high demand or property type.
Recommendations for Hosts
- Consider adopting a Firm policy to align with the 60.9% market standard in Loket.
- Using a Strict policy might deter some guests, as only 4.3% of listings use it. Evaluate if potential revenue protection outweighs possible lower booking rates.
- Regularly review your cancellation policy against competitors and market demand shifts in Loket.
Loket STR Booking Lead Time Analysis (2026)
Average Booking Lead Time by Month
Booking Lead Time Insights for Loket
- The overall average booking lead time for vacation rentals in Loket is 48 days.
- Guests book furthest in advance for stays during December (average 69 days), likely coinciding with peak travel demand or local events.
- The shortest booking windows occur for stays in March (average 12 days), indicating more last-minute travel plans during this time.
- Seasonally, Summer (58 days avg.) sees the longest lead times, while Spring (34 days avg.) has the shortest, reflecting typical travel planning cycles.
Recommendations for Hosts
- Use the overall average lead time (48 days) as a baseline for your pricing and availability strategy in Loket.
- For December stays, consider implementing length-of-stay discounts or slightly higher rates for bookings made less than 69 days out to capitalize on advance planning.
- During March, focus on last-minute booking availability and promotions, as guests book with very short notice (12 days avg.).
- Target marketing efforts for the Summer season well in advance (at least 58 days) to capture early planners.
- Monitor your own booking lead times against these Loket averages to identify opportunities for dynamic pricing adjustments.
Popular & Essential Airbnb Amenities in Loket (2026)
Amenity Prevalence
Amenity Insights for Loket
- Essential amenities in Loket that guests expect include: Wifi, TV. Lacking these (any) could significantly impact bookings.
- Popular amenities like Pets allowed, Heating, Hangers are common but not universal. Offering these can provide a competitive edge.
Recommendations for Hosts
- Ensure your listing includes all essential amenities for Loket: Wifi, TV.
- Prioritize adding missing essentials: TV.
- Consider adding popular differentiators like Pets allowed or Heating to increase appeal.
- Highlight unique or less common amenities you offer (e.g., hot tub, dedicated workspace, EV charger) in your listing description and photos.
- Regularly check competitor amenities in Loket to stay competitive.
Loket Airbnb Guest Demographics & Profile Analysis (2026)
Guest Profile Summary for Loket
- The typical guest profile for Airbnb in Loket consists of predominantly international visitors (92%), with top international origins including Czechia, typically belonging to the Post-2000s (Gen Z/Alpha) group (50%), primarily speaking English or German.
- Domestic travelers account for 8.4% of guests.
- Key international markets include Germany (55.8%) and Czechia (8.4%).
- Top languages spoken are English (36.3%) followed by German (25.2%).
- A significant demographic segment is the Post-2000s (Gen Z/Alpha) group, representing 50% of guests.
Recommendations for Hosts
- Focus marketing internationally, particularly towards travelers from Czechia.
- Tailor amenities and listing descriptions to appeal to the dominant Post-2000s (Gen Z/Alpha) demographic (e.g., highlight fast WiFi, smart home features, local guides).
- Highlight unique local experiences or amenities relevant to the primary guest profile.
- Consider seasonal promotions aligned with peak travel times for key origin markets.
Nearby Short-Term Rental Market Comparison
How does the Loket Airbnb market stack up against its neighbors? Compare key performance metrics like average monthly revenue, ADR, and occupancy rates in surrounding areas to understand the broader regional STR landscape.
| Market | Active Properties | Monthly Revenue | Daily Rate | Avg. Occupancy |
|---|---|---|---|---|
| Löbnitz | 10 | $3,243 | $198.55 | 51% |
| Kollnburg | 12 | $2,526 | $317.10 | 32% |
| Drachselsried | 19 | $2,357 | $280.55 | 29% |
| Allersberg | 10 | $2,041 | $227.55 | 33% |
| Pouch | 12 | $1,972 | $190.12 | 37% |
| Kovářská | 19 | $1,859 | $207.44 | 32% |
| Krummennaab | 12 | $1,755 | $165.49 | 43% |
| Klipphausen | 14 | $1,720 | $120.64 | 48% |
| Am Ettersberg | 16 | $1,712 | $167.99 | 43% |
| Neukieritzsch | 39 | $1,695 | $141.94 | 42% |