Trutnov Airbnb Market Analysis 2025: Short Term Rental Data & Vacation Rental Statistics in Northeast, Czechia
Is Airbnb profitable in Trutnov in 2025? Explore comprehensive Airbnb analytics for Trutnov, Northeast, Czechia to uncover income potential. This 2025 STR market report for Trutnov, based on AirROI data from November 2024 to October 2025, reveals key trends in the niche market of 21 active listings.
Whether you're considering an Airbnb investment in Trutnov, optimizing your existing vacation rental, or exploring rental arbitrage opportunities, understanding the Trutnov Airbnb data is crucial. Leveraging the low regulation environment is key to maximizing your short term rental income potential. Let's dive into the specifics.
Key Trutnov Airbnb Performance Metrics Overview
Monthly Airbnb Revenue Variations & Income Potential in Trutnov (2025)
Understanding the monthly revenue variations for Airbnb listings in Trutnov is key to maximizing your short term rental income potential. Seasonality significantly impacts earnings. Our analysis, based on data from the past 12 months, shows that the peak revenue month for STRs in Trutnov is typically August, while March often presents the lowest earnings, highlighting opportunities for strategic pricing adjustments during shoulder and low seasons. Explore the typical Airbnb income in Trutnov across different performance tiers:
- Best-in-class properties (Top 10%) achieve $2,366+ monthly, often utilizing dynamic pricing and superior guest experiences.
- Strong performing properties (Top 25%) earn $1,290 or more, indicating effective management and desirable locations/amenities.
- Typical properties (Median) generate around $748 per month, representing the average market performance.
- Entry-level properties (Bottom 25%) see earnings around $413, often with potential for optimization.
Average Monthly Airbnb Earnings Trend in Trutnov
Trutnov Airbnb Occupancy Rate Trends (2025)
Maximize your bookings by understanding the Trutnov STR occupancy trends. Seasonal demand shifts significantly influence how often properties are booked. Typically, Augustsees the highest demand (peak season occupancy), while March experiences the lowest (low season). Effective strategies, like adjusting minimum stays or offering promotions, can boost occupancy during slower periods. Here's how different property tiers perform in Trutnov:
- Best-in-class properties (Top 10%) achieve 58%+ occupancy, indicating high desirability and potentially optimized availability.
- Strong performing properties (Top 25%) maintain 43% or higher occupancy, suggesting good market fit and guest satisfaction.
- Typical properties (Median) have an occupancy rate around 28%.
- Entry-level properties (Bottom 25%) average 17% occupancy, potentially facing higher vacancy.
Average Monthly Occupancy Rate Trend in Trutnov
Average Daily Rate (ADR) Airbnb Trends in Trutnov (2025)
Effective short term rental pricing strategy in Trutnov involves understanding monthly ADR fluctuations. The Average Daily Rate (ADR) for Airbnb in Trutnov typically peaks in July and dips lowest during April. Leveraging Airbnb dynamic pricing tools or strategies based on this seasonality can significantly boost revenue. Here's a look at the typical nightly rates achieved:
- Best-in-class properties (Top 10%) command rates of $209+ per night, often due to premium features or locations.
- Strong performing properties (Top 25%) achieve nightly rates of $108 or more.
- Typical properties (Median) charge around $82 per night.
- Entry-level properties (Bottom 25%) earn around $63 per night.
Average Daily Rate (ADR) Trend by Month in Trutnov
Get Live Trutnov Market Intelligence 👇

Explore Real-time Analytics
Airbnb Seasonality Analysis & Trends in Trutnov (2025)
Peak Season (August, July, October)
- Revenue averages $1,466 per month
- Occupancy rates average 37.8%
- Daily rates average $118
Shoulder Season
- Revenue averages $960 per month
- Occupancy maintains around 30.7%
- Daily rates hold near $105
Low Season (March, April, June)
- Revenue drops to average $821 per month
- Occupancy decreases to average 29.0%
- Daily rates adjust to average $101
Seasonality Insights for Trutnov
- The Airbnb seasonality in Trutnov shows highly seasonal trends requiring careful strategy. While the sections above show seasonal averages, it's also insightful to look at the extremes:
- During the high season, the absolute peak month showcases Trutnov's highest earning potential, with monthly revenues capable of climbing to $1,548, occupancy reaching a high of 42.3%, and ADRs peaking at $119.
- Conversely, the slowest single month of the year, typically falling within the low season, marks the market's lowest point. In this month, revenue might dip to $685, occupancy could drop to 28.0%, and ADRs may adjust down to $100.
- Understanding both the seasonal averages and these monthly peaks and troughs in revenue, occupancy, and ADR is crucial for maximizing your Airbnb profit potential in Trutnov.
Seasonal Strategies for Maximizing Profit
- Peak Season: Maximize revenue through premium pricing and potentially longer minimum stays. Ensure high availability.
- Low Season: Offer competitive pricing, special promotions (e.g., extended stay discounts), and flexible cancellation policies. Target off-season travelers like remote workers or budget-conscious guests.
- Shoulder Seasons: Implement dynamic pricing that balances peak and low rates. Target weekend travelers or specific events. Offer slightly more flexible terms than peak season.
- Regularly analyze your own performance against these Trutnov seasonality benchmarks and adjust your pricing and availability strategy accordingly.
Best Areas for Airbnb Investment in Trutnov (2025)
Exploring the top neighborhoods for short-term rentals in Trutnov? This section highlights key areas, outlining why they are attractive for hosts and guests, along with notable local attractions. Consider these locations based on your target guest profile and investment strategy.
| Neighborhood / Area | Why Host Here? (Target Guests & Appeal) | Key Attractions & Landmarks |
|---|---|---|
| Trutnov City Center | The heart of Trutnov with historical landmarks, shops, and cafes. Ideal for visitors looking to explore the city and its rich history. | Trutnov Castle, Church of St. Joseph, Trutnov Town Square, Krakonoš Museum, Špičák Ski Resort |
| Krkonošsko-jesenické Mountains | A beautiful mountainous region great for skiing in winter and hiking in summer. Attracts outdoor enthusiasts and nature lovers. | Sněžka Mountain, Liberec Zoo, Hiking trails, Černá Hora Mountain, Winter sports |
| Lázně Velichovky | A wellness area known for its health spas and tranquil environment. Perfect for guests seeking relaxation and health treatments. | Health spas, Spa treatments, Nature walks, Relaxation retreats |
| Bělý Potok | A picturesque village offering serene countryside views and access to nature. Appeals to those looking for a peaceful getaway. | Natural landscapes, Hiking trails, Local farms, Nature observation |
| St. Peter's Ski Resort | A popular ski resort that attracts winter sports enthusiasts. Ideal for Airbnb hosting during the ski season. | Ski slopes, Snowboarding, Winter hiking trails, Ski rentals, Gastronomy |
| Hostinné | A charming town with a mix of historical sites and access to outdoor activities. Suitable for tourists interested in local culture. | Historical buildings, Local markets, Riverside walks, Cycling paths |
| Voletiny | A small village that offers a quiet retreat with picturesque views. Attracts visitors looking for rural and nature experiences. | Scenic countryside, Traditional Czech culture, Local festivals |
| Hradec Králové | A nearby larger city offering vibrant city life, shopping, and cultural events. Ideal for those who want access to urban amenities while staying in Trutnov. | Hradec Králové Cathedral, White Tower, City park, Shopping centers, Cultural events |
Understanding Airbnb License Requirements & STR Laws in Trutnov (2025)
While Trutnov, Northeast, Czechia currently shows low STR regulations, specific Airbnb license requirements might still exist or change. Always verify the latest short term rental regulations and Airbnb license requirements directly with local government authorities for Trutnov to ensure full compliance before hosting.
(Source: AirROI data, 2025, finding no licensed listings among those analyzed)
Top Performing Airbnb Properties in Trutnov (2025)
Benchmark your potential! Explore examples of top-performing Airbnb properties in Trutnovbased on Trailing Twelve Month (TTM) revenue. Analyze their characteristics, revenue, occupancy rate, and ADR to understand what drives success in this market.

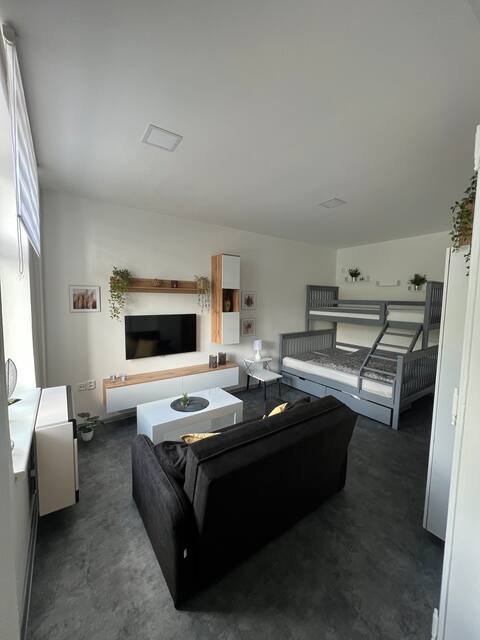
Tiny house Lhota 2 s koupacím sudem
Entire Place • 2 bedrooms
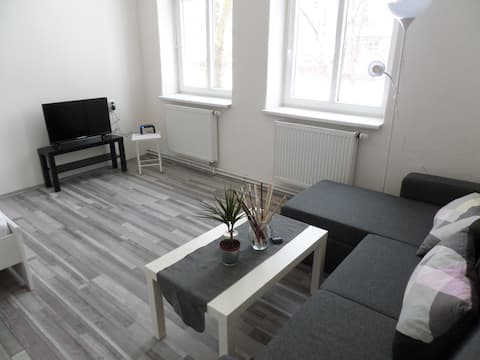
Apartmán v centru Trutnova
Entire Place • 1 bedroom
Apartment Trutnov Promenade
Entire Place • 1 bedroom

Holiday home with wellness by AlkaTravel
Entire Place • 6 bedrooms
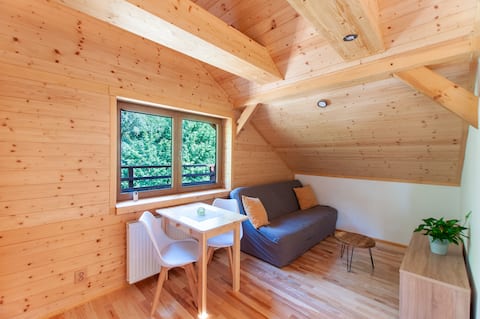
Apartmán ve srubu s balkónem
Entire Place • 1 bedroom
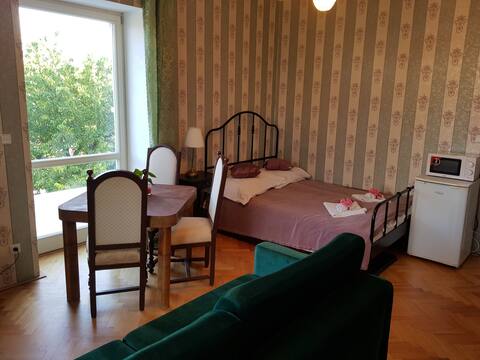
Accommodation in the old First Republic style :)
Private Room • 1 bedroom
Note: Performance varies based on location, size, amenities, seasonality, and management quality. Data reflects the past 12 months.
Top Performing Airbnb Hosts in Trutnov (2025)
Learn from the best! This table showcases top-performing Airbnb hosts in Trutnov based on the number of properties managed and estimated total revenue over the past year. Analyze their scale and performance metrics.
| Host Name | Properties | Grossing Revenue | Stay Reviews | Avg Rating |
|---|---|---|---|---|
| Miloš | 8 | $59,340 | 160 | 4.79/5.0 |
| Spravce | 3 | $30,062 | 25 | 4.76/5.0 |
| Adéla | 1 | $13,173 | 9 | 5.00/5.0 |
| Kateřina | 1 | $10,600 | 31 | 4.97/5.0 |
| Jarda | 2 | $9,874 | 75 | 4.87/5.0 |
| Renáta | 1 | $7,393 | 38 | 4.71/5.0 |
| David | 1 | $4,421 | 1 | Not Rated |
| Roman | 1 | $3,028 | 4 | 5.00/5.0 |
| Vladimír | 1 | $2,758 | 3 | 5.00/5.0 |
| Ilona | 1 | $1,633 | 61 | 4.85/5.0 |
Analyzing the strategies of top hosts, such as their property selection, pricing, and guest communication, can offer valuable lessons for optimizing your own Airbnb operations in Trutnov.
Dive Deeper: Advanced Trutnov STR Market Data (2025)
Ready to unlock more insights? AirROI provides access to advanced metrics and comprehensive Airbnb data for Trutnov. Explore detailed analytics beyond this report to refine your investment strategy, optimize pricing, and maximize your vacation rental profits.
Explore Advanced MetricsTrutnov Short-Term Rental Market Composition (2025): Property & Room Types
Room Type Distribution
Property Type Distribution
Market Composition Insights for Trutnov
- The Trutnov Airbnb market composition is heavily skewed towards Entire Home/Apt listings, which make up 61.9% of the 21 active rentals. This indicates strong guest preference for privacy and space.
- However, a notable 38.1% share for Private Rooms suggests opportunities for budget-conscious travelers or hosts renting out spare rooms.
- Looking at the property type distribution in Trutnov, House properties are the most common (42.9%), reflecting the local real estate landscape.
- Houses represent a significant 42.9% portion, catering likely to families or larger groups.
- The presence of 14.3% Hotel/Boutique listings indicates integration with traditional hospitality.
- Smaller segments like unique stays (combined 4.8%) offer potential for unique stay experiences.
Trutnov Airbnb Room Capacity Analysis (2025): Bedroom Distribution
Distribution of Listings by Number of Bedrooms
Room Capacity Insights for Trutnov
- The dominant room capacity in Trutnov is 1 bedroom listings, making up 33.3% of the market. This suggests a strong demand for properties suitable for couples or solo travelers.
- Together, 1 bedroom and 2 bedrooms properties represent 52.3% of the active Airbnb listings in Trutnov, indicating a high concentration in these sizes.
Trutnov Vacation Rental Guest Capacity Trends (2025)
Distribution of Listings by Guest Capacity
Guest Capacity Insights for Trutnov
- The most common guest capacity trend in Trutnov vacation rentals is listings accommodating 5 guests (19%). This suggests the primary traveler segment is likely larger groups.
- Properties designed for 5 guests and 4 guests dominate the Trutnov STR market, accounting for 38.0% of listings.
- 19.0% of properties accommodate 6+ guests, serving the market segment for larger families or group travel in Trutnov.
- On average, properties in Trutnov are equipped to host 3.4 guests.
Trutnov Airbnb Booking Patterns (2025): Available vs. Booked Days
Available Days Distribution
Booked Days Distribution
Booking Pattern Insights for Trutnov
- The most common availability pattern in Trutnov falls within the 271-366 days range, representing 66.7% of listings. This suggests many properties have significant open periods on their calendars.
- Approximately 95.3% of listings show high availability (181+ days open annually), indicating potential for increased bookings or specific owner usage patterns.
- For booked days, the 31-90 days range is most frequent in Trutnov (57.1%), reflecting common guest stay durations or potential owner blocking patterns.
- A notable 4.8% of properties secure long booking periods (181+ days booked per year), highlighting successful long-term rental strategies or significant owner usage.
Trutnov Airbnb Minimum Stay Requirements Analysis
Distribution of Listings by Minimum Night Requirement
1 Night
13 listings
61.9% of total
2 Nights
2 listings
9.5% of total
30+ Nights
6 listings
28.6% of total
Key Insights
- The most prevalent minimum stay requirement in Trutnov is 1 Night, adopted by 61.9% of listings. This highlights the market's preference for shorter, flexible bookings.
- A strong majority (71.4%) of the Trutnov Airbnb data shows acceptance of very short stays (1-2 nights), indicating a dynamic, high-turnover market.
- A significant segment (28.6%) caters to monthly stays (30+ nights) in Trutnov, pointing to opportunities in the extended-stay market.
Recommendations
- Align with the market by considering a 1 Night minimum stay, as 61.9% of Trutnov hosts use this setting.
- Explore offering discounts for stays of 30+ nights to attract the 28.6% of the market seeking extended stays.
- Adjust minimum nights based on seasonality – potentially shorter during low season and longer during peak demand periods in Trutnov.
Trutnov Airbnb Cancellation Policy Trends Analysis (2025)
Flexible
3 listings
14.3% of total
Moderate
4 listings
19% of total
Firm
13 listings
61.9% of total
Strict
1 listings
4.8% of total
Cancellation Policy Insights for Trutnov
- The prevailing Airbnb cancellation policy trend in Trutnov is Firm, used by 61.9% of listings.
- A majority (66.7%) of hosts in Trutnov utilize Firm or Strict policies, indicating a market where hosts prioritize booking security.
- Strict cancellation policies are quite rare (4.8%), potentially making listings with this policy less competitive unless justified by high demand or property type.
Recommendations for Hosts
- Consider adopting a Firm policy to align with the 61.9% market standard in Trutnov.
- Using a Strict policy might deter some guests, as only 4.8% of listings use it. Evaluate if potential revenue protection outweighs possible lower booking rates.
- Regularly review your cancellation policy against competitors and market demand shifts in Trutnov.
Trutnov STR Booking Lead Time Analysis (2025)
Average Booking Lead Time by Month
Booking Lead Time Insights for Trutnov
- The overall average booking lead time for vacation rentals in Trutnov is 50 days.
- Guests book furthest in advance for stays during November (average 81 days), likely coinciding with peak travel demand or local events.
- The shortest booking windows occur for stays in March (average 25 days), indicating more last-minute travel plans during this time.
- Seasonally, Fall (73 days avg.) sees the longest lead times, while Winter (34 days avg.) has the shortest, reflecting typical travel planning cycles.
Recommendations for Hosts
- Use the overall average lead time (50 days) as a baseline for your pricing and availability strategy in Trutnov.
- For November stays, consider implementing length-of-stay discounts or slightly higher rates for bookings made less than 81 days out to capitalize on advance planning.
- Target marketing efforts for the Fall season well in advance (at least 73 days) to capture early planners.
- Monitor your own booking lead times against these Trutnov averages to identify opportunities for dynamic pricing adjustments.
Popular & Essential Airbnb Amenities in Trutnov (2025)
Amenity Prevalence
Amenity Insights for Trutnov
- Essential amenities in Trutnov that guests expect include: Wifi. Lacking these (this) could significantly impact bookings.
- Popular amenities like Kitchen, TV, Heating are common but not universal. Offering these can provide a competitive edge.
Recommendations for Hosts
- Ensure your listing includes all essential amenities for Trutnov: Wifi.
- Prioritize adding missing essentials: Wifi.
- Consider adding popular differentiators like Kitchen or TV to increase appeal.
- Highlight unique or less common amenities you offer (e.g., hot tub, dedicated workspace, EV charger) in your listing description and photos.
- Regularly check competitor amenities in Trutnov to stay competitive.
Trutnov Airbnb Guest Demographics & Profile Analysis (2025)
Guest Profile Summary for Trutnov
- The typical guest profile for Airbnb in Trutnov consists of predominantly international visitors (78%), with top international origins including Czechia, typically belonging to the Post-2000s (Gen Z/Alpha) group (50%), primarily speaking English or German.
- Domestic travelers account for 21.7% of guests.
- Key international markets include Germany (30.4%) and Czechia (21.7%).
- Top languages spoken are English (41.3%) followed by German (23.8%).
- A significant demographic segment is the Post-2000s (Gen Z/Alpha) group, representing 50% of guests.
Recommendations for Hosts
- Focus marketing internationally, particularly towards travelers from Czechia.
- Tailor amenities and listing descriptions to appeal to the dominant Post-2000s (Gen Z/Alpha) demographic (e.g., highlight fast WiFi, smart home features, local guides).
- Highlight unique local experiences or amenities relevant to the primary guest profile.
- Consider seasonal promotions aligned with peak travel times for key origin markets.
Nearby Short-Term Rental Market Comparison
How does the Trutnov Airbnb market stack up against its neighbors? Compare key performance metrics like average monthly revenue, ADR, and occupancy rates in surrounding areas to understand the broader regional STR landscape.
| Market | Active Properties | Monthly Revenue | Daily Rate | Avg. Occupancy |
|---|---|---|---|---|
| Josefův Důl | 13 | $2,638 | $337.41 | 33% |
| Rudník | 19 | $2,537 | $213.89 | 28% |
| Smržovka | 20 | $2,312 | $192.80 | 44% |
| Capital City of Prague | 7,590 | $2,250 | $157.38 | 53% |
| Jablonné v Podještědí | 17 | $2,196 | $207.59 | 39% |
| Rathmannsdorf | 20 | $2,125 | $147.54 | 49% |
| Tisá | 14 | $2,039 | $175.42 | 41% |
| Burg (Spreewald) | 30 | $2,030 | $219.13 | 44% |
| Mladé Buky | 18 | $1,902 | $210.02 | 33% |
| Zachełmie | 14 | $1,882 | $198.35 | 36% |