Balka Airbnb Market Analysis 2026: Short Term Rental Data & Vacation Rental Statistics in Capital Region of Denmark, Denmark
Is Airbnb profitable in Balka in 2026? Explore comprehensive Airbnb analytics for Balka, Capital Region of Denmark, Denmark to uncover income potential. This 2026 STR market report for Balka, based on AirROI data from February 2025 to January 2026, reveals key trends in the niche market of 23 active listings.
Whether you're considering an Airbnb investment in Balka, optimizing your existing vacation rental, or exploring rental arbitrage opportunities, understanding the Balka Airbnb data is crucial. Leveraging the low regulation environment is key to maximizing your short term rental income potential. Let's dive into the specifics.
Key Balka Airbnb Performance Metrics Overview
Monthly Airbnb Revenue Variations & Income Potential in Balka (2026)
Understanding the monthly revenue variations for Airbnb listings in Balka is key to maximizing your short term rental income potential. Seasonality significantly impacts earnings. Our analysis, based on data from the past 12 months, shows that the peak revenue month for STRs in Balka is typically August, while January often presents the lowest earnings, highlighting opportunities for strategic pricing adjustments during shoulder and low seasons. Explore the typical Airbnb income in Balka across different performance tiers:
- Best-in-class properties (Top 10%) achieve $5,350+ monthly, often utilizing dynamic pricing and superior guest experiences.
- Strong performing properties (Top 25%) earn $3,181 or more, indicating effective management and desirable locations/amenities.
- Typical properties (Median) generate around $1,642 per month, representing the average market performance.
- Entry-level properties (Bottom 25%) see earnings around $780, often with potential for optimization.
Average Monthly Airbnb Earnings Trend in Balka
Balka Airbnb Occupancy Rate Trends (2026)
Maximize your bookings by understanding the Balka STR occupancy trends. Seasonal demand shifts significantly influence how often properties are booked. Typically, Augustsees the highest demand (peak season occupancy), while January experiences the lowest (low season). Effective strategies, like adjusting minimum stays or offering promotions, can boost occupancy during slower periods. Here's how different property tiers perform in Balka:
- Best-in-class properties (Top 10%) achieve 68%+ occupancy, indicating high desirability and potentially optimized availability.
- Strong performing properties (Top 25%) maintain 47% or higher occupancy, suggesting good market fit and guest satisfaction.
- Typical properties (Median) have an occupancy rate around 33%.
- Entry-level properties (Bottom 25%) average 22% occupancy, potentially facing higher vacancy.
Average Monthly Occupancy Rate Trend in Balka
Average Daily Rate (ADR) Airbnb Trends in Balka (2026)
Effective short term rental pricing strategy in Balka involves understanding monthly ADR fluctuations. The Average Daily Rate (ADR) for Airbnb in Balka typically peaks in November and dips lowest during September. Leveraging Airbnb dynamic pricing tools or strategies based on this seasonality can significantly boost revenue. Here's a look at the typical nightly rates achieved:
- Best-in-class properties (Top 10%) command rates of $445+ per night, often due to premium features or locations.
- Strong performing properties (Top 25%) achieve nightly rates of $352 or more.
- Typical properties (Median) charge around $206 per night.
- Entry-level properties (Bottom 25%) earn around $121 per night.
Average Daily Rate (ADR) Trend by Month in Balka
Get Live Balka Market Intelligence 👇

Explore Real-time Analytics
Airbnb Seasonality Analysis & Trends in Balka (2026)
Peak Season (August, July, June)
- Revenue averages $4,229 per month
- Occupancy rates average 64.2%
- Daily rates average $245
Shoulder Season
- Revenue averages $2,160 per month
- Occupancy maintains around 32.7%
- Daily rates hold near $246
Low Season (January, April, October)
- Revenue drops to average $1,362 per month
- Occupancy decreases to average 21.4%
- Daily rates adjust to average $250
Seasonality Insights for Balka
- The Airbnb seasonality in Balka shows highly seasonal trends requiring careful strategy. While the sections above show seasonal averages, it's also insightful to look at the extremes:
- During the high season, the absolute peak month showcases Balka's highest earning potential, with monthly revenues capable of climbing to $5,064, occupancy reaching a high of 77.9%, and ADRs peaking at $258.
- Conversely, the slowest single month of the year, typically falling within the low season, marks the market's lowest point. In this month, revenue might dip to $800, occupancy could drop to 6.5%, and ADRs may adjust down to $237.
- Understanding both the seasonal averages and these monthly peaks and troughs in revenue, occupancy, and ADR is crucial for maximizing your Airbnb profit potential in Balka.
Seasonal Strategies for Maximizing Profit
- Peak Season: Maximize revenue through premium pricing and potentially longer minimum stays. Ensure high availability.
- Low Season: Offer competitive pricing, special promotions (e.g., extended stay discounts), and flexible cancellation policies. Target off-season travelers like remote workers or budget-conscious guests.
- Shoulder Seasons: Implement dynamic pricing that balances peak and low rates. Target weekend travelers or specific events. Offer slightly more flexible terms than peak season.
- Regularly analyze your own performance against these Balka seasonality benchmarks and adjust your pricing and availability strategy accordingly.
Best Areas for Airbnb Investment in Balka (2026)
Exploring the top neighborhoods for short-term rentals in Balka? This section highlights key areas, outlining why they are attractive for hosts and guests, along with notable local attractions. Consider these locations based on your target guest profile and investment strategy.
| Neighborhood / Area | Why Host Here? (Target Guests & Appeal) | Key Attractions & Landmarks |
|---|---|---|
| Vesterbro | A vibrant and trendy district known for its cafes, bars, and cultural offerings. It's popular among young travelers and those looking for a lively atmosphere close to the city center. | Tivoli Gardens, Vesterbro Food Hall, Copenhagen Zoo, Sculpture by the Sea, Landbohøjskolens Have |
| Nørrebro | A culturally diverse area filled with unique shops, restaurants, and parks. It's known for its youthful energy and is a favorite among students and creatives. | Assistens Cemetery, Nørrebrogade shopping street, Superkilen park, The Black Diamond, Flintholm Park |
| Christianshavn | A historic waterfront area with charming canals, known for its picturesque buildings and the famous Freetown Christiania. Attracts tourists looking for a unique experience. | Christiansborg Palace, The Little Mermaid, Freetown Christiania, The Danish Royal Library, Copenhagen Opera House |
| Indre By | The historic city center of Copenhagen, rich in history and architecture. A prime location for tourists who want to explore major sights easily. | Nyhavn, Rosenborg Castle, The Round Tower, Amalienborg Palace, Strøget |
| Østerbro | A family-friendly area known for its parks and waterfront attractions. It offers a quieter, more local vibe, making it popular with families and long-term visitors. | The Lakes, Fælledparken, B&W Hallerne, Hirschsprung Collection, Parken Stadium |
| Frederiksberg | An upscale area with beautiful parks and elegant buildings. It’s a favorite among those looking for a more luxurious stay close to the city center. | Frederiksberg Gardens, Copenhagen Zoo, Frederiksberg Palace, Islands Brygge, Café Dyrehaven |
| Amager | This island district is known for its blend of urban life and nature, appealing to both locals and tourists seeking recreation and local culture. | Amager Strandpark, Copenhagen Opera House, Dybevaad Canal, The Blue Planet, Kastrup Fortress |
| Ballerup | A quieter suburban area with access to nature and parks. It's ideal for families and business travelers looking for a peaceful retreat while still being close to the city. | Ballerup Town Centre, Ballerup Forest, Bakkerne Park, Jægersborg Dyrehave, Ballerup Super Arena |
Understanding Airbnb License Requirements & STR Laws in Balka (2026)
While Balka, Capital Region of Denmark, Denmark currently shows low STR regulations, specific Airbnb license requirements might still exist or change. Always verify the latest short term rental regulations and Airbnb license requirements directly with local government authorities for Balka to ensure full compliance before hosting.
(Source: AirROI data, 2026, finding no licensed listings among those analyzed)
Top Performing Airbnb Properties in Balka (2026)
Benchmark your potential! Explore examples of top-performing Airbnb properties in Balkabased on Trailing Twelve Month (TTM) revenue. Analyze their characteristics, revenue, occupancy rate, and ADR to understand what drives success in this market.
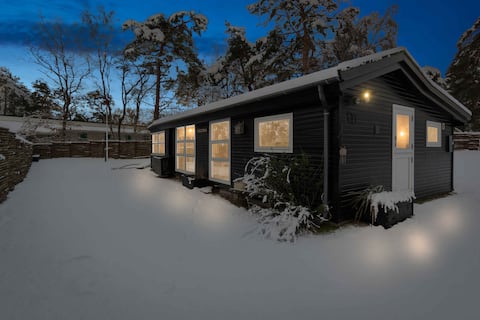
Cozy beach bungalow close to Balka Beach
Entire Place • 3 bedrooms

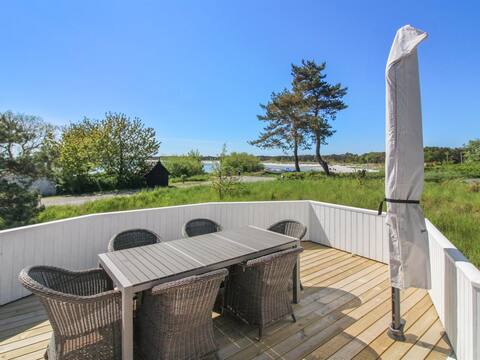
Idyllic cottage near the beach
Entire Place • 3 bedrooms
"Julietta" - 50m from the sea by Interhome
Entire Place • 3 bedrooms
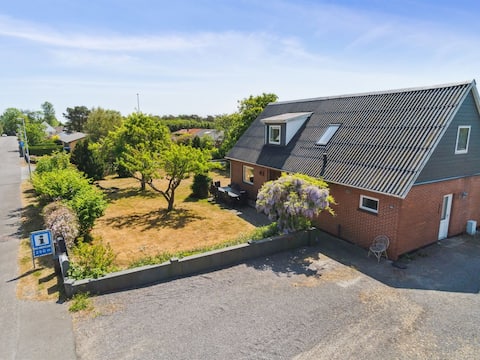
"Angelie" - 350m from the sea by Interhome
Entire Place • 5 bedrooms

"Riitta" - 250m from the sea by Interhome
Entire Place • 1 bedroom
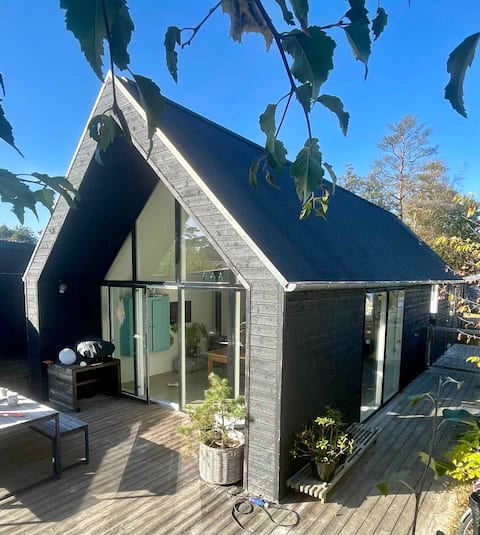
Modern and cozy summer house in beautiful Balka
Entire Place • 2 bedrooms
Note: Performance varies based on location, size, amenities, seasonality, and management quality. Data reflects the past 12 months.
Top Performing Airbnb Hosts in Balka (2026)
Learn from the best! This table showcases top-performing Airbnb hosts in Balka based on the number of properties managed and estimated total revenue over the past year. Analyze their scale and performance metrics.
| Host Name | Properties | Grossing Revenue | Stay Reviews | Avg Rating |
|---|---|---|---|---|
| Paulina - Interhome | 4 | $88,750 | 5 | Not Rated |
| Campaya | 3 | $74,672 | 6 | 5.00/5.0 |
| Annika - Interhome | 3 | $49,325 | 6 | 4.67/5.0 |
| Nanna | 1 | $39,481 | 14 | 4.93/5.0 |
| Ida | 1 | $17,322 | 164 | 4.80/5.0 |
| Bernd | 1 | $13,297 | 39 | 4.95/5.0 |
| Nora | 1 | $12,751 | 37 | 4.86/5.0 |
| Jens | 1 | $12,329 | 41 | 4.68/5.0 |
| Rachel | 1 | $10,882 | 1 | Not Rated |
| Jannie | 1 | $10,019 | 17 | 4.94/5.0 |
Analyzing the strategies of top hosts, such as their property selection, pricing, and guest communication, can offer valuable lessons for optimizing your own Airbnb operations in Balka.
Dive Deeper: Advanced Balka STR Market Data (2026)
Ready to unlock more insights? AirROI provides access to advanced metrics and comprehensive Airbnb data for Balka. Explore detailed analytics beyond this report to refine your investment strategy, optimize pricing, and maximize your vacation rental profits.
Explore Advanced MetricsBalka Short-Term Rental Market Composition (2026): Property & Room Types
Room Type Distribution
Property Type Distribution
Market Composition Insights for Balka
- The Balka Airbnb market composition is heavily skewed towards Entire Home/Apt listings, which make up 95.7% of the 23 active rentals. This indicates strong guest preference for privacy and space.
- Looking at the property type distribution in Balka, House properties are the most common (73.9%), reflecting the local real estate landscape.
- Houses represent a significant 73.9% portion, catering likely to families or larger groups.
- The presence of 8.7% Hotel/Boutique listings indicates integration with traditional hospitality.
Balka Airbnb Room Capacity Analysis (2026): Bedroom Distribution
Distribution of Listings by Number of Bedrooms
Room Capacity Insights for Balka
- The dominant room capacity in Balka is 2 bedrooms listings, making up 39.1% of the market. This suggests a strong demand for properties suitable for couples or solo travelers.
- Together, 2 bedrooms and 3 bedrooms properties represent 60.8% of the active Airbnb listings in Balka, indicating a high concentration in these sizes.
- A significant 34.7% of listings offer 3+ bedrooms, catering to larger groups and families seeking more space in Balka.
Balka Vacation Rental Guest Capacity Trends (2026)
Distribution of Listings by Guest Capacity
Guest Capacity Insights for Balka
- The most common guest capacity trend in Balka vacation rentals is listings accommodating 4 guests (39.1%). This suggests the primary traveler segment is likely small families or groups.
- Properties designed for 4 guests and 6 guests dominate the Balka STR market, accounting for 56.5% of listings.
- 30.4% of properties accommodate 6+ guests, serving the market segment for larger families or group travel in Balka.
- On average, properties in Balka are equipped to host 4.5 guests.
Balka Airbnb Booking Patterns (2026): Available vs. Booked Days
Available Days Distribution
Booked Days Distribution
Booking Pattern Insights for Balka
- The most common availability pattern in Balka falls within the 271-366 days range, representing 73.9% of listings. This suggests many properties have significant open periods on their calendars.
- Approximately 100.0% of listings show high availability (181+ days open annually), indicating potential for increased bookings or specific owner usage patterns.
- For booked days, the 31-90 days range is most frequent in Balka (47.8%), reflecting common guest stay durations or potential owner blocking patterns.
Balka Airbnb Minimum Stay Requirements Analysis
Distribution of Listings by Minimum Night Requirement
1 Night
9 listings
39.1% of total
2 Nights
1 listings
4.3% of total
4-6 Nights
5 listings
21.7% of total
30+ Nights
8 listings
34.8% of total
Key Insights
- The most prevalent minimum stay requirement in Balka is 1 Night, adopted by 39.1% of listings. This highlights the market's preference for shorter, flexible bookings.
- A significant segment (34.8%) caters to monthly stays (30+ nights) in Balka, pointing to opportunities in the extended-stay market.
Recommendations
- Align with the market by considering a 1 Night minimum stay, as 39.1% of Balka hosts use this setting.
- Explore offering discounts for stays of 30+ nights to attract the 34.8% of the market seeking extended stays.
- Adjust minimum nights based on seasonality – potentially shorter during low season and longer during peak demand periods in Balka.
Balka Airbnb Cancellation Policy Trends Analysis (2026)
Super Strict 30 Days
2 listings
8.7% of total
Flexible
4 listings
17.4% of total
Moderate
2 listings
8.7% of total
Firm
14 listings
60.9% of total
Strict
1 listings
4.3% of total
Cancellation Policy Insights for Balka
- The prevailing Airbnb cancellation policy trend in Balka is Firm, used by 60.9% of listings.
- A majority (65.2%) of hosts in Balka utilize Firm or Strict policies, indicating a market where hosts prioritize booking security.
- Strict cancellation policies are quite rare (4.3%), potentially making listings with this policy less competitive unless justified by high demand or property type.
Recommendations for Hosts
- Consider adopting a Firm policy to align with the 60.9% market standard in Balka.
- Using a Strict policy might deter some guests, as only 4.3% of listings use it. Evaluate if potential revenue protection outweighs possible lower booking rates.
- Regularly review your cancellation policy against competitors and market demand shifts in Balka.
Balka STR Booking Lead Time Analysis (2026)
Average Booking Lead Time by Month
Booking Lead Time Insights for Balka
- The overall average booking lead time for vacation rentals in Balka is 120 days.
- Guests book furthest in advance for stays during January (average 286 days), likely coinciding with peak travel demand or local events.
- The shortest booking windows occur for stays in February (average 21 days), indicating more last-minute travel plans during this time.
- Seasonally, Winter (155 days avg.) sees the longest lead times, while Spring (64 days avg.) has the shortest, reflecting typical travel planning cycles.
Recommendations for Hosts
- Use the overall average lead time (120 days) as a baseline for your pricing and availability strategy in Balka.
- For January stays, consider implementing length-of-stay discounts or slightly higher rates for bookings made less than 286 days out to capitalize on advance planning.
- Target marketing efforts for the Winter season well in advance (at least 155 days) to capture early planners.
- Monitor your own booking lead times against these Balka averages to identify opportunities for dynamic pricing adjustments.
Popular & Essential Airbnb Amenities in Balka (2026)
Amenity Prevalence
Amenity Insights for Balka
- Essential amenities in Balka that guests expect include: Wifi, Kitchen. Lacking these (any) could significantly impact bookings.
- Popular amenities like BBQ grill, Heating, Dishes and silverware are common but not universal. Offering these can provide a competitive edge.
Recommendations for Hosts
- Ensure your listing includes all essential amenities for Balka: Wifi, Kitchen.
- Prioritize adding missing essentials: Wifi, Kitchen.
- Consider adding popular differentiators like BBQ grill or Heating to increase appeal.
- Highlight unique or less common amenities you offer (e.g., hot tub, dedicated workspace, EV charger) in your listing description and photos.
- Regularly check competitor amenities in Balka to stay competitive.
Balka Airbnb Guest Demographics & Profile Analysis (2026)
Guest Profile Summary for Balka
- The typical guest profile for Airbnb in Balka consists of a mix of domestic (46%) and international guests, with top international origins including Germany, typically belonging to the Post-2000s (Gen Z/Alpha) group (50%), primarily speaking English or German.
- Domestic travelers account for 46.4% of guests.
- Key international markets include Denmark (46.4%) and Germany (37.5%).
- Top languages spoken are English (31.8%) followed by German (19.7%).
- A significant demographic segment is the Post-2000s (Gen Z/Alpha) group, representing 50% of guests.
Recommendations for Hosts
- Balance marketing efforts between domestic and international channels based on the guest mix.
- Tailor amenities and listing descriptions to appeal to the dominant Post-2000s (Gen Z/Alpha) demographic (e.g., highlight fast WiFi, smart home features, local guides).
- Highlight unique local experiences or amenities relevant to the primary guest profile.
- Consider seasonal promotions aligned with peak travel times for key origin markets.
Nearby Short-Term Rental Market Comparison
How does the Balka Airbnb market stack up against its neighbors? Compare key performance metrics like average monthly revenue, ADR, and occupancy rates in surrounding areas to understand the broader regional STR landscape.
| Market | Active Properties | Monthly Revenue | Daily Rate | Avg. Occupancy |
|---|---|---|---|---|
| Tejn | 60 | $2,181 | $275.98 | 43% |
| Östra Göinge kommun | 10 | $2,138 | $216.64 | 45% |
| Skogsby | 10 | $2,121 | $234.77 | 50% |
| Årsdale | 37 | $1,750 | $220.09 | 41% |
| Allinge-Sandvig | 88 | $1,711 | $235.69 | 39% |
| Listed | 11 | $1,637 | $169.96 | 48% |
| Bornholm Regional Municipality | 223 | $1,568 | $229.06 | 41% |
| Svaneke | 56 | $1,546 | $196.01 | 42% |
| Osby kommun | 35 | $1,467 | $145.20 | 42% |
| Immeln | 15 | $1,465 | $192.18 | 38% |