Bornholm Regional Municipality Airbnb Market Analysis 2026: Short Term Rental Data & Vacation Rental Statistics in Capital Region of Denmark, Denmark
Is Airbnb profitable in Bornholm Regional Municipality in 2026? Explore comprehensive Airbnb analytics for Bornholm Regional Municipality, Capital Region of Denmark, Denmark to uncover income potential. This 2026 STR market report for Bornholm Regional Municipality, based on AirROI data from February 2025 to January 2026, reveals key trends in the market of 223 active listings.
Whether you're considering an Airbnb investment in Bornholm Regional Municipality, optimizing your existing vacation rental, or exploring rental arbitrage opportunities, understanding the Bornholm Regional Municipality Airbnb data is crucial. Leveraging the low regulation environment is key to maximizing your short term rental income potential. Let's dive into the specifics.
Key Bornholm Regional Municipality Airbnb Performance Metrics Overview
Monthly Airbnb Revenue Variations & Income Potential in Bornholm Regional Municipality (2026)
Understanding the monthly revenue variations for Airbnb listings in Bornholm Regional Municipality is key to maximizing your short term rental income potential. Seasonality significantly impacts earnings. Our analysis, based on data from the past 12 months, shows that the peak revenue month for STRs in Bornholm Regional Municipality is typically July, while January often presents the lowest earnings, highlighting opportunities for strategic pricing adjustments during shoulder and low seasons. Explore the typical Airbnb income in Bornholm Regional Municipality across different performance tiers:
- Best-in-class properties (Top 10%) achieve $5,755+ monthly, often utilizing dynamic pricing and superior guest experiences.
- Strong performing properties (Top 25%) earn $3,639 or more, indicating effective management and desirable locations/amenities.
- Typical properties (Median) generate around $2,021 per month, representing the average market performance.
- Entry-level properties (Bottom 25%) see earnings around $1,003, often with potential for optimization.
Average Monthly Airbnb Earnings Trend in Bornholm Regional Municipality
Bornholm Regional Municipality Airbnb Occupancy Rate Trends (2026)
Maximize your bookings by understanding the Bornholm Regional Municipality STR occupancy trends. Seasonal demand shifts significantly influence how often properties are booked. Typically, Julysees the highest demand (peak season occupancy), while January experiences the lowest (low season). Effective strategies, like adjusting minimum stays or offering promotions, can boost occupancy during slower periods. Here's how different property tiers perform in Bornholm Regional Municipality:
- Best-in-class properties (Top 10%) achieve 72%+ occupancy, indicating high desirability and potentially optimized availability.
- Strong performing properties (Top 25%) maintain 53% or higher occupancy, suggesting good market fit and guest satisfaction.
- Typical properties (Median) have an occupancy rate around 34%.
- Entry-level properties (Bottom 25%) average 18% occupancy, potentially facing higher vacancy.
Average Monthly Occupancy Rate Trend in Bornholm Regional Municipality
Average Daily Rate (ADR) Airbnb Trends in Bornholm Regional Municipality (2026)
Effective short term rental pricing strategy in Bornholm Regional Municipality involves understanding monthly ADR fluctuations. The Average Daily Rate (ADR) for Airbnb in Bornholm Regional Municipality typically peaks in July and dips lowest during March. Leveraging Airbnb dynamic pricing tools or strategies based on this seasonality can significantly boost revenue. Here's a look at the typical nightly rates achieved:
- Best-in-class properties (Top 10%) command rates of $415+ per night, often due to premium features or locations.
- Strong performing properties (Top 25%) achieve nightly rates of $275 or more.
- Typical properties (Median) charge around $191 per night.
- Entry-level properties (Bottom 25%) earn around $135 per night.
Average Daily Rate (ADR) Trend by Month in Bornholm Regional Municipality
Get Live Bornholm Regional Municipality Market Intelligence 👇

Explore Real-time Analytics
Airbnb Seasonality Analysis & Trends in Bornholm Regional Municipality (2026)
Peak Season (July, August, June)
- Revenue averages $4,457 per month
- Occupancy rates average 57.1%
- Daily rates average $240
Shoulder Season
- Revenue averages $2,377 per month
- Occupancy maintains around 34.6%
- Daily rates hold near $222
Low Season (January, November, December)
- Revenue drops to average $1,470 per month
- Occupancy decreases to average 21.6%
- Daily rates adjust to average $229
Seasonality Insights for Bornholm Regional Municipality
- The Airbnb seasonality in Bornholm Regional Municipality shows highly seasonal trends requiring careful strategy. While the sections above show seasonal averages, it's also insightful to look at the extremes:
- During the high season, the absolute peak month showcases Bornholm Regional Municipality's highest earning potential, with monthly revenues capable of climbing to $5,405, occupancy reaching a high of 66.1%, and ADRs peaking at $242.
- Conversely, the slowest single month of the year, typically falling within the low season, marks the market's lowest point. In this month, revenue might dip to $920, occupancy could drop to 14.4%, and ADRs may adjust down to $215.
- Understanding both the seasonal averages and these monthly peaks and troughs in revenue, occupancy, and ADR is crucial for maximizing your Airbnb profit potential in Bornholm Regional Municipality.
Seasonal Strategies for Maximizing Profit
- Peak Season: Maximize revenue through premium pricing and potentially longer minimum stays. Ensure high availability.
- Low Season: Offer competitive pricing, special promotions (e.g., extended stay discounts), and flexible cancellation policies. Target off-season travelers like remote workers or budget-conscious guests.
- Shoulder Seasons: Implement dynamic pricing that balances peak and low rates. Target weekend travelers or specific events. Offer slightly more flexible terms than peak season.
- Regularly analyze your own performance against these Bornholm Regional Municipality seasonality benchmarks and adjust your pricing and availability strategy accordingly.
Best Areas for Airbnb Investment in Bornholm Regional Municipality (2026)
Exploring the top neighborhoods for short-term rentals in Bornholm Regional Municipality? This section highlights key areas, outlining why they are attractive for hosts and guests, along with notable local attractions. Consider these locations based on your target guest profile and investment strategy.
| Neighborhood / Area | Why Host Here? (Target Guests & Appeal) | Key Attractions & Landmarks |
|---|---|---|
| Hasle | A charming coastal village known for its beautiful beaches and proximity to nature. Ideal for those looking for a relaxing seaside getaway with easy access to local attractions and outdoor activities. | Hasle Beach, Hasle Harbour, Hammershus Castle ruin, Bornholm Art Museum, Jons Kapel |
| Snogebæk | A picturesque seaside town famous for its quaint harbor and idyllic beach. Attracts tourists seeking a peaceful retreat with opportunities for water sports and local dining. | Snogebæk Beach, Snogebæk Havn, Trompe L'Oeil Murals, Bornholm Brewery, Lighthouse at Dueodde |
| Rønne | The largest town on Bornholm, offering a blend of urban amenities and beautiful coastal scenery. Great for tourists who want access to shops, restaurants, and cultural experiences. | Rønne Harbour, Bornholms Museum, Hasselholm Watermill, Færgehavn Rønne, Oluf Høst Museum |
| Allinge | A vibrant town with stunning cliffs and rich history. Popular for outdoor enthusiasts and those interested in exploring Bornholm's natural beauty. | Allinge Beach, Sandvig Beach, Hammershus Castle, De Blå Lagune, The Equestrian Statue of King Frederik IX |
| Sandvig | Known for its scenic beaches and dramatic cliffs, Sandvig is perfect for travelers who appreciate nature and outdoor activities, including hiking and cycling. | Sandvig Beach, The Hammeren Lighthouse, Molleklint Cliffs, Hammersø, The round church of Østerlars |
| Dueodde | Famous for its long sandy beaches and nature reserve, Dueodde attracts families and nature lovers, offering a serene atmosphere and plenty of recreational activities. | Dueodde Beach, Dueodde Lighthouse, Dueodde Nature Reserve, Bornholm's Tourist office, Beach activities |
| Nexø | A charming town with a rich fishing heritage, it's great for visitors looking for local culture and cuisine, along with beautiful beach areas for relaxation. | Nexø Harbour, Bornholm's Smokehouse, Sildesøen Lake, Nexø Museum, Balka Beach |
| Svaneke | Known for its well-preserved architecture and artisanal shops, Svaneke appeals to those seeking a cultural experience with local craftsmanship and stunning coastal views. | Svaneke Harbour, Svaneke Brewery, The Old Windmill, Svaneke Glass, The Beach in Svaneke |
Understanding Airbnb License Requirements & STR Laws in Bornholm Regional Municipality (2026)
While Bornholm Regional Municipality, Capital Region of Denmark, Denmark currently shows low STR regulations, specific Airbnb license requirements might still exist or change. Always verify the latest short term rental regulations and Airbnb license requirements directly with local government authorities for Bornholm Regional Municipality to ensure full compliance before hosting.
(Source: AirROI data, 2026, finding no licensed listings among those analyzed)
Top Performing Airbnb Properties in Bornholm Regional Municipality (2026)
Benchmark your potential! Explore examples of top-performing Airbnb properties in Bornholm Regional Municipalitybased on Trailing Twelve Month (TTM) revenue. Analyze their characteristics, revenue, occupancy rate, and ADR to understand what drives success in this market.
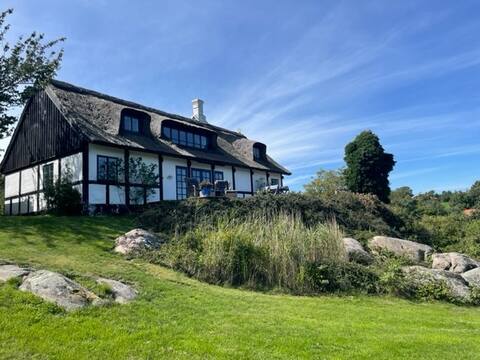
Bornholmsk ferieidyl
Entire Place • 4 bedrooms
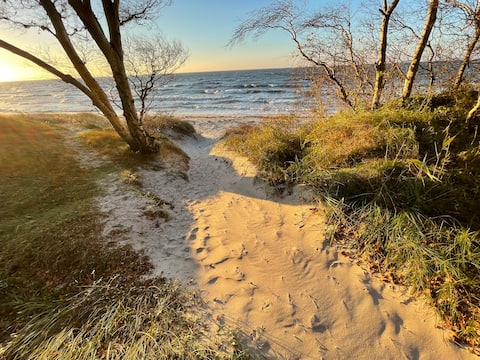
Amazing cottage just by the beach
Entire Place • 3 bedrooms
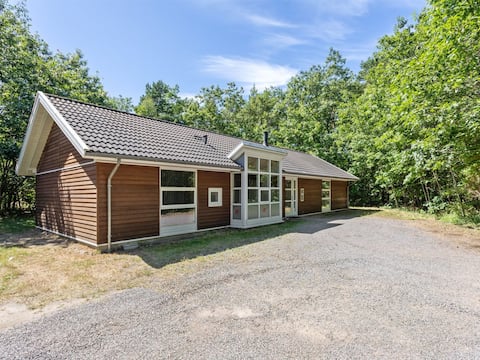
"Dafne" - 600m from the sea by Interhome
Entire Place • 4 bedrooms
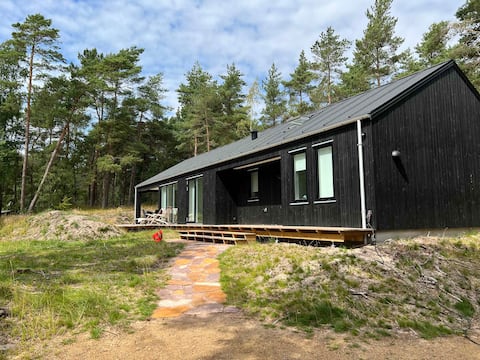
Architect-designed summer house on Bornholm
Entire Place • 4 bedrooms

Lovely spacious holiday home on Bornholm
Entire Place • 3 bedrooms

Cottage in peaceful surroundings in Vester Sømark
Entire Place • 3 bedrooms
Note: Performance varies based on location, size, amenities, seasonality, and management quality. Data reflects the past 12 months.
Top Performing Airbnb Hosts in Bornholm Regional Municipality (2026)
Learn from the best! This table showcases top-performing Airbnb hosts in Bornholm Regional Municipality based on the number of properties managed and estimated total revenue over the past year. Analyze their scale and performance metrics.
| Host Name | Properties | Grossing Revenue | Stay Reviews | Avg Rating |
|---|---|---|---|---|
| Campaya | 25 | $861,364 | 124 | 4.46/5.0 |
| Annika - Interhome | 30 | $729,437 | 42 | 5.00/5.0 |
| Paulina - Interhome | 16 | $360,237 | 20 | Not Rated |
| Pia | 1 | $89,165 | 23 | 5.00/5.0 |
| Ellen - DANCENTER | 23 | $86,798 | 144 | 4.18/5.0 |
| Enete | 1 | $83,271 | 195 | 4.92/5.0 |
| Vaida | 2 | $48,528 | 11 | 4.82/5.0 |
| Torben | 1 | $48,017 | 95 | 4.98/5.0 |
| Ida Marie | 1 | $47,007 | 95 | 4.81/5.0 |
| Ditte | 1 | $40,034 | 2 | Not Rated |
Analyzing the strategies of top hosts, such as their property selection, pricing, and guest communication, can offer valuable lessons for optimizing your own Airbnb operations in Bornholm Regional Municipality.
Dive Deeper: Advanced Bornholm Regional Municipality STR Market Data (2026)
Ready to unlock more insights? AirROI provides access to advanced metrics and comprehensive Airbnb data for Bornholm Regional Municipality. Explore detailed analytics beyond this report to refine your investment strategy, optimize pricing, and maximize your vacation rental profits.
Explore Advanced MetricsBornholm Regional Municipality Short-Term Rental Market Composition (2026): Property & Room Types
Room Type Distribution
Property Type Distribution
Market Composition Insights for Bornholm Regional Municipality
- The Bornholm Regional Municipality Airbnb market composition is heavily skewed towards Entire Home/Apt listings, which make up 92.8% of the 223 active rentals. This indicates strong guest preference for privacy and space.
- Looking at the property type distribution in Bornholm Regional Municipality, House properties are the most common (69.1%), reflecting the local real estate landscape.
- Houses represent a significant 69.1% portion, catering likely to families or larger groups.
- Smaller segments like hotel/boutique, others, unique stays (combined 6.7%) offer potential for unique stay experiences.
Bornholm Regional Municipality Airbnb Room Capacity Analysis (2026): Bedroom Distribution
Distribution of Listings by Number of Bedrooms
Room Capacity Insights for Bornholm Regional Municipality
- The dominant room capacity in Bornholm Regional Municipality is 3 bedrooms listings, making up 37.2% of the market. This suggests a strong demand for properties suitable for families or small groups.
- Together, 3 bedrooms and 2 bedrooms properties represent 60.5% of the active Airbnb listings in Bornholm Regional Municipality, indicating a high concentration in these sizes.
- A significant 55.5% of listings offer 3+ bedrooms, catering to larger groups and families seeking more space in Bornholm Regional Municipality.
Bornholm Regional Municipality Vacation Rental Guest Capacity Trends (2026)
Distribution of Listings by Guest Capacity
Guest Capacity Insights for Bornholm Regional Municipality
- The most common guest capacity trend in Bornholm Regional Municipality vacation rentals is listings accommodating 6 guests (30%). This suggests the primary traveler segment is likely larger groups.
- Properties designed for 6 guests and 4 guests dominate the Bornholm Regional Municipality STR market, accounting for 56.5% of listings.
- 51.0% of properties accommodate 6+ guests, serving the market segment for larger families or group travel in Bornholm Regional Municipality.
- On average, properties in Bornholm Regional Municipality are equipped to host 5.1 guests.
Bornholm Regional Municipality Airbnb Booking Patterns (2026): Available vs. Booked Days
Available Days Distribution
Booked Days Distribution
Booking Pattern Insights for Bornholm Regional Municipality
- The most common availability pattern in Bornholm Regional Municipality falls within the 271-366 days range, representing 65.5% of listings. This suggests many properties have significant open periods on their calendars.
- Approximately 93.3% of listings show high availability (181+ days open annually), indicating potential for increased bookings or specific owner usage patterns.
- For booked days, the 31-90 days range is most frequent in Bornholm Regional Municipality (42.2%), reflecting common guest stay durations or potential owner blocking patterns.
- A notable 7.6% of properties secure long booking periods (181+ days booked per year), highlighting successful long-term rental strategies or significant owner usage.
Bornholm Regional Municipality Airbnb Minimum Stay Requirements Analysis
Distribution of Listings by Minimum Night Requirement
1 Night
55 listings
24.7% of total
2 Nights
17 listings
7.6% of total
3 Nights
13 listings
5.8% of total
4-6 Nights
24 listings
10.8% of total
7-29 Nights
6 listings
2.7% of total
30+ Nights
108 listings
48.4% of total
Key Insights
- The most prevalent minimum stay requirement in Bornholm Regional Municipality is 30+ Nights, adopted by 48.4% of listings. This highlights the market's preference for longer commitments.
- A significant segment (48.4%) caters to monthly stays (30+ nights) in Bornholm Regional Municipality, pointing to opportunities in the extended-stay market.
Recommendations
- Align with the market by considering a 30+ Nights minimum stay, as 48.4% of Bornholm Regional Municipality hosts use this setting.
- If feasible, allowing 1-night stays, especially midweek or during low season, could capture last-minute bookings, as only 24.7% currently do.
- Explore offering discounts for stays of 30+ nights to attract the 48.4% of the market seeking extended stays.
- Adjust minimum nights based on seasonality – potentially shorter during low season and longer during peak demand periods in Bornholm Regional Municipality.
Bornholm Regional Municipality Airbnb Cancellation Policy Trends Analysis (2026)
Super Strict 30 Days
12 listings
5.4% of total
Flexible
24 listings
10.8% of total
Moderate
23 listings
10.3% of total
Firm
146 listings
65.5% of total
Strict
18 listings
8.1% of total
Cancellation Policy Insights for Bornholm Regional Municipality
- The prevailing Airbnb cancellation policy trend in Bornholm Regional Municipality is Firm, used by 65.5% of listings.
- A majority (73.6%) of hosts in Bornholm Regional Municipality utilize Firm or Strict policies, indicating a market where hosts prioritize booking security.
- Strict cancellation policies are quite rare (8.1%), potentially making listings with this policy less competitive unless justified by high demand or property type.
Recommendations for Hosts
- Consider adopting a Firm policy to align with the 65.5% market standard in Bornholm Regional Municipality.
- Using a Strict policy might deter some guests, as only 8.1% of listings use it. Evaluate if potential revenue protection outweighs possible lower booking rates.
- Regularly review your cancellation policy against competitors and market demand shifts in Bornholm Regional Municipality.
Bornholm Regional Municipality STR Booking Lead Time Analysis (2026)
Average Booking Lead Time by Month
Booking Lead Time Insights for Bornholm Regional Municipality
- The overall average booking lead time for vacation rentals in Bornholm Regional Municipality is 98 days.
- Guests book furthest in advance for stays during July (average 135 days), likely coinciding with peak travel demand or local events.
- The shortest booking windows occur for stays in February (average 29 days), indicating more last-minute travel plans during this time.
- Seasonally, Summer (124 days avg.) sees the longest lead times, while Winter (49 days avg.) has the shortest, reflecting typical travel planning cycles.
Recommendations for Hosts
- Use the overall average lead time (98 days) as a baseline for your pricing and availability strategy in Bornholm Regional Municipality.
- For July stays, consider implementing length-of-stay discounts or slightly higher rates for bookings made less than 135 days out to capitalize on advance planning.
- Target marketing efforts for the Summer season well in advance (at least 124 days) to capture early planners.
- Monitor your own booking lead times against these Bornholm Regional Municipality averages to identify opportunities for dynamic pricing adjustments.
Popular & Essential Airbnb Amenities in Bornholm Regional Municipality (2026)
Amenity Prevalence
Amenity Insights for Bornholm Regional Municipality
- Essential amenities in Bornholm Regional Municipality that guests expect include: Kitchen. Lacking these (this) could significantly impact bookings.
- Popular amenities like Wifi, Heating, Refrigerator are common but not universal. Offering these can provide a competitive edge.
- Warning: Wifi is not universally provided but is considered essential globally. Ensure reliable Wifi is offered.
Recommendations for Hosts
- Ensure your listing includes all essential amenities for Bornholm Regional Municipality: Kitchen.
- Prioritize adding missing essentials: Kitchen.
- Consider adding popular differentiators like Wifi or Heating to increase appeal.
- Highlight unique or less common amenities you offer (e.g., hot tub, dedicated workspace, EV charger) in your listing description and photos.
- Regularly check competitor amenities in Bornholm Regional Municipality to stay competitive.
Bornholm Regional Municipality Airbnb Guest Demographics & Profile Analysis (2026)
Guest Profile Summary for Bornholm Regional Municipality
- The typical guest profile for Airbnb in Bornholm Regional Municipality consists of a mix of domestic (55%) and international guests, often arriving from nearby Copenhagen, typically belonging to the Post-2000s (Gen Z/Alpha) group (50%), primarily speaking English or Danish.
- Domestic travelers account for 54.5% of guests.
- Key international markets include Denmark (54.5%) and Germany (26.8%).
- Top languages spoken are English (38.1%) followed by Danish (22.3%).
- A significant demographic segment is the Post-2000s (Gen Z/Alpha) group, representing 50% of guests.
Recommendations for Hosts
- Balance marketing efforts between domestic and international channels based on the guest mix.
- Tailor amenities and listing descriptions to appeal to the dominant Post-2000s (Gen Z/Alpha) demographic (e.g., highlight fast WiFi, smart home features, local guides).
- Highlight unique local experiences or amenities relevant to the primary guest profile.
- Consider seasonal promotions aligned with peak travel times for key origin markets.
Nearby Short-Term Rental Market Comparison
How does the Bornholm Regional Municipality Airbnb market stack up against its neighbors? Compare key performance metrics like average monthly revenue, ADR, and occupancy rates in surrounding areas to understand the broader regional STR landscape.
| Market | Active Properties | Monthly Revenue | Daily Rate | Avg. Occupancy |
|---|---|---|---|---|
| Tejn | 60 | $2,181 | $275.98 | 43% |
| Östra Göinge kommun | 10 | $2,138 | $216.64 | 45% |
| Perstorps kommun | 13 | $2,081 | $161.55 | 48% |
| Örkelljunga | 17 | $1,963 | $305.70 | 28% |
| Vellinge | 18 | $1,754 | $176.42 | 44% |
| Årsdale | 37 | $1,750 | $220.09 | 41% |
| Allinge-Sandvig | 88 | $1,711 | $235.69 | 39% |
| Klausdorf | 19 | $1,672 | $146.23 | 44% |
| Listed | 11 | $1,637 | $169.96 | 48% |
| Vittsjö | 20 | $1,636 | $188.66 | 40% |