Dragør Airbnb Market Analysis 2026: Short Term Rental Data & Vacation Rental Statistics in Capital Region of Denmark, Denmark
Is Airbnb profitable in Dragør in 2026? Explore comprehensive Airbnb analytics for Dragør, Capital Region of Denmark, Denmark to uncover income potential. This 2026 STR market report for Dragør, based on AirROI data from February 2025 to January 2026, reveals key trends in the niche market of 38 active listings.
Whether you're considering an Airbnb investment in Dragør, optimizing your existing vacation rental, or exploring rental arbitrage opportunities, understanding the Dragør Airbnb data is crucial. Leveraging the low regulation environment is key to maximizing your short term rental income potential. Let's dive into the specifics.
Key Dragør Airbnb Performance Metrics Overview
Monthly Airbnb Revenue Variations & Income Potential in Dragør (2026)
Understanding the monthly revenue variations for Airbnb listings in Dragør is key to maximizing your short term rental income potential. Seasonality significantly impacts earnings. Our analysis, based on data from the past 12 months, shows that the peak revenue month for STRs in Dragør is typically August, while February often presents the lowest earnings, highlighting opportunities for strategic pricing adjustments during shoulder and low seasons. Explore the typical Airbnb income in Dragør across different performance tiers:
- Best-in-class properties (Top 10%) achieve $5,910+ monthly, often utilizing dynamic pricing and superior guest experiences.
- Strong performing properties (Top 25%) earn $3,873 or more, indicating effective management and desirable locations/amenities.
- Typical properties (Median) generate around $2,326 per month, representing the average market performance.
- Entry-level properties (Bottom 25%) see earnings around $1,353, often with potential for optimization.
Average Monthly Airbnb Earnings Trend in Dragør
Dragør Airbnb Occupancy Rate Trends (2026)
Maximize your bookings by understanding the Dragør STR occupancy trends. Seasonal demand shifts significantly influence how often properties are booked. Typically, Augustsees the highest demand (peak season occupancy), while February experiences the lowest (low season). Effective strategies, like adjusting minimum stays or offering promotions, can boost occupancy during slower periods. Here's how different property tiers perform in Dragør:
- Best-in-class properties (Top 10%) achieve 77%+ occupancy, indicating high desirability and potentially optimized availability.
- Strong performing properties (Top 25%) maintain 58% or higher occupancy, suggesting good market fit and guest satisfaction.
- Typical properties (Median) have an occupancy rate around 43%.
- Entry-level properties (Bottom 25%) average 25% occupancy, potentially facing higher vacancy.
Average Monthly Occupancy Rate Trend in Dragør
Average Daily Rate (ADR) Airbnb Trends in Dragør (2026)
Effective short term rental pricing strategy in Dragør involves understanding monthly ADR fluctuations. The Average Daily Rate (ADR) for Airbnb in Dragør typically peaks in September and dips lowest during April. Leveraging Airbnb dynamic pricing tools or strategies based on this seasonality can significantly boost revenue. Here's a look at the typical nightly rates achieved:
- Best-in-class properties (Top 10%) command rates of $327+ per night, often due to premium features or locations.
- Strong performing properties (Top 25%) achieve nightly rates of $255 or more.
- Typical properties (Median) charge around $193 per night.
- Entry-level properties (Bottom 25%) earn around $145 per night.
Average Daily Rate (ADR) Trend by Month in Dragør
Get Live Dragør Market Intelligence 👇

Explore Real-time Analytics
Airbnb Seasonality Analysis & Trends in Dragør (2026)
Peak Season (August, July, June)
- Revenue averages $4,266 per month
- Occupancy rates average 63.8%
- Daily rates average $209
Shoulder Season
- Revenue averages $2,635 per month
- Occupancy maintains around 39.4%
- Daily rates hold near $218
Low Season (January, February, November)
- Revenue drops to average $1,698 per month
- Occupancy decreases to average 30.0%
- Daily rates adjust to average $221
Seasonality Insights for Dragør
- The Airbnb seasonality in Dragør shows highly seasonal trends requiring careful strategy. While the sections above show seasonal averages, it's also insightful to look at the extremes:
- During the high season, the absolute peak month showcases Dragør's highest earning potential, with monthly revenues capable of climbing to $4,831, occupancy reaching a high of 73.2%, and ADRs peaking at $236.
- Conversely, the slowest single month of the year, typically falling within the low season, marks the market's lowest point. In this month, revenue might dip to $1,183, occupancy could drop to 21.4%, and ADRs may adjust down to $203.
- Understanding both the seasonal averages and these monthly peaks and troughs in revenue, occupancy, and ADR is crucial for maximizing your Airbnb profit potential in Dragør.
Seasonal Strategies for Maximizing Profit
- Peak Season: Maximize revenue through premium pricing and potentially longer minimum stays. Ensure high availability.
- Low Season: Offer competitive pricing, special promotions (e.g., extended stay discounts), and flexible cancellation policies. Target off-season travelers like remote workers or budget-conscious guests.
- Shoulder Seasons: Implement dynamic pricing that balances peak and low rates. Target weekend travelers or specific events. Offer slightly more flexible terms than peak season.
- Regularly analyze your own performance against these Dragør seasonality benchmarks and adjust your pricing and availability strategy accordingly.
Best Areas for Airbnb Investment in Dragør (2026)
Exploring the top neighborhoods for short-term rentals in Dragør? This section highlights key areas, outlining why they are attractive for hosts and guests, along with notable local attractions. Consider these locations based on your target guest profile and investment strategy.
| Neighborhood / Area | Why Host Here? (Target Guests & Appeal) | Key Attractions & Landmarks |
|---|---|---|
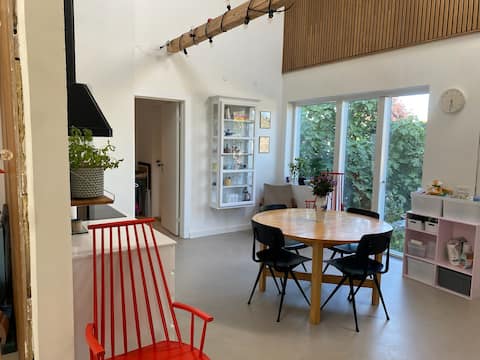
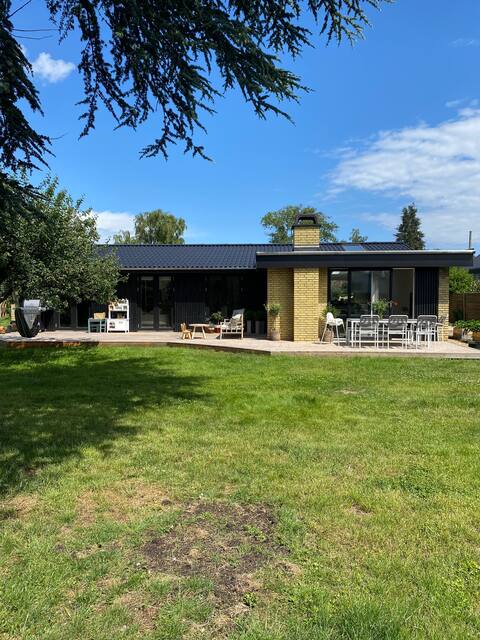
| Dragør Old Town | Charming historical old town with picturesque streets and well-preserved buildings. Attracts visitors interested in history and culture as well as proximity to nature and the coast. | Dragør Museum, Dragør Harbour, Amager Beach, Copenhagen Opera House, The Blue Planet |
| Dragør Beach | Popular beach area known for its family-friendly atmosphere and beautiful scenery. Ideal for visitors looking for relaxation and outdoor activities by the sea. | Dragør Strand, Beach volleyball courts, Playgrounds, Picnic areas, Walking paths |
| Amager Strandpark | Spacious coastal park with walking, cycling, and recreational facilities. Perfect for travelers seeking outdoor activities and a vibrant beach culture. | Amager Strand Beach, Kayaking, Sunbathing areas, Restaurants and cafes, Piers and promenades |
| Copenhagen Boat Tours | Area known for boat tours around the picturesque waterways. Ideal for tourists who love exploring by water and enjoying scenic views of Copenhagen. | Canal Tours, Copenhagen Opera House, Little Mermaid statue, Nyhavn, Holmen's Church |
| Dragør Harbour | A bustling harbor area with stunning views, restaurants, and local shops. Perfect for tourists wanting to experience local culture and seafood. | Harbour Market, Local fish restaurants, Boat rentals, Fishing spots, Scenic viewpoints |
| The Blue Planet | North Europe's largest aquarium, attracting families and marine enthusiasts. A unique attraction, enhancing the appeal for educational tourism. | Aquarium exhibits, Tropical rainforest, Coral reefs, Interactive displays, Underwater tunnel |
| Amager Bakke | Innovative waste-to-energy plant with an urban ski slope and hiking trails. A unique attraction blending sustainability with recreation. | Ski slope, Hiking paths, Café with a view, Green rooftop area, Sustainability exhibits |
| Copenhagen City Center (near Dragør) | Vibrant area of Copenhagen full of sights, shopping, and entertainment. It provides easy access to various city attractions and cultural sites for Dragør guests. | Tivoli Gardens, Strøget shopping street, The Round Tower, Christiansborg Palace, National Museum of Denmark |
Understanding Airbnb License Requirements & STR Laws in Dragør (2026)
While Dragør, Capital Region of Denmark, Denmark currently shows low STR regulations, specific Airbnb license requirements might still exist or change. Always verify the latest short term rental regulations and Airbnb license requirements directly with local government authorities for Dragør to ensure full compliance before hosting.
(Source: AirROI data, 2026, finding no licensed listings among those analyzed)
Top Performing Airbnb Properties in Dragør (2026)
Benchmark your potential! Explore examples of top-performing Airbnb properties in Dragørbased on Trailing Twelve Month (TTM) revenue. Analyze their characteristics, revenue, occupancy rate, and ADR to understand what drives success in this market.
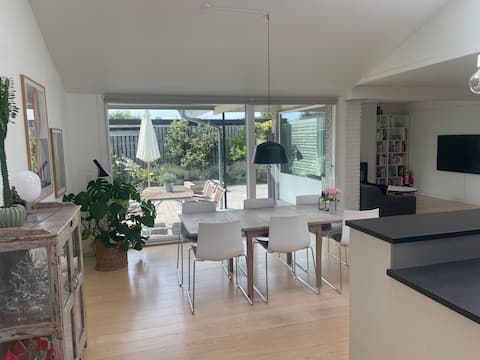
Beautiful villa close to Øresund, shopping and transport
Entire Place • 3 bedrooms
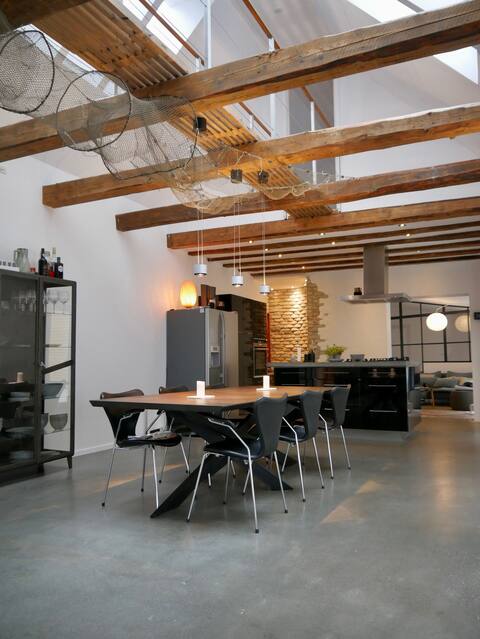
Artists residence in Dragør
Entire Place • 3 bedrooms
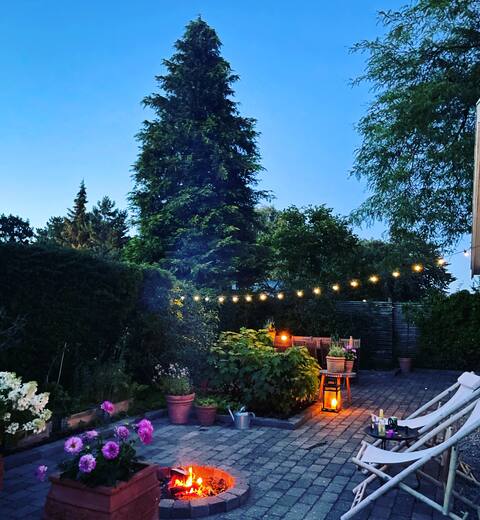
Hyggeligt bolig tæt på vandet
Entire Place • 4 bedrooms
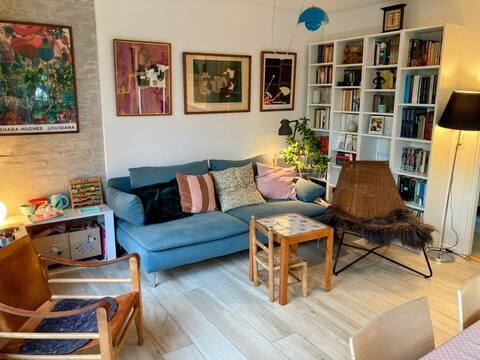
Nice 1-family house close to CPH.
Entire Place • 4 bedrooms
Nice house with a sunny garden. Free parking.
Entire Place • 1 bedroom
Cozy detached house with room for children
Entire Place • 2 bedrooms
Note: Performance varies based on location, size, amenities, seasonality, and management quality. Data reflects the past 12 months.
Top Performing Airbnb Hosts in Dragør (2026)
Learn from the best! This table showcases top-performing Airbnb hosts in Dragør based on the number of properties managed and estimated total revenue over the past year. Analyze their scale and performance metrics.
| Host Name | Properties | Grossing Revenue | Stay Reviews | Avg Rating |
|---|---|---|---|---|
| Dortea | 1 | $51,853 | 7 | 5.00/5.0 |
| Jonas | 1 | $47,074 | 16 | 4.75/5.0 |
| Henriette | 1 | $46,700 | 4 | 5.00/5.0 |
| Peter | 1 | $38,698 | 13 | 5.00/5.0 |
| Rebecca | 1 | $37,662 | 52 | 4.77/5.0 |
| Irse Og Jørn | 2 | $37,564 | 254 | 4.73/5.0 |
| Nadia | 1 | $27,946 | 24 | 4.46/5.0 |
| Sebastian | 1 | $27,309 | 11 | 4.91/5.0 |
| Lars | 1 | $26,621 | 47 | 4.91/5.0 |
| Mikael | 1 | $24,619 | 49 | 4.69/5.0 |
Analyzing the strategies of top hosts, such as their property selection, pricing, and guest communication, can offer valuable lessons for optimizing your own Airbnb operations in Dragør.
Dive Deeper: Advanced Dragør STR Market Data (2026)
Ready to unlock more insights? AirROI provides access to advanced metrics and comprehensive Airbnb data for Dragør. Explore detailed analytics beyond this report to refine your investment strategy, optimize pricing, and maximize your vacation rental profits.
Explore Advanced MetricsDragør Short-Term Rental Market Composition (2026): Property & Room Types
Room Type Distribution
Property Type Distribution
Market Composition Insights for Dragør
- The Dragør Airbnb market composition is heavily skewed towards Entire Home/Apt listings, which make up 94.7% of the 38 active rentals. This indicates strong guest preference for privacy and space.
- Looking at the property type distribution in Dragør, House properties are the most common (81.6%), reflecting the local real estate landscape.
- Houses represent a significant 81.6% portion, catering likely to families or larger groups.
- The presence of 7.9% Hotel/Boutique listings indicates integration with traditional hospitality.
Dragør Airbnb Room Capacity Analysis (2026): Bedroom Distribution
Distribution of Listings by Number of Bedrooms
Room Capacity Insights for Dragør
- The dominant room capacity in Dragør is 3 bedrooms listings, making up 28.9% of the market. This suggests a strong demand for properties suitable for families or small groups.
- Together, 3 bedrooms and 2 bedrooms properties represent 50.0% of the active Airbnb listings in Dragør, indicating a high concentration in these sizes.
- A significant 52.6% of listings offer 3+ bedrooms, catering to larger groups and families seeking more space in Dragør.
Dragør Vacation Rental Guest Capacity Trends (2026)
Distribution of Listings by Guest Capacity
Guest Capacity Insights for Dragør
- The most common guest capacity trend in Dragør vacation rentals is listings accommodating 4 guests (31.6%). This suggests the primary traveler segment is likely small families or groups.
- Properties designed for 4 guests and 6 guests dominate the Dragør STR market, accounting for 50.0% of listings.
- 39.5% of properties accommodate 6+ guests, serving the market segment for larger families or group travel in Dragør.
- On average, properties in Dragør are equipped to host 4.8 guests.
Dragør Airbnb Booking Patterns (2026): Available vs. Booked Days
Available Days Distribution
Booked Days Distribution
Booking Pattern Insights for Dragør
- The most common availability pattern in Dragør falls within the 271-366 days range, representing 60.5% of listings. This suggests many properties have significant open periods on their calendars.
- Approximately 92.1% of listings show high availability (181+ days open annually), indicating potential for increased bookings or specific owner usage patterns.
- For booked days, the 31-90 days range is most frequent in Dragør (42.1%), reflecting common guest stay durations or potential owner blocking patterns.
- A notable 10.5% of properties secure long booking periods (181+ days booked per year), highlighting successful long-term rental strategies or significant owner usage.
Dragør Airbnb Minimum Stay Requirements Analysis
Distribution of Listings by Minimum Night Requirement
1 Night
6 listings
15.8% of total
2 Nights
2 listings
5.3% of total
3 Nights
7 listings
18.4% of total
4-6 Nights
11 listings
28.9% of total
7-29 Nights
1 listings
2.6% of total
30+ Nights
11 listings
28.9% of total
Key Insights
- The most prevalent minimum stay requirement in Dragør is 4-6 Nights, adopted by 28.9% of listings. This highlights the market's preference for longer commitments.
- A significant segment (28.9%) caters to monthly stays (30+ nights) in Dragør, pointing to opportunities in the extended-stay market.
Recommendations
- Align with the market by considering a 4-6 Nights minimum stay, as 28.9% of Dragør hosts use this setting.
- If feasible, allowing 1-night stays, especially midweek or during low season, could capture last-minute bookings, as only 15.8% currently do.
- Explore offering discounts for stays of 30+ nights to attract the 28.9% of the market seeking extended stays.
- Adjust minimum nights based on seasonality – potentially shorter during low season and longer during peak demand periods in Dragør.
Dragør Airbnb Cancellation Policy Trends Analysis (2026)
Flexible
8 listings
21.1% of total
Moderate
11 listings
28.9% of total
Firm
15 listings
39.5% of total
Strict
4 listings
10.5% of total
Cancellation Policy Insights for Dragør
- The prevailing Airbnb cancellation policy trend in Dragør is Firm, used by 39.5% of listings.
- There's a relatively balanced mix between guest-friendly (50.0%) and stricter (50.0%) policies, offering choices for different guest needs.
Recommendations for Hosts
- Consider adopting a Firm policy to align with the 39.5% market standard in Dragør.
- Using a Strict policy might deter some guests, as only 10.5% of listings use it. Evaluate if potential revenue protection outweighs possible lower booking rates.
- Regularly review your cancellation policy against competitors and market demand shifts in Dragør.
Dragør STR Booking Lead Time Analysis (2026)
Average Booking Lead Time by Month
Booking Lead Time Insights for Dragør
- The overall average booking lead time for vacation rentals in Dragør is 53 days.
- Guests book furthest in advance for stays during August (average 89 days), likely coinciding with peak travel demand or local events.
- The shortest booking windows occur for stays in December (average 27 days), indicating more last-minute travel plans during this time.
- Seasonally, Summer (71 days avg.) sees the longest lead times, while Winter (32 days avg.) has the shortest, reflecting typical travel planning cycles.
Recommendations for Hosts
- Use the overall average lead time (53 days) as a baseline for your pricing and availability strategy in Dragør.
- For August stays, consider implementing length-of-stay discounts or slightly higher rates for bookings made less than 89 days out to capitalize on advance planning.
- Target marketing efforts for the Summer season well in advance (at least 71 days) to capture early planners.
- Monitor your own booking lead times against these Dragør averages to identify opportunities for dynamic pricing adjustments.
Popular & Essential Airbnb Amenities in Dragør (2026)
Amenity Prevalence
Amenity Insights for Dragør
- Essential amenities in Dragør that guests expect include: Wifi. Lacking these (this) could significantly impact bookings.
- Popular amenities like Kitchen, TV, Outdoor dining area are common but not universal. Offering these can provide a competitive edge.
Recommendations for Hosts
- Ensure your listing includes all essential amenities for Dragør: Wifi.
- Prioritize adding missing essentials: Wifi.
- Consider adding popular differentiators like Kitchen or TV to increase appeal.
- Highlight unique or less common amenities you offer (e.g., hot tub, dedicated workspace, EV charger) in your listing description and photos.
- Regularly check competitor amenities in Dragør to stay competitive.
Dragør Airbnb Guest Demographics & Profile Analysis (2026)
Guest Profile Summary for Dragør
- The typical guest profile for Airbnb in Dragør consists of predominantly international visitors (90%), with top international origins including United States, typically belonging to the Post-2000s (Gen Z/Alpha) group (50%), primarily speaking English or French.
- Domestic travelers account for 10.0% of guests.
- Key international markets include Germany (14.4%) and United States (12.2%).
- Top languages spoken are English (35.4%) followed by French (15.9%).
- A significant demographic segment is the Post-2000s (Gen Z/Alpha) group, representing 50% of guests.
Recommendations for Hosts
- Focus marketing internationally, particularly towards travelers from United States.
- Tailor amenities and listing descriptions to appeal to the dominant Post-2000s (Gen Z/Alpha) demographic (e.g., highlight fast WiFi, smart home features, local guides).
- Highlight unique local experiences or amenities relevant to the primary guest profile.
- Consider seasonal promotions aligned with peak travel times for key origin markets.
Nearby Short-Term Rental Market Comparison
How does the Dragør Airbnb market stack up against its neighbors? Compare key performance metrics like average monthly revenue, ADR, and occupancy rates in surrounding areas to understand the broader regional STR landscape.
| Market | Active Properties | Monthly Revenue | Daily Rate | Avg. Occupancy |
|---|---|---|---|---|
| Wittenbeck | 14 | $2,937 | $224.34 | 43% |
| Copenhagen | 9,111 | $2,347 | $222.94 | 52% |
| Råbylille Strand | 31 | $2,254 | $190.70 | 45% |
| Saunte | 10 | $2,212 | $213.23 | 46% |
| Perstorps kommun | 13 | $2,081 | $161.55 | 48% |
| Frederiksberg | 1,015 | $2,062 | $217.28 | 50% |
| Solrød Strand | 54 | $2,032 | $249.51 | 48% |
| Hellerup | 11 | $1,973 | $298.07 | 51% |
| Örkelljunga | 17 | $1,963 | $305.70 | 28% |
| Laröd | 12 | $1,923 | $329.50 | 38% |