Fredensborg Airbnb Market Analysis 2026: Short Term Rental Data & Vacation Rental Statistics in Capital Region of Denmark, Denmark
Is Airbnb profitable in Fredensborg in 2026? Explore comprehensive Airbnb analytics for Fredensborg, Capital Region of Denmark, Denmark to uncover income potential. This 2026 STR market report for Fredensborg, based on AirROI data from February 2025 to January 2026, reveals key trends in the niche market of 21 active listings.
Whether you're considering an Airbnb investment in Fredensborg, optimizing your existing vacation rental, or exploring rental arbitrage opportunities, understanding the Fredensborg Airbnb data is crucial. Leveraging the low regulation environment is key to maximizing your short term rental income potential. Let's dive into the specifics.
Key Fredensborg Airbnb Performance Metrics Overview
Monthly Airbnb Revenue Variations & Income Potential in Fredensborg (2026)
Understanding the monthly revenue variations for Airbnb listings in Fredensborg is key to maximizing your short term rental income potential. Seasonality significantly impacts earnings. Our analysis, based on data from the past 12 months, shows that the peak revenue month for STRs in Fredensborg is typically August, while January often presents the lowest earnings, highlighting opportunities for strategic pricing adjustments during shoulder and low seasons. Explore the typical Airbnb income in Fredensborg across different performance tiers:
- Best-in-class properties (Top 10%) achieve $5,830+ monthly, often utilizing dynamic pricing and superior guest experiences.
- Strong performing properties (Top 25%) earn $2,858 or more, indicating effective management and desirable locations/amenities.
- Typical properties (Median) generate around $1,565 per month, representing the average market performance.
- Entry-level properties (Bottom 25%) see earnings around $628, often with potential for optimization.
Average Monthly Airbnb Earnings Trend in Fredensborg
Fredensborg Airbnb Occupancy Rate Trends (2026)
Maximize your bookings by understanding the Fredensborg STR occupancy trends. Seasonal demand shifts significantly influence how often properties are booked. Typically, Augustsees the highest demand (peak season occupancy), while October experiences the lowest (low season). Effective strategies, like adjusting minimum stays or offering promotions, can boost occupancy during slower periods. Here's how different property tiers perform in Fredensborg:
- Best-in-class properties (Top 10%) achieve 74%+ occupancy, indicating high desirability and potentially optimized availability.
- Strong performing properties (Top 25%) maintain 52% or higher occupancy, suggesting good market fit and guest satisfaction.
- Typical properties (Median) have an occupancy rate around 29%.
- Entry-level properties (Bottom 25%) average 14% occupancy, potentially facing higher vacancy.
Average Monthly Occupancy Rate Trend in Fredensborg
Average Daily Rate (ADR) Airbnb Trends in Fredensborg (2026)
Effective short term rental pricing strategy in Fredensborg involves understanding monthly ADR fluctuations. The Average Daily Rate (ADR) for Airbnb in Fredensborg typically peaks in December and dips lowest during April. Leveraging Airbnb dynamic pricing tools or strategies based on this seasonality can significantly boost revenue. Here's a look at the typical nightly rates achieved:
- Best-in-class properties (Top 10%) command rates of $260+ per night, often due to premium features or locations.
- Strong performing properties (Top 25%) achieve nightly rates of $199 or more.
- Typical properties (Median) charge around $173 per night.
- Entry-level properties (Bottom 25%) earn around $128 per night.
Average Daily Rate (ADR) Trend by Month in Fredensborg
Get Live Fredensborg Market Intelligence 👇

Explore Real-time Analytics
Airbnb Seasonality Analysis & Trends in Fredensborg (2026)
Peak Season (August, July, September)
- Revenue averages $3,236 per month
- Occupancy rates average 52.8%
- Daily rates average $181
Shoulder Season
- Revenue averages $2,089 per month
- Occupancy maintains around 34.0%
- Daily rates hold near $178
Low Season (January, February, October)
- Revenue drops to average $1,490 per month
- Occupancy decreases to average 19.6%
- Daily rates adjust to average $188
Seasonality Insights for Fredensborg
- The Airbnb seasonality in Fredensborg shows highly seasonal trends requiring careful strategy. While the sections above show seasonal averages, it's also insightful to look at the extremes:
- During the high season, the absolute peak month showcases Fredensborg's highest earning potential, with monthly revenues capable of climbing to $3,850, occupancy reaching a high of 60.4%, and ADRs peaking at $202.
- Conversely, the slowest single month of the year, typically falling within the low season, marks the market's lowest point. In this month, revenue might dip to $1,389, occupancy could drop to 14.2%, and ADRs may adjust down to $165.
- Understanding both the seasonal averages and these monthly peaks and troughs in revenue, occupancy, and ADR is crucial for maximizing your Airbnb profit potential in Fredensborg.
Seasonal Strategies for Maximizing Profit
- Peak Season: Maximize revenue through premium pricing and potentially longer minimum stays. Ensure high availability.
- Low Season: Offer competitive pricing, special promotions (e.g., extended stay discounts), and flexible cancellation policies. Target off-season travelers like remote workers or budget-conscious guests.
- Shoulder Seasons: Implement dynamic pricing that balances peak and low rates. Target weekend travelers or specific events. Offer slightly more flexible terms than peak season.
- Regularly analyze your own performance against these Fredensborg seasonality benchmarks and adjust your pricing and availability strategy accordingly.
Best Areas for Airbnb Investment in Fredensborg (2026)
Exploring the top neighborhoods for short-term rentals in Fredensborg? This section highlights key areas, outlining why they are attractive for hosts and guests, along with notable local attractions. Consider these locations based on your target guest profile and investment strategy.
| Neighborhood / Area | Why Host Here? (Target Guests & Appeal) | Key Attractions & Landmarks |
|---|---|---|
| Fredensborg Castle | Historic royal palace surrounded by beautiful gardens, attracting tourists interested in history and culture. Ideal for visitors seeking a peaceful and scenic stay close to nature and heritage sites. | Fredensborg Palace, Fredensborg Palace Gardens, Lake Esrum, Skipper's Town |
| Esrum Lake | A picturesque lake area perfect for nature lovers and outdoor enthusiasts. Offers opportunities for hiking, biking, and water activities. | Esrum Lake, Hiking trails, Biking paths, Fishing, Kayaking |
| Nivå Bay | Coastal area with lovely beaches and a family-friendly atmosphere, popular for those looking to relax by the water and enjoy outdoor activities. | Nivå Beach, Beachfront restaurants, Water sports, Coastal walks |
| Lille Fredensborg | Charming local neighborhood with a community feel. Great for those looking to experience local life and culture, while being close to larger tourist sites. | Local markets, Cafes, Parks, Community events |
| Fredensborg Town Center | The heart of the town, equipped with shops, restaurants, and cultural venues. Convenient for guests who want to explore local life. | Shops, Restaurants, Local events, Cultural activities |
| Hunting Lodge in Fredensborg | Unique accommodation option located in a scenic nature reserve; attracts those looking for a quiet retreat away from the hustle and bustle. | Nature walks, Wildlife watching, Photography opportunities |
| Fredensborg's Garden District | A district known for its beautiful and well-maintained gardens. Perfect for visitors who appreciate nature and beautiful landscapes. | Botanical gardens, Nature trails, Garden exhibitions |
| Local Art Scene | Spotlight on Fredensborg's emerging art community, attracting visitors interested in local artworks and cultural events. | Art galleries, Art fairs, Cultural festivals |
Understanding Airbnb License Requirements & STR Laws in Fredensborg (2026)
While Fredensborg, Capital Region of Denmark, Denmark currently shows low STR regulations, specific Airbnb license requirements might still exist or change. Always verify the latest short term rental regulations and Airbnb license requirements directly with local government authorities for Fredensborg to ensure full compliance before hosting.
(Source: AirROI data, 2026, finding no licensed listings among those analyzed)
Top Performing Airbnb Properties in Fredensborg (2026)
Benchmark your potential! Explore examples of top-performing Airbnb properties in Fredensborgbased on Trailing Twelve Month (TTM) revenue. Analyze their characteristics, revenue, occupancy rate, and ADR to understand what drives success in this market.
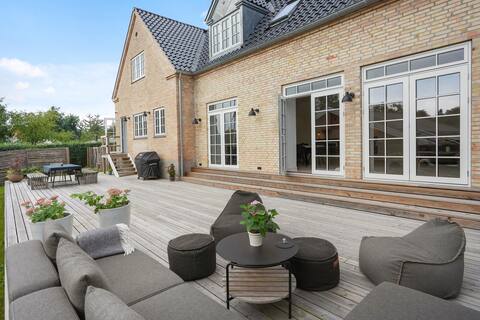
Cozy House in Fredensborg
Entire Place • 2 bedrooms
Villa in North Zealand – perfect for guests/expats
Entire Place • 2 bedrooms
Cozy country house 200m2 in near of Hillerød
Entire Place • 3 bedrooms

Cosy but modern guesthouse
Entire Place • 1 bedroom
Cozy wooden house with private entrance and small garden
Entire Place • 1 bedroom
Nice big house.
Entire Place • 3 bedrooms
Note: Performance varies based on location, size, amenities, seasonality, and management quality. Data reflects the past 12 months.
Top Performing Airbnb Hosts in Fredensborg (2026)
Learn from the best! This table showcases top-performing Airbnb hosts in Fredensborg based on the number of properties managed and estimated total revenue over the past year. Analyze their scale and performance metrics.
| Host Name | Properties | Grossing Revenue | Stay Reviews | Avg Rating |
|---|---|---|---|---|
| Mia | 1 | $39,325 | 26 | 5.00/5.0 |
| Thomas | 1 | $33,282 | 1 | Not Rated |
| Langkilde | 1 | $24,441 | 12 | 4.67/5.0 |
| Rikke | 1 | $20,706 | 48 | 4.92/5.0 |
| Jens | 1 | $18,787 | 107 | 4.73/5.0 |
| Dennis | 1 | $18,637 | 4 | 5.00/5.0 |
| Sophie | 1 | $17,096 | 9 | 5.00/5.0 |
| Henrik | 1 | $15,555 | 5 | 5.00/5.0 |
| Vincent | 1 | $14,807 | 1 | Not Rated |
| Therese | 1 | $13,045 | 4 | 5.00/5.0 |
Analyzing the strategies of top hosts, such as their property selection, pricing, and guest communication, can offer valuable lessons for optimizing your own Airbnb operations in Fredensborg.
Dive Deeper: Advanced Fredensborg STR Market Data (2026)
Ready to unlock more insights? AirROI provides access to advanced metrics and comprehensive Airbnb data for Fredensborg. Explore detailed analytics beyond this report to refine your investment strategy, optimize pricing, and maximize your vacation rental profits.
Explore Advanced MetricsFredensborg Short-Term Rental Market Composition (2026): Property & Room Types
Room Type Distribution
Property Type Distribution
Market Composition Insights for Fredensborg
- The Fredensborg Airbnb market composition is heavily skewed towards Entire Home/Apt listings, which make up 95.2% of the 21 active rentals. This indicates strong guest preference for privacy and space.
- Looking at the property type distribution in Fredensborg, House properties are the most common (71.4%), reflecting the local real estate landscape.
- Houses represent a significant 71.4% portion, catering likely to families or larger groups.
- The presence of 23.8% Hotel/Boutique listings indicates integration with traditional hospitality.
- Smaller segments like apartment/condo (combined 4.8%) offer potential for unique stay experiences.
Fredensborg Airbnb Room Capacity Analysis (2026): Bedroom Distribution
Distribution of Listings by Number of Bedrooms
Room Capacity Insights for Fredensborg
- The dominant room capacity in Fredensborg is 3 bedrooms listings, making up 42.9% of the market. This suggests a strong demand for properties suitable for families or small groups.
- Together, 3 bedrooms and 1 bedroom properties represent 66.7% of the active Airbnb listings in Fredensborg, indicating a high concentration in these sizes.
- A significant 52.4% of listings offer 3+ bedrooms, catering to larger groups and families seeking more space in Fredensborg.
Fredensborg Vacation Rental Guest Capacity Trends (2026)
Distribution of Listings by Guest Capacity
Guest Capacity Insights for Fredensborg
- The most common guest capacity trend in Fredensborg vacation rentals is listings accommodating 6 guests (38.1%). This suggests the primary traveler segment is likely larger groups.
- Properties designed for 6 guests and 5 guests dominate the Fredensborg STR market, accounting for 57.1% of listings.
- 47.7% of properties accommodate 6+ guests, serving the market segment for larger families or group travel in Fredensborg.
- On average, properties in Fredensborg are equipped to host 4.9 guests.
Fredensborg Airbnb Booking Patterns (2026): Available vs. Booked Days
Available Days Distribution
Booked Days Distribution
Booking Pattern Insights for Fredensborg
- The most common availability pattern in Fredensborg falls within the 271-366 days range, representing 76.2% of listings. This suggests many properties have significant open periods on their calendars.
- Approximately 90.5% of listings show high availability (181+ days open annually), indicating potential for increased bookings or specific owner usage patterns.
- For booked days, the 31-90 days range is most frequent in Fredensborg (57.1%), reflecting common guest stay durations or potential owner blocking patterns.
- A notable 14.3% of properties secure long booking periods (181+ days booked per year), highlighting successful long-term rental strategies or significant owner usage.
Fredensborg Airbnb Minimum Stay Requirements Analysis
Distribution of Listings by Minimum Night Requirement
1 Night
2 listings
9.5% of total
2 Nights
2 listings
9.5% of total
3 Nights
1 listings
4.8% of total
4-6 Nights
7 listings
33.3% of total
7-29 Nights
3 listings
14.3% of total
30+ Nights
6 listings
28.6% of total
Key Insights
- The most prevalent minimum stay requirement in Fredensborg is 4-6 Nights, adopted by 33.3% of listings. This highlights the market's preference for longer commitments.
- Very short stays (1-2 nights) are less common (19.0%), suggesting hosts prefer slightly longer bookings to optimize turnover.
- A significant segment (28.6%) caters to monthly stays (30+ nights) in Fredensborg, pointing to opportunities in the extended-stay market.
Recommendations
- Align with the market by considering a 4-6 Nights minimum stay, as 33.3% of Fredensborg hosts use this setting.
- If feasible, allowing 1-night stays, especially midweek or during low season, could capture last-minute bookings, as only 9.5% currently do.
- Explore offering discounts for stays of 30+ nights to attract the 28.6% of the market seeking extended stays.
- Adjust minimum nights based on seasonality – potentially shorter during low season and longer during peak demand periods in Fredensborg.
Fredensborg Airbnb Cancellation Policy Trends Analysis (2026)
Flexible
5 listings
23.8% of total
Moderate
11 listings
52.4% of total
Firm
3 listings
14.3% of total
Strict
2 listings
9.5% of total
Cancellation Policy Insights for Fredensborg
- The prevailing Airbnb cancellation policy trend in Fredensborg is Moderate, used by 52.4% of listings.
- The market strongly favors guest-friendly terms, with 76.2% of listings offering Flexible or Moderate policies. This suggests guests in Fredensborg may expect booking flexibility.
- Strict cancellation policies are quite rare (9.5%), potentially making listings with this policy less competitive unless justified by high demand or property type.
Recommendations for Hosts
- Consider adopting a Moderate policy to align with the 52.4% market standard in Fredensborg.
- Using a Strict policy might deter some guests, as only 9.5% of listings use it. Evaluate if potential revenue protection outweighs possible lower booking rates.
- Regularly review your cancellation policy against competitors and market demand shifts in Fredensborg.
Fredensborg STR Booking Lead Time Analysis (2026)
Average Booking Lead Time by Month
Booking Lead Time Insights for Fredensborg
- The overall average booking lead time for vacation rentals in Fredensborg is 54 days.
- Guests book furthest in advance for stays during May (average 85 days), likely coinciding with peak travel demand or local events.
- The shortest booking windows occur for stays in April (average 10 days), indicating more last-minute travel plans during this time.
- Seasonally, Fall (68 days avg.) sees the longest lead times, while Winter (32 days avg.) has the shortest, reflecting typical travel planning cycles.
Recommendations for Hosts
- Use the overall average lead time (54 days) as a baseline for your pricing and availability strategy in Fredensborg.
- For May stays, consider implementing length-of-stay discounts or slightly higher rates for bookings made less than 85 days out to capitalize on advance planning.
- During April, focus on last-minute booking availability and promotions, as guests book with very short notice (10 days avg.).
- Target marketing efforts for the Fall season well in advance (at least 68 days) to capture early planners.
- Monitor your own booking lead times against these Fredensborg averages to identify opportunities for dynamic pricing adjustments.
Popular & Essential Airbnb Amenities in Fredensborg (2026)
Amenity Prevalence
Amenity Insights for Fredensborg
- Essential amenities in Fredensborg that guests expect include: Wifi. Lacking these (this) could significantly impact bookings.
- Popular amenities like Kitchen, Heating, Free parking on premises are common but not universal. Offering these can provide a competitive edge.
Recommendations for Hosts
- Ensure your listing includes all essential amenities for Fredensborg: Wifi.
- Prioritize adding missing essentials: Wifi.
- Consider adding popular differentiators like Kitchen or Heating to increase appeal.
- Highlight unique or less common amenities you offer (e.g., hot tub, dedicated workspace, EV charger) in your listing description and photos.
- Regularly check competitor amenities in Fredensborg to stay competitive.
Fredensborg Airbnb Guest Demographics & Profile Analysis (2026)
Guest Profile Summary for Fredensborg
- The typical guest profile for Airbnb in Fredensborg consists of predominantly international visitors (76%), with top international origins including Germany, typically belonging to the Post-2000s (Gen Z/Alpha) group (50%), primarily speaking English or German.
- Domestic travelers account for 24.5% of guests.
- Key international markets include Denmark (24.5%) and Germany (15.1%).
- Top languages spoken are English (42.2%) followed by German (15.6%).
- A significant demographic segment is the Post-2000s (Gen Z/Alpha) group, representing 50% of guests.
Recommendations for Hosts
- Focus marketing internationally, particularly towards travelers from Germany.
- Tailor amenities and listing descriptions to appeal to the dominant Post-2000s (Gen Z/Alpha) demographic (e.g., highlight fast WiFi, smart home features, local guides).
- Highlight unique local experiences or amenities relevant to the primary guest profile.
- Consider seasonal promotions aligned with peak travel times for key origin markets.
Nearby Short-Term Rental Market Comparison
How does the Fredensborg Airbnb market stack up against its neighbors? Compare key performance metrics like average monthly revenue, ADR, and occupancy rates in surrounding areas to understand the broader regional STR landscape.
| Market | Active Properties | Monthly Revenue | Daily Rate | Avg. Occupancy |
|---|---|---|---|---|
| Wittenbeck | 14 | $2,937 | $224.34 | 43% |
| Copenhagen | 9,111 | $2,347 | $222.94 | 52% |
| Råbylille Strand | 31 | $2,254 | $190.70 | 45% |
| Saunte | 10 | $2,212 | $213.23 | 46% |
| Perstorps kommun | 13 | $2,081 | $161.55 | 48% |
| Frederiksberg | 1,015 | $2,062 | $217.28 | 50% |
| Solrød Strand | 54 | $2,032 | $249.51 | 48% |
| Hellerup | 11 | $1,973 | $298.07 | 51% |
| Örkelljunga | 17 | $1,963 | $305.70 | 28% |
| Laröd | 12 | $1,923 | $329.50 | 38% |