Hyllingebjerg Airbnb Market Analysis 2026: Short Term Rental Data & Vacation Rental Statistics in Capital Region of Denmark, Denmark
Is Airbnb profitable in Hyllingebjerg in 2026? Explore comprehensive Airbnb analytics for Hyllingebjerg, Capital Region of Denmark, Denmark to uncover income potential. This 2026 STR market report for Hyllingebjerg, based on AirROI data from October 2024 to September 2025, reveals key trends in the niche market of 17 active listings.
Whether you're considering an Airbnb investment in Hyllingebjerg, optimizing your existing vacation rental, or exploring rental arbitrage opportunities, understanding the Hyllingebjerg Airbnb data is crucial. Leveraging the low regulation environment is key to maximizing your short term rental income potential. Let's dive into the specifics.
Key Hyllingebjerg Airbnb Performance Metrics Overview
Monthly Airbnb Revenue Variations & Income Potential in Hyllingebjerg (2026)
Understanding the monthly revenue variations for Airbnb listings in Hyllingebjerg is key to maximizing your short term rental income potential. Seasonality significantly impacts earnings. Our analysis, based on data from the past 12 months, shows that the peak revenue month for STRs in Hyllingebjerg is typically July, while February often presents the lowest earnings, highlighting opportunities for strategic pricing adjustments during shoulder and low seasons. Explore the typical Airbnb income in Hyllingebjerg across different performance tiers:
- Best-in-class properties (Top 10%) achieve $3,486+ monthly, often utilizing dynamic pricing and superior guest experiences.
- Strong performing properties (Top 25%) earn $2,095 or more, indicating effective management and desirable locations/amenities.
- Typical properties (Median) generate around $1,274 per month, representing the average market performance.
- Entry-level properties (Bottom 25%) see earnings around $802, often with potential for optimization.
Average Monthly Airbnb Earnings Trend in Hyllingebjerg
Hyllingebjerg Airbnb Occupancy Rate Trends (2026)
Maximize your bookings by understanding the Hyllingebjerg STR occupancy trends. Seasonal demand shifts significantly influence how often properties are booked. Typically, Julysees the highest demand (peak season occupancy), while February experiences the lowest (low season). Effective strategies, like adjusting minimum stays or offering promotions, can boost occupancy during slower periods. Here's how different property tiers perform in Hyllingebjerg:
- Best-in-class properties (Top 10%) achieve 53%+ occupancy, indicating high desirability and potentially optimized availability.
- Strong performing properties (Top 25%) maintain 33% or higher occupancy, suggesting good market fit and guest satisfaction.
- Typical properties (Median) have an occupancy rate around 24%.
- Entry-level properties (Bottom 25%) average 14% occupancy, potentially facing higher vacancy.
Average Monthly Occupancy Rate Trend in Hyllingebjerg
Average Daily Rate (ADR) Airbnb Trends in Hyllingebjerg (2026)
Effective short term rental pricing strategy in Hyllingebjerg involves understanding monthly ADR fluctuations. The Average Daily Rate (ADR) for Airbnb in Hyllingebjerg typically peaks in July and dips lowest during March. Leveraging Airbnb dynamic pricing tools or strategies based on this seasonality can significantly boost revenue. Here's a look at the typical nightly rates achieved:
- Best-in-class properties (Top 10%) command rates of $292+ per night, often due to premium features or locations.
- Strong performing properties (Top 25%) achieve nightly rates of $248 or more.
- Typical properties (Median) charge around $167 per night.
- Entry-level properties (Bottom 25%) earn around $144 per night.
Average Daily Rate (ADR) Trend by Month in Hyllingebjerg
Get Live Hyllingebjerg Market Intelligence 👇

Explore Real-time Analytics
Airbnb Seasonality Analysis & Trends in Hyllingebjerg (2025)
Peak Season (July, August, June)
- Revenue averages $3,585 per month
- Occupancy rates average 53.2%
- Daily rates average $222
Shoulder Season
- Revenue averages $1,183 per month
- Occupancy maintains around 19.7%
- Daily rates hold near $190
Low Season (February, March, May)
- Revenue drops to average $525 per month
- Occupancy decreases to average 10.9%
- Daily rates adjust to average $186
Seasonality Insights for Hyllingebjerg
- The Airbnb seasonality in Hyllingebjerg shows highly seasonal trends requiring careful strategy. While the sections above show seasonal averages, it's also insightful to look at the extremes:
- During the high season, the absolute peak month showcases Hyllingebjerg's highest earning potential, with monthly revenues capable of climbing to $5,142, occupancy reaching a high of 74.5%, and ADRs peaking at $230.
- Conversely, the slowest single month of the year, typically falling within the low season, marks the market's lowest point. In this month, revenue might dip to $259, occupancy could drop to 7.9%, and ADRs may adjust down to $179.
- Understanding both the seasonal averages and these monthly peaks and troughs in revenue, occupancy, and ADR is crucial for maximizing your Airbnb profit potential in Hyllingebjerg.
Seasonal Strategies for Maximizing Profit
- Peak Season: Maximize revenue through premium pricing and potentially longer minimum stays. Ensure high availability.
- Low Season: Offer competitive pricing, special promotions (e.g., extended stay discounts), and flexible cancellation policies. Target off-season travelers like remote workers or budget-conscious guests.
- Shoulder Seasons: Implement dynamic pricing that balances peak and low rates. Target weekend travelers or specific events. Offer slightly more flexible terms than peak season.
- Regularly analyze your own performance against these Hyllingebjerg seasonality benchmarks and adjust your pricing and availability strategy accordingly.
Best Areas for Airbnb Investment in Hyllingebjerg (2026)
Exploring the top neighborhoods for short-term rentals in Hyllingebjerg? This section highlights key areas, outlining why they are attractive for hosts and guests, along with notable local attractions. Consider these locations based on your target guest profile and investment strategy.
| Neighborhood / Area | Why Host Here? (Target Guests & Appeal) | Key Attractions & Landmarks |
|---|---|---|
| Helsingør | Historic town known for Kronborg Castle and beautiful coastline. Popular with tourists interested in history and cultural experiences. | Kronborg Castle, Marienlyst Strand, Helsingør Harbor, The Danish Museum of Communication, M/S Museet for Søfart |
| Frederikssund | Charming town famous for the annual Viking Ship Museum and beautiful nature, perfect for families and nature lovers. | Viking Ship Museum, Frederikssund Golf Club, Jægerspris Castle, The Frederikssund Aquatic Centre, Kongsøre Nature Reserve |
| Humlebæk | Home to the Louisiana Museum of Modern Art, attracting art lovers and international tourists looking for cultural experiences along the coast. | Louisiana Museum of Modern Art, Humlebæk Beach, Krogerup Avlsgård, The Munkeruphus Art Museum |
| København K (Copenhagen City Center) | Vibrant city center filled with shops, restaurants, and historical sites, making it a top destination for tourists. | Tivoli Gardens, The Little Mermaid, Nyhavn, Strøget, Amalienborg Palace |
| Ballerup | A suburban area close to Copenhagen with good access to business and public transport. Attracts families and business travelers. | Ballerup Super Arena, Ballerup Shopping Center, The Møllegård Park |
| Båstad | A popular beach town that attracts visitors in the summer with its beaches, restaurants, and cultural events. | Båstad Beach, Skansenbadet, Båstad Tennis Arena, Nordic Wellness Båstad |
| Øresund | Popular beachfront area located near the water and favored by tourists seeking leisure and relaxation. | Amager Strandpark, Kastrup Søbad, CopenHill, The Blue Planet Aquarium |
Understanding Airbnb License Requirements & STR Laws in Hyllingebjerg (2026)
While Hyllingebjerg, Capital Region of Denmark, Denmark currently shows low STR regulations, specific Airbnb license requirements might still exist or change. Always verify the latest short term rental regulations and Airbnb license requirements directly with local government authorities for Hyllingebjerg to ensure full compliance before hosting.
(Source: AirROI data, 2026, finding no licensed listings among those analyzed)
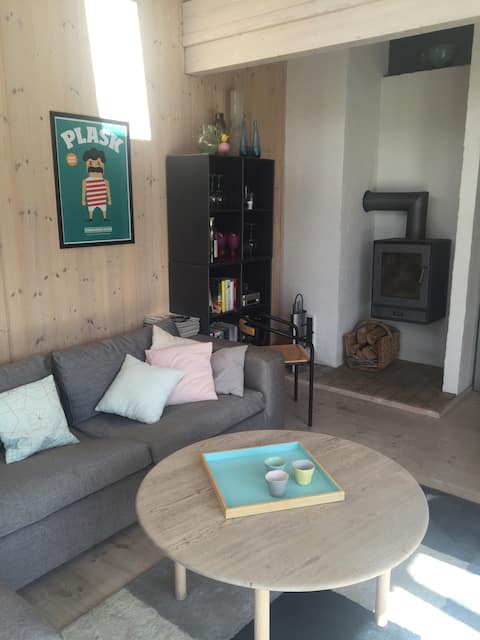
Top Performing Airbnb Properties in Hyllingebjerg (2026)
Benchmark your potential! Explore examples of top-performing Airbnb properties in Hyllingebjergbased on Trailing Twelve Month (TTM) revenue. Analyze their characteristics, revenue, occupancy rate, and ADR to understand what drives success in this market.
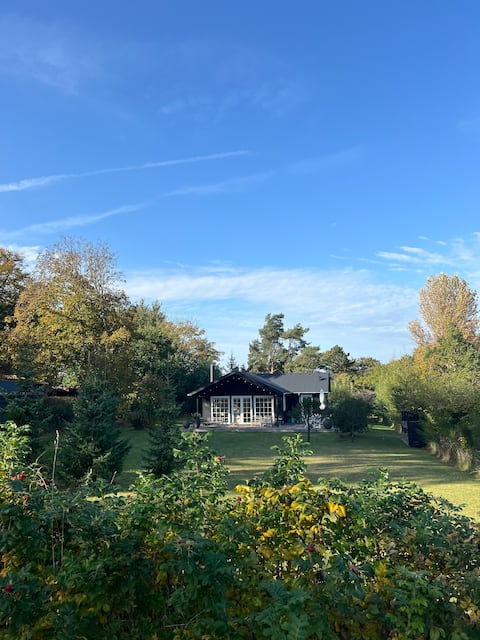
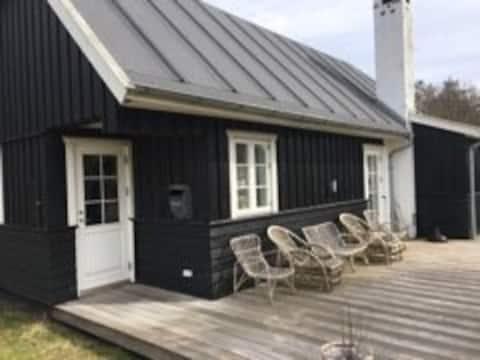
Liseleje - within walking distance of the beach
Entire Place • 3 bedrooms
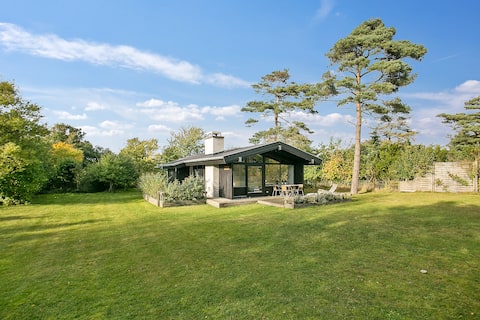
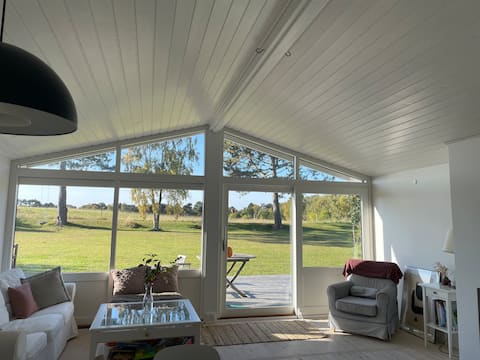
Beautiful cottage in Liseleje 300 meters to the water!
Entire Place • 3 bedrooms
Beautiful large cottage in Liseleje, 400 m to the beach
Entire Place • 6 bedrooms
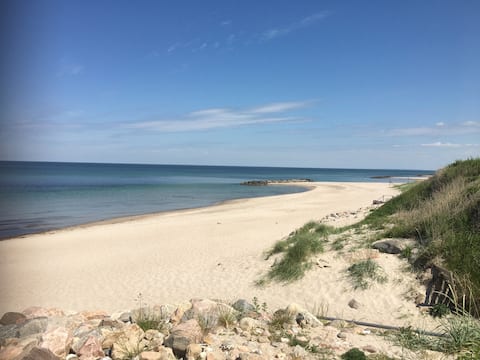
Nice summer house close to sandy beach
Entire Place • 3 bedrooms
Close to the sandy beach
Entire Place • 4 bedrooms
Unobstructed view close to the beach
Entire Place • 2 bedrooms
Note: Performance varies based on location, size, amenities, seasonality, and management quality. Data reflects the past 12 months.
Top Performing Airbnb Hosts in Hyllingebjerg (2026)
Learn from the best! This table showcases top-performing Airbnb hosts in Hyllingebjerg based on the number of properties managed and estimated total revenue over the past year. Analyze their scale and performance metrics.
| Host Name | Properties | Grossing Revenue | Stay Reviews | Avg Rating |
|---|---|---|---|---|
| Poul | 1 | $29,033 | 8 | 4.88/5.0 |
| Stine | 1 | $28,227 | 33 | 4.91/5.0 |
| Josephine Due | 1 | $20,730 | 31 | 4.97/5.0 |
| Pernille | 1 | $19,178 | 134 | 4.81/5.0 |
| Claus | 1 | $17,119 | 42 | 4.67/5.0 |
| Rikke | 1 | $16,105 | 24 | 4.50/5.0 |
| Mette Kirstine | 1 | $11,881 | 94 | 4.67/5.0 |
| Anders | 1 | $10,579 | 13 | 4.77/5.0 |
| Hanne | 1 | $9,458 | 14 | 4.50/5.0 |
| Tanja | 1 | $8,864 | 9 | 5.00/5.0 |
Analyzing the strategies of top hosts, such as their property selection, pricing, and guest communication, can offer valuable lessons for optimizing your own Airbnb operations in Hyllingebjerg.
Dive Deeper: Advanced Hyllingebjerg STR Market Data (2026)
Ready to unlock more insights? AirROI provides access to advanced metrics and comprehensive Airbnb data for Hyllingebjerg. Explore detailed analytics beyond this report to refine your investment strategy, optimize pricing, and maximize your vacation rental profits.
Explore Advanced MetricsHyllingebjerg Short-Term Rental Market Composition (2026): Property & Room Types
Room Type Distribution
Property Type Distribution
Market Composition Insights for Hyllingebjerg
- The Hyllingebjerg Airbnb market composition is heavily skewed towards Entire Home/Apt listings, which make up 100% of the 17 active rentals. This indicates strong guest preference for privacy and space.
- Looking at the property type distribution in Hyllingebjerg, Outdoor/Unique properties are the most common (52.9%), reflecting the local real estate landscape.
- Houses represent a significant 41.2% portion, catering likely to families or larger groups.
Hyllingebjerg Airbnb Room Capacity Analysis (2026): Bedroom Distribution
Distribution of Listings by Number of Bedrooms
Room Capacity Insights for Hyllingebjerg
- The dominant room capacity in Hyllingebjerg is 3 bedrooms listings, making up 52.9% of the market. This suggests a strong demand for properties suitable for families or small groups.
- Together, 3 bedrooms and 2 bedrooms properties represent 76.4% of the active Airbnb listings in Hyllingebjerg, indicating a high concentration in these sizes.
- A significant 76.5% of listings offer 3+ bedrooms, catering to larger groups and families seeking more space in Hyllingebjerg.
Hyllingebjerg Vacation Rental Guest Capacity Trends (2026)
Distribution of Listings by Guest Capacity
Guest Capacity Insights for Hyllingebjerg
- The most common guest capacity trend in Hyllingebjerg vacation rentals is listings accommodating 6 guests (52.9%). This suggests the primary traveler segment is likely larger groups.
- Properties designed for 6 guests and 8+ guests dominate the Hyllingebjerg STR market, accounting for 76.4% of listings.
- 76.4% of properties accommodate 6+ guests, serving the market segment for larger families or group travel in Hyllingebjerg.
- On average, properties in Hyllingebjerg are equipped to host 6.1 guests.
Hyllingebjerg Airbnb Booking Patterns (2026): Available vs. Booked Days
Available Days Distribution
Booked Days Distribution
Booking Pattern Insights for Hyllingebjerg
- The most common availability pattern in Hyllingebjerg falls within the 271-366 days range, representing 76.5% of listings. This suggests many properties have significant open periods on their calendars.
- Approximately 100.0% of listings show high availability (181+ days open annually), indicating potential for increased bookings or specific owner usage patterns.
- For booked days, the 1-30 days range is most frequent in Hyllingebjerg (41.2%), reflecting common guest stay durations or potential owner blocking patterns.
Hyllingebjerg Airbnb Minimum Stay Requirements Analysis
Distribution of Listings by Minimum Night Requirement
2 Nights
1 listings
5.9% of total
3 Nights
1 listings
5.9% of total
4-6 Nights
6 listings
35.3% of total
7-29 Nights
3 listings
17.6% of total
30+ Nights
6 listings
35.3% of total
Key Insights
- The most prevalent minimum stay requirement in Hyllingebjerg is 4-6 Nights, adopted by 35.3% of listings. This highlights the market's preference for longer commitments.
- Very short stays (1-2 nights) are less common (5.9%), suggesting hosts prefer slightly longer bookings to optimize turnover.
- A significant segment (35.3%) caters to monthly stays (30+ nights) in Hyllingebjerg, pointing to opportunities in the extended-stay market.
Recommendations
- Align with the market by considering a 4-6 Nights minimum stay, as 35.3% of Hyllingebjerg hosts use this setting.
- Explore offering discounts for stays of 30+ nights to attract the 35.3% of the market seeking extended stays.
- Adjust minimum nights based on seasonality – potentially shorter during low season and longer during peak demand periods in Hyllingebjerg.
Hyllingebjerg Airbnb Cancellation Policy Trends Analysis (2026)
Flexible
2 listings
11.8% of total
Moderate
7 listings
41.2% of total
Firm
3 listings
17.6% of total
Strict
5 listings
29.4% of total
Cancellation Policy Insights for Hyllingebjerg
- The prevailing Airbnb cancellation policy trend in Hyllingebjerg is Moderate, used by 41.2% of listings.
- There's a relatively balanced mix between guest-friendly (53.0%) and stricter (47.0%) policies, offering choices for different guest needs.
Recommendations for Hosts
- Consider adopting a Moderate policy to align with the 41.2% market standard in Hyllingebjerg.
- Regularly review your cancellation policy against competitors and market demand shifts in Hyllingebjerg.
Hyllingebjerg STR Booking Lead Time Analysis (2026)
Average Booking Lead Time by Month
Booking Lead Time Insights for Hyllingebjerg
- The overall average booking lead time for vacation rentals in Hyllingebjerg is 58 days.
- Guests book furthest in advance for stays during July (average 124 days), likely coinciding with peak travel demand or local events.
- The shortest booking windows occur for stays in February (average 1 days), indicating more last-minute travel plans during this time.
- Seasonally, Summer (94 days avg.) sees the longest lead times, while Winter (9 days avg.) has the shortest, reflecting typical travel planning cycles.
Recommendations for Hosts
- Use the overall average lead time (58 days) as a baseline for your pricing and availability strategy in Hyllingebjerg.
- For July stays, consider implementing length-of-stay discounts or slightly higher rates for bookings made less than 124 days out to capitalize on advance planning.
- During February, focus on last-minute booking availability and promotions, as guests book with very short notice (1 days avg.).
- Target marketing efforts for the Summer season well in advance (at least 94 days) to capture early planners.
- Monitor your own booking lead times against these Hyllingebjerg averages to identify opportunities for dynamic pricing adjustments.
Popular & Essential Airbnb Amenities in Hyllingebjerg (2026)
Amenity Prevalence
Amenity Insights for Hyllingebjerg
- Essential amenities in Hyllingebjerg that guests expect include: Kitchen, Free parking on premises. Lacking these (any) could significantly impact bookings.
- Popular amenities like Wifi, Dishes and silverware, Heating are common but not universal. Offering these can provide a competitive edge.
- Warning: Wifi is not universally provided but is considered essential globally. Ensure reliable Wifi is offered.
Recommendations for Hosts
- Ensure your listing includes all essential amenities for Hyllingebjerg: Kitchen, Free parking on premises.
- Consider adding popular differentiators like Wifi or Dishes and silverware to increase appeal.
- Highlight unique or less common amenities you offer (e.g., hot tub, dedicated workspace, EV charger) in your listing description and photos.
- Regularly check competitor amenities in Hyllingebjerg to stay competitive.
Hyllingebjerg Airbnb Guest Demographics & Profile Analysis (2026)
Guest Profile Summary for Hyllingebjerg
- The typical guest profile for Airbnb in Hyllingebjerg consists of a mix of domestic (54%) and international guests, often arriving from nearby Copenhagen, typically belonging to the Post-2000s (Gen Z/Alpha) group (50%), primarily speaking English or Danish.
- Domestic travelers account for 53.7% of guests.
- Key international markets include Denmark (53.7%) and Germany (22%).
- Top languages spoken are English (34.9%) followed by Danish (20.6%).
- A significant demographic segment is the Post-2000s (Gen Z/Alpha) group, representing 50% of guests.
Recommendations for Hosts
- Balance marketing efforts between domestic and international channels based on the guest mix.
- Tailor amenities and listing descriptions to appeal to the dominant Post-2000s (Gen Z/Alpha) demographic (e.g., highlight fast WiFi, smart home features, local guides).
- Highlight unique local experiences or amenities relevant to the primary guest profile.
- Consider seasonal promotions aligned with peak travel times for key origin markets.
Nearby Short-Term Rental Market Comparison
How does the Hyllingebjerg Airbnb market stack up against its neighbors? Compare key performance metrics like average monthly revenue, ADR, and occupancy rates in surrounding areas to understand the broader regional STR landscape.
| Market | Active Properties | Monthly Revenue | Daily Rate | Avg. Occupancy |
|---|---|---|---|---|
| Lohals | 20 | $3,224 | $331.99 | 39% |
| Copenhagen | 9,759 | $2,189 | $211.20 | 50% |
| Korshavn | 15 | $2,146 | $249.06 | 41% |
| Lerums kommun | 35 | $2,132 | $265.18 | 45% |
| Laröd | 12 | $2,085 | $348.72 | 39% |
| Solrød Strand | 50 | $2,052 | $222.46 | 47% |
| Stillinge Strand | 22 | $2,006 | $227.91 | 38% |
| Bollebygds kommun | 15 | $1,983 | $184.70 | 41% |
| Rude Strand | 30 | $1,978 | $243.37 | 36% |
| Tørresø Strand | 26 | $1,963 | $213.95 | 41% |