Muleby Airbnb Market Analysis 2026: Short Term Rental Data & Vacation Rental Statistics in Capital Region of Denmark, Denmark
Is Airbnb profitable in Muleby in 2026? Explore comprehensive Airbnb analytics for Muleby, Capital Region of Denmark, Denmark to uncover income potential. This 2026 STR market report for Muleby, based on AirROI data from February 2025 to January 2026, reveals key trends in the niche market of 20 active listings.
Whether you're considering an Airbnb investment in Muleby, optimizing your existing vacation rental, or exploring rental arbitrage opportunities, understanding the Muleby Airbnb data is crucial. Leveraging the low regulation environment is key to maximizing your short term rental income potential. Let's dive into the specifics.
Key Muleby Airbnb Performance Metrics Overview
Monthly Airbnb Revenue Variations & Income Potential in Muleby (2026)
Understanding the monthly revenue variations for Airbnb listings in Muleby is key to maximizing your short term rental income potential. Seasonality significantly impacts earnings. Our analysis, based on data from the past 12 months, shows that the peak revenue month for STRs in Muleby is typically July, while December often presents the lowest earnings, highlighting opportunities for strategic pricing adjustments during shoulder and low seasons. Explore the typical Airbnb income in Muleby across different performance tiers:
- Best-in-class properties (Top 10%) achieve $4,429+ monthly, often utilizing dynamic pricing and superior guest experiences.
- Strong performing properties (Top 25%) earn $2,905 or more, indicating effective management and desirable locations/amenities.
- Typical properties (Median) generate around $1,708 per month, representing the average market performance.
- Entry-level properties (Bottom 25%) see earnings around $1,080, often with potential for optimization.
Average Monthly Airbnb Earnings Trend in Muleby
Muleby Airbnb Occupancy Rate Trends (2026)
Maximize your bookings by understanding the Muleby STR occupancy trends. Seasonal demand shifts significantly influence how often properties are booked. Typically, Julysees the highest demand (peak season occupancy), while December experiences the lowest (low season). Effective strategies, like adjusting minimum stays or offering promotions, can boost occupancy during slower periods. Here's how different property tiers perform in Muleby:
- Best-in-class properties (Top 10%) achieve 69%+ occupancy, indicating high desirability and potentially optimized availability.
- Strong performing properties (Top 25%) maintain 58% or higher occupancy, suggesting good market fit and guest satisfaction.
- Typical properties (Median) have an occupancy rate around 39%.
- Entry-level properties (Bottom 25%) average 23% occupancy, potentially facing higher vacancy.
Average Monthly Occupancy Rate Trend in Muleby
Average Daily Rate (ADR) Airbnb Trends in Muleby (2026)
Effective short term rental pricing strategy in Muleby involves understanding monthly ADR fluctuations. The Average Daily Rate (ADR) for Airbnb in Muleby typically peaks in August and dips lowest during March. Leveraging Airbnb dynamic pricing tools or strategies based on this seasonality can significantly boost revenue. Here's a look at the typical nightly rates achieved:
- Best-in-class properties (Top 10%) command rates of $384+ per night, often due to premium features or locations.
- Strong performing properties (Top 25%) achieve nightly rates of $272 or more.
- Typical properties (Median) charge around $193 per night.
- Entry-level properties (Bottom 25%) earn around $116 per night.
Average Daily Rate (ADR) Trend by Month in Muleby
Get Live Muleby Market Intelligence 👇

Explore Real-time Analytics
Airbnb Seasonality Analysis & Trends in Muleby (2026)
Peak Season (July, August, June)
- Revenue averages $3,834 per month
- Occupancy rates average 69.9%
- Daily rates average $235
Shoulder Season
- Revenue averages $2,000 per month
- Occupancy maintains around 39.6%
- Daily rates hold near $203
Low Season (January, October, December)
- Revenue drops to average $1,124 per month
- Occupancy decreases to average 16.3%
- Daily rates adjust to average $210
Seasonality Insights for Muleby
- The Airbnb seasonality in Muleby shows highly seasonal trends requiring careful strategy. While the sections above show seasonal averages, it's also insightful to look at the extremes:
- During the high season, the absolute peak month showcases Muleby's highest earning potential, with monthly revenues capable of climbing to $4,936, occupancy reaching a high of 80.2%, and ADRs peaking at $246.
- Conversely, the slowest single month of the year, typically falling within the low season, marks the market's lowest point. In this month, revenue might dip to $808, occupancy could drop to 11.3%, and ADRs may adjust down to $195.
- Understanding both the seasonal averages and these monthly peaks and troughs in revenue, occupancy, and ADR is crucial for maximizing your Airbnb profit potential in Muleby.
Seasonal Strategies for Maximizing Profit
- Peak Season: Maximize revenue through premium pricing and potentially longer minimum stays. Ensure high availability.
- Low Season: Offer competitive pricing, special promotions (e.g., extended stay discounts), and flexible cancellation policies. Target off-season travelers like remote workers or budget-conscious guests.
- Shoulder Seasons: Implement dynamic pricing that balances peak and low rates. Target weekend travelers or specific events. Offer slightly more flexible terms than peak season.
- Regularly analyze your own performance against these Muleby seasonality benchmarks and adjust your pricing and availability strategy accordingly.
Best Areas for Airbnb Investment in Muleby (2026)
Exploring the top neighborhoods for short-term rentals in Muleby? This section highlights key areas, outlining why they are attractive for hosts and guests, along with notable local attractions. Consider these locations based on your target guest profile and investment strategy.
| Neighborhood / Area | Why Host Here? (Target Guests & Appeal) | Key Attractions & Landmarks |
|---|---|---|
| Copenhagen | The capital city offers cultural richness, historical sites, and a vibrant nightlife. It attracts tourists year-round and has a strong market for short-term rentals. | Tivoli Gardens, Nyhavn, The Little Mermaid, Rosenborg Castle, Freetown Christiania, Copenhagen Opera House |
| Frederiksberg | An affluent area known for its lush parks, shopping, and dining. It's popular with both tourists and locals, making it a prime spot for Airbnb hosting. | Frederiksberg Garden, Copenhagen Zoo, Frederiksberg Centre, The Royal Danish Conservatory of Music |
| Ballerup | A suburban area with great transport links to Copenhagen, ideal for families and business travelers looking for a quieter stay close to the city. | Ballerup Super Arena, Møllepromenade, The Ballerup Sports Arena |
| Helsinge | A charming town north of Copenhagen, known for its picturesque surroundings and proximity to nature, attractive for those seeking a retreat. | Lake Egsmark, Helsinge's local markets, Natural beaches nearby |
| Hørsholm | A beautiful district with historical sites and nature parks, offering a peaceful stay with easy access to the bustling capital. | Hørsholm Midtpunkt, Hørsholm Palace, The Danish Museum of Science and Technology |
| Lyngby | A vibrant suburban area with a mix of urban and natural environments, popular for business and leisure travelers. | Lyngby Lake, The Lyngby Town Centre, Dyrehaven |
| Søborg | A residential area that offers a calm environment with good connections to the capital, ideal for longer stays. | Søborg Lake, Shopping Mall, Green parks and trails |
| Gladsaxe | A family-friendly area with schools, parks, and close proximity to Copenhagen, appealing to family travelers. | Gladsaxe Stadium, CinemaxX Gladsaxe, Local parks and recreational areas |
Understanding Airbnb License Requirements & STR Laws in Muleby (2026)
While Muleby, Capital Region of Denmark, Denmark currently shows low STR regulations, specific Airbnb license requirements might still exist or change. Always verify the latest short term rental regulations and Airbnb license requirements directly with local government authorities for Muleby to ensure full compliance before hosting.
(Source: AirROI data, 2026, finding no licensed listings among those analyzed)
Top Performing Airbnb Properties in Muleby (2026)
Benchmark your potential! Explore examples of top-performing Airbnb properties in Mulebybased on Trailing Twelve Month (TTM) revenue. Analyze their characteristics, revenue, occupancy rate, and ADR to understand what drives success in this market.

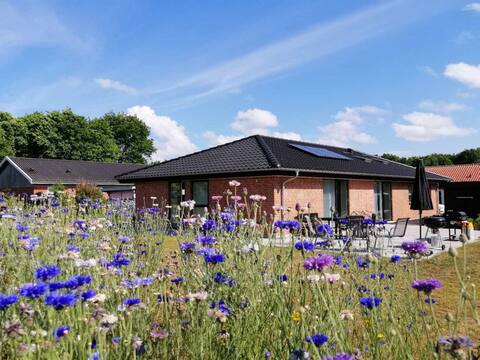
Beautiful summer cottage in the woods
Entire Place • 3 bedrooms
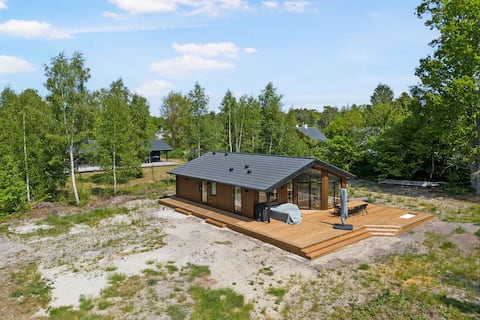
"Helmi" - 1km from the sea by Interhome
Entire Place • 3 bedrooms
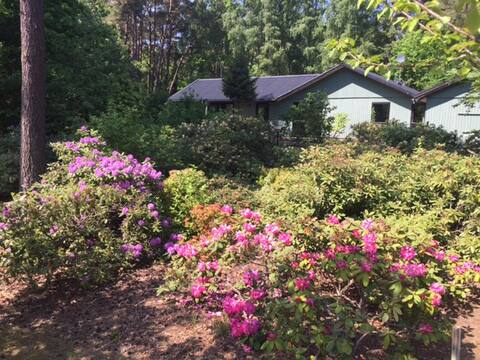
Newly built luxury house on Bornholm
Entire Place • 3 bedrooms
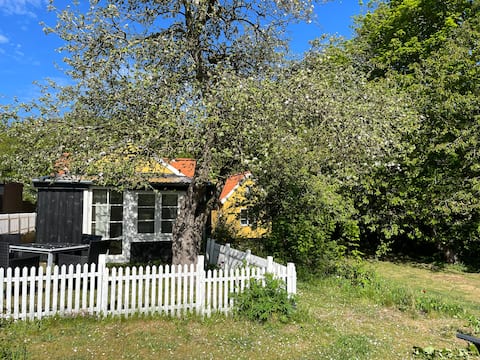
Summer house in nature near beach
Entire Place • 3 bedrooms
Small cozy cottage close to forest and beach.
Entire Place • 2 bedrooms

Forest idyll on Bornholm
Entire Place • 2 bedrooms
Note: Performance varies based on location, size, amenities, seasonality, and management quality. Data reflects the past 12 months.
Top Performing Airbnb Hosts in Muleby (2026)
Learn from the best! This table showcases top-performing Airbnb hosts in Muleby based on the number of properties managed and estimated total revenue over the past year. Analyze their scale and performance metrics.
| Host Name | Properties | Grossing Revenue | Stay Reviews | Avg Rating |
|---|---|---|---|---|
| Paulina - Interhome | 2 | $55,176 | 2 | Not Rated |
| Sannemarie | 3 | $49,359 | 153 | 4.95/5.0 |
| Betina | 1 | $41,368 | 42 | 4.95/5.0 |
| Campaya | 1 | $35,554 | 3 | 4.33/5.0 |
| Hanne | 1 | $23,199 | 42 | 4.95/5.0 |
| Rebecca | 1 | $16,138 | 58 | 4.95/5.0 |
| Irena | 1 | $15,619 | 10 | 4.80/5.0 |
| Lone | 3 | $14,504 | 27 | 4.91/5.0 |
| Dorte | 1 | $14,478 | 94 | 4.95/5.0 |
| Gitte | 1 | $12,670 | 84 | 4.79/5.0 |
Analyzing the strategies of top hosts, such as their property selection, pricing, and guest communication, can offer valuable lessons for optimizing your own Airbnb operations in Muleby.
Dive Deeper: Advanced Muleby STR Market Data (2026)
Ready to unlock more insights? AirROI provides access to advanced metrics and comprehensive Airbnb data for Muleby. Explore detailed analytics beyond this report to refine your investment strategy, optimize pricing, and maximize your vacation rental profits.
Explore Advanced MetricsMuleby Short-Term Rental Market Composition (2026): Property & Room Types
Room Type Distribution
Property Type Distribution
Market Composition Insights for Muleby
- The Muleby Airbnb market composition is heavily skewed towards Entire Home/Apt listings, which make up 100% of the 20 active rentals. This indicates strong guest preference for privacy and space.
- Looking at the property type distribution in Muleby, House properties are the most common (60%), reflecting the local real estate landscape.
- Houses represent a significant 60% portion, catering likely to families or larger groups.
Muleby Airbnb Room Capacity Analysis (2026): Bedroom Distribution
Distribution of Listings by Number of Bedrooms
Room Capacity Insights for Muleby
- The dominant room capacity in Muleby is 2 bedrooms listings, making up 40% of the market. This suggests a strong demand for properties suitable for couples or solo travelers.
- Together, 2 bedrooms and 1 bedroom properties represent 65.0% of the active Airbnb listings in Muleby, indicating a high concentration in these sizes.
- A significant 35.0% of listings offer 3+ bedrooms, catering to larger groups and families seeking more space in Muleby.
Muleby Vacation Rental Guest Capacity Trends (2026)
Distribution of Listings by Guest Capacity
Guest Capacity Insights for Muleby
- The most common guest capacity trend in Muleby vacation rentals is listings accommodating 4 guests (35%). This suggests the primary traveler segment is likely small families or groups.
- Properties designed for 4 guests and 6 guests dominate the Muleby STR market, accounting for 70.0% of listings.
- 50.0% of properties accommodate 6+ guests, serving the market segment for larger families or group travel in Muleby.
- On average, properties in Muleby are equipped to host 5.0 guests.
Muleby Airbnb Booking Patterns (2026): Available vs. Booked Days
Available Days Distribution
Booked Days Distribution
Booking Pattern Insights for Muleby
- The most common availability pattern in Muleby falls within the 271-366 days range, representing 55% of listings. This suggests many properties have significant open periods on their calendars.
- Approximately 95.0% of listings show high availability (181+ days open annually), indicating potential for increased bookings or specific owner usage patterns.
- For booked days, the 31-90 days range is most frequent in Muleby (30%), reflecting common guest stay durations or potential owner blocking patterns.
- A notable 15.0% of properties secure long booking periods (181+ days booked per year), highlighting successful long-term rental strategies or significant owner usage.
Muleby Airbnb Minimum Stay Requirements Analysis
Distribution of Listings by Minimum Night Requirement
1 Night
3 listings
15% of total
2 Nights
1 listings
5% of total
3 Nights
2 listings
10% of total
4-6 Nights
1 listings
5% of total
30+ Nights
13 listings
65% of total
Key Insights
- The most prevalent minimum stay requirement in Muleby is 30+ Nights, adopted by 65% of listings. This highlights the market's preference for longer commitments.
- A significant segment (65%) caters to monthly stays (30+ nights) in Muleby, pointing to opportunities in the extended-stay market.
Recommendations
- Align with the market by considering a 30+ Nights minimum stay, as 65% of Muleby hosts use this setting.
- If feasible, allowing 1-night stays, especially midweek or during low season, could capture last-minute bookings, as only 15% currently do.
- Explore offering discounts for stays of 30+ nights to attract the 65% of the market seeking extended stays.
- Adjust minimum nights based on seasonality – potentially shorter during low season and longer during peak demand periods in Muleby.
Muleby Airbnb Cancellation Policy Trends Analysis (2026)
Super Strict 30 Days
1 listings
5% of total
Flexible
4 listings
20% of total
Moderate
3 listings
15% of total
Firm
6 listings
30% of total
Strict
6 listings
30% of total
Cancellation Policy Insights for Muleby
- The prevailing Airbnb cancellation policy trend in Muleby is Firm, used by 30% of listings.
- A majority (60.0%) of hosts in Muleby utilize Firm or Strict policies, indicating a market where hosts prioritize booking security.
Recommendations for Hosts
- Consider adopting a Firm policy to align with the 30% market standard in Muleby.
- Regularly review your cancellation policy against competitors and market demand shifts in Muleby.
Muleby STR Booking Lead Time Analysis (2026)
Average Booking Lead Time by Month
Booking Lead Time Insights for Muleby
- The overall average booking lead time for vacation rentals in Muleby is 96 days.
- Guests book furthest in advance for stays during July (average 146 days), likely coinciding with peak travel demand or local events.
- The shortest booking windows occur for stays in November (average 11 days), indicating more last-minute travel plans during this time.
- Seasonally, Summer (125 days avg.) sees the longest lead times, while Winter (35 days avg.) has the shortest, reflecting typical travel planning cycles.
Recommendations for Hosts
- Use the overall average lead time (96 days) as a baseline for your pricing and availability strategy in Muleby.
- For July stays, consider implementing length-of-stay discounts or slightly higher rates for bookings made less than 146 days out to capitalize on advance planning.
- During November, focus on last-minute booking availability and promotions, as guests book with very short notice (11 days avg.).
- Target marketing efforts for the Summer season well in advance (at least 125 days) to capture early planners.
- Monitor your own booking lead times against these Muleby averages to identify opportunities for dynamic pricing adjustments.
Popular & Essential Airbnb Amenities in Muleby (2026)
Amenity Prevalence
Amenity Insights for Muleby
- Essential amenities in Muleby that guests expect include: Wifi. Lacking these (this) could significantly impact bookings.
- Popular amenities like Private entrance, Heating, TV are common but not universal. Offering these can provide a competitive edge.
Recommendations for Hosts
- Ensure your listing includes all essential amenities for Muleby: Wifi.
- Consider adding popular differentiators like Private entrance or Heating to increase appeal.
- Highlight unique or less common amenities you offer (e.g., hot tub, dedicated workspace, EV charger) in your listing description and photos.
- Regularly check competitor amenities in Muleby to stay competitive.
Muleby Airbnb Guest Demographics & Profile Analysis (2026)
Guest Profile Summary for Muleby
- The typical guest profile for Airbnb in Muleby consists of a mix of domestic (60%) and international guests, often arriving from nearby Copenhagen, typically belonging to the Post-2000s (Gen Z/Alpha) group (50%), primarily speaking English or Danish.
- Domestic travelers account for 60.0% of guests.
- Key international markets include Denmark (60%) and Germany (23.3%).
- Top languages spoken are English (35%) followed by Danish (18.3%).
- A significant demographic segment is the Post-2000s (Gen Z/Alpha) group, representing 50% of guests.
Recommendations for Hosts
- Balance marketing efforts between domestic and international channels based on the guest mix.
- Tailor amenities and listing descriptions to appeal to the dominant Post-2000s (Gen Z/Alpha) demographic (e.g., highlight fast WiFi, smart home features, local guides).
- Highlight unique local experiences or amenities relevant to the primary guest profile.
- Consider seasonal promotions aligned with peak travel times for key origin markets.
Nearby Short-Term Rental Market Comparison
How does the Muleby Airbnb market stack up against its neighbors? Compare key performance metrics like average monthly revenue, ADR, and occupancy rates in surrounding areas to understand the broader regional STR landscape.
| Market | Active Properties | Monthly Revenue | Daily Rate | Avg. Occupancy |
|---|---|---|---|---|
| Tejn | 60 | $2,181 | $275.98 | 43% |
| Östra Göinge kommun | 10 | $2,138 | $216.64 | 45% |
| Perstorps kommun | 13 | $2,081 | $161.55 | 48% |
| Örkelljunga | 17 | $1,963 | $305.70 | 28% |
| Vellinge | 18 | $1,754 | $176.42 | 44% |
| Årsdale | 37 | $1,750 | $220.09 | 41% |
| Allinge-Sandvig | 88 | $1,711 | $235.69 | 39% |
| Klausdorf | 19 | $1,672 | $146.23 | 44% |
| Listed | 11 | $1,637 | $169.96 | 48% |
| Vittsjö | 20 | $1,636 | $188.66 | 40% |