Nærum Airbnb Market Analysis 2026: Short Term Rental Data & Vacation Rental Statistics in Capital Region of Denmark, Denmark
Is Airbnb profitable in Nærum in 2026? Explore comprehensive Airbnb analytics for Nærum, Capital Region of Denmark, Denmark to uncover income potential. This 2026 STR market report for Nærum, based on AirROI data from February 2025 to January 2026, reveals key trends in the niche market of 20 active listings.
Whether you're considering an Airbnb investment in Nærum, optimizing your existing vacation rental, or exploring rental arbitrage opportunities, understanding the Nærum Airbnb data is crucial. Leveraging the low regulation environment is key to maximizing your short term rental income potential. Let's dive into the specifics.
Key Nærum Airbnb Performance Metrics Overview
Monthly Airbnb Revenue Variations & Income Potential in Nærum (2026)
Understanding the monthly revenue variations for Airbnb listings in Nærum is key to maximizing your short term rental income potential. Seasonality significantly impacts earnings. Our analysis, based on data from the past 12 months, shows that the peak revenue month for STRs in Nærum is typically August, while September often presents the lowest earnings, highlighting opportunities for strategic pricing adjustments during shoulder and low seasons. Explore the typical Airbnb income in Nærum across different performance tiers:
- Best-in-class properties (Top 10%) achieve $4,968+ monthly, often utilizing dynamic pricing and superior guest experiences.
- Strong performing properties (Top 25%) earn $3,249 or more, indicating effective management and desirable locations/amenities.
- Typical properties (Median) generate around $1,650 per month, representing the average market performance.
- Entry-level properties (Bottom 25%) see earnings around $943, often with potential for optimization.
Average Monthly Airbnb Earnings Trend in Nærum
Nærum Airbnb Occupancy Rate Trends (2026)
Maximize your bookings by understanding the Nærum STR occupancy trends. Seasonal demand shifts significantly influence how often properties are booked. Typically, Julysees the highest demand (peak season occupancy), while May experiences the lowest (low season). Effective strategies, like adjusting minimum stays or offering promotions, can boost occupancy during slower periods. Here's how different property tiers perform in Nærum:
- Best-in-class properties (Top 10%) achieve 81%+ occupancy, indicating high desirability and potentially optimized availability.
- Strong performing properties (Top 25%) maintain 57% or higher occupancy, suggesting good market fit and guest satisfaction.
- Typical properties (Median) have an occupancy rate around 28%.
- Entry-level properties (Bottom 25%) average 17% occupancy, potentially facing higher vacancy.
Average Monthly Occupancy Rate Trend in Nærum
Average Daily Rate (ADR) Airbnb Trends in Nærum (2026)
Effective short term rental pricing strategy in Nærum involves understanding monthly ADR fluctuations. The Average Daily Rate (ADR) for Airbnb in Nærum typically peaks in December and dips lowest during April. Leveraging Airbnb dynamic pricing tools or strategies based on this seasonality can significantly boost revenue. Here's a look at the typical nightly rates achieved:
- Best-in-class properties (Top 10%) command rates of $309+ per night, often due to premium features or locations.
- Strong performing properties (Top 25%) achieve nightly rates of $231 or more.
- Typical properties (Median) charge around $177 per night.
- Entry-level properties (Bottom 25%) earn around $131 per night.
Average Daily Rate (ADR) Trend by Month in Nærum
Get Live Nærum Market Intelligence 👇

Explore Real-time Analytics
Airbnb Seasonality Analysis & Trends in Nærum (2026)
Peak Season (August, June, July)
- Revenue averages $2,983 per month
- Occupancy rates average 55.2%
- Daily rates average $188
Shoulder Season
- Revenue averages $2,159 per month
- Occupancy maintains around 35.4%
- Daily rates hold near $192
Low Season (February, September, October)
- Revenue drops to average $1,682 per month
- Occupancy decreases to average 28.0%
- Daily rates adjust to average $193
Seasonality Insights for Nærum
- The Airbnb seasonality in Nærum shows highly seasonal trends requiring careful strategy. While the sections above show seasonal averages, it's also insightful to look at the extremes:
- During the high season, the absolute peak month showcases Nærum's highest earning potential, with monthly revenues capable of climbing to $3,273, occupancy reaching a high of 56.7%, and ADRs peaking at $204.
- Conversely, the slowest single month of the year, typically falling within the low season, marks the market's lowest point. In this month, revenue might dip to $1,579, occupancy could drop to 23.4%, and ADRs may adjust down to $181.
- Understanding both the seasonal averages and these monthly peaks and troughs in revenue, occupancy, and ADR is crucial for maximizing your Airbnb profit potential in Nærum.
Seasonal Strategies for Maximizing Profit
- Peak Season: Maximize revenue through premium pricing and potentially longer minimum stays. Ensure high availability.
- Low Season: Offer competitive pricing, special promotions (e.g., extended stay discounts), and flexible cancellation policies. Target off-season travelers like remote workers or budget-conscious guests.
- Shoulder Seasons: Implement dynamic pricing that balances peak and low rates. Target weekend travelers or specific events. Offer slightly more flexible terms than peak season.
- Regularly analyze your own performance against these Nærum seasonality benchmarks and adjust your pricing and availability strategy accordingly.
Best Areas for Airbnb Investment in Nærum (2026)
Exploring the top neighborhoods for short-term rentals in Nærum? This section highlights key areas, outlining why they are attractive for hosts and guests, along with notable local attractions. Consider these locations based on your target guest profile and investment strategy.
| Neighborhood / Area | Why Host Here? (Target Guests & Appeal) | Key Attractions & Landmarks |
|---|---|---|
| Nærum Village | Charming village atmosphere with a strong local community feel. Attractive for families and travelers seeking a peaceful retreat while being close to the metropolitan area of Copenhagen. | Nærum Park, Nærum Church, Local cafes and restaurants, Nature trails, Nearby lakes |
| Lyngby | Nearby larger town with excellent shopping and dining options. Popular with business travelers and university students due to its proximity to DTU (Technical University of Denmark). | Lyngby Storcenter, The Frilandsmuseet, Lyngby Lake, Local parks, DTU campus |
| Kgs. Lyngby | Trendy suburb with a mix of urban conveniences and nature, attracting visitors who enjoy both city living and outdoor activities. Close to important transport links to Copenhagen. | Kgs. Lyngby Shopping Mall, Cinemas, Local eateries, Parks and green spaces, The Lyngby River |
| Gladsaxe | Diverse suburb with rich cultural offerings and parks. Appeals to families and young professionals looking for an affordable stay close to Copenhagen. | Gladsaxe Stadium, Parks and playgrounds, Local markets, The Gladsaxe Museum, Public transport to the city |
| Hellerup | Upscale residential area known for its beautiful homes and coastal scenery. Attracts affluent visitors looking for a luxurious experience near the beach and nature. | Hellerup Beach, Coastal path, Local boutiques and cafes, The Maritime Museum of Denmark, Eremitage Castle |
| Gentofte | Family-friendly area with great schools and parks. A preferred choice for those traveling with children due to the safe neighborhood and recreational activities. | Gentofte Lake, Local parks and playgrounds, Cultural institutions, Shopping areas, Restaurants and cafes |
| Charlottenlund | A lovely coastal suburb with beaches and parks, attracting tourists looking for a relaxing vacation while having access to Copenhagen's attractions. | Charlottenlund Beach Park, Charlottenlund Palace, The coastal promenade, Local cafes, Parks |
| Bagsværd | A quieter area that offers access to nature and lakes. Ideal for nature enthusiasts looking for tranquility away from the urban hustle. | Bagsværd Lake, Local nature trails, Cafes by the lake, Public parks, Bagsværd Church |
Understanding Airbnb License Requirements & STR Laws in Nærum (2026)
While Nærum, Capital Region of Denmark, Denmark currently shows low STR regulations, specific Airbnb license requirements might still exist or change. Always verify the latest short term rental regulations and Airbnb license requirements directly with local government authorities for Nærum to ensure full compliance before hosting.
(Source: AirROI data, 2026, finding no licensed listings among those analyzed)
Top Performing Airbnb Properties in Nærum (2026)
Benchmark your potential! Explore examples of top-performing Airbnb properties in Nærumbased on Trailing Twelve Month (TTM) revenue. Analyze their characteristics, revenue, occupancy rate, and ADR to understand what drives success in this market.
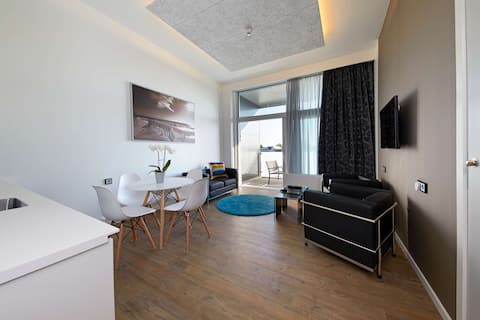
Spacious Apartment with Sunny Balcony for 6
Entire Place • 2 bedrooms

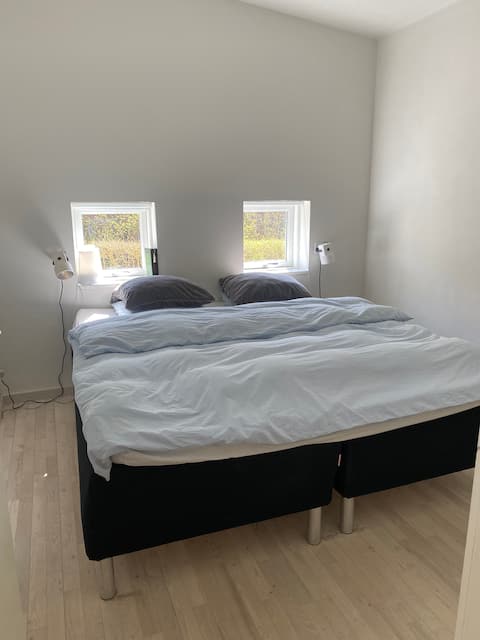
House near beach, forest and Copenhagen
Entire Place • 3 bedrooms

Apartment close to Dyrehaven, the Sea and DTU
Entire Place • 2 bedrooms
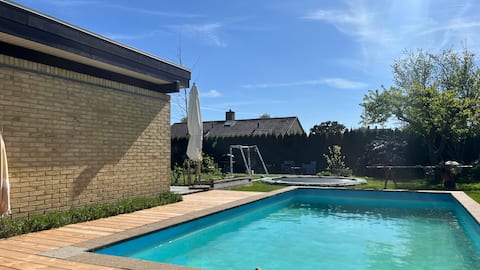
Beautiful house with pool, near the beach.
Entire Place • 3 bedrooms
Townhouse by Dyrehaven & 2.5 km to the beach.
Entire Place • 4 bedrooms
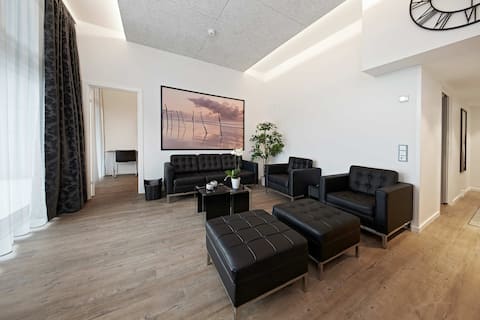
Spacious Penthouse Apartment for 6
Entire Place • 2 bedrooms
Note: Performance varies based on location, size, amenities, seasonality, and management quality. Data reflects the past 12 months.
Top Performing Airbnb Hosts in Nærum (2026)
Learn from the best! This table showcases top-performing Airbnb hosts in Nærum based on the number of properties managed and estimated total revenue over the past year. Analyze their scale and performance metrics.
| Host Name | Properties | Grossing Revenue | Stay Reviews | Avg Rating |
|---|---|---|---|---|
| Nord Collection | 6 | $85,065 | 197 | 4.71/5.0 |
| Anna Josefine | 1 | $40,965 | 12 | 4.92/5.0 |
| Lisbeth | 1 | $24,439 | 114 | 4.95/5.0 |
| Michael | 1 | $24,016 | 4 | 4.50/5.0 |
| Ina | 1 | $22,653 | 8 | 4.88/5.0 |
| Signe Hinz | 1 | $13,041 | 5 | 5.00/5.0 |
| Mette | 1 | $12,473 | 3 | 5.00/5.0 |
| Jakob | 1 | $9,639 | 1 | Not Rated |
| Adam | 1 | $9,426 | 19 | 4.84/5.0 |
| Christian | 1 | $8,771 | 5 | 5.00/5.0 |
Analyzing the strategies of top hosts, such as their property selection, pricing, and guest communication, can offer valuable lessons for optimizing your own Airbnb operations in Nærum.
Dive Deeper: Advanced Nærum STR Market Data (2026)
Ready to unlock more insights? AirROI provides access to advanced metrics and comprehensive Airbnb data for Nærum. Explore detailed analytics beyond this report to refine your investment strategy, optimize pricing, and maximize your vacation rental profits.
Explore Advanced MetricsNærum Short-Term Rental Market Composition (2026): Property & Room Types
Room Type Distribution
Property Type Distribution
Market Composition Insights for Nærum
- The Nærum Airbnb market composition is heavily skewed towards Entire Home/Apt listings, which make up 85% of the 20 active rentals. This indicates strong guest preference for privacy and space.
- Looking at the property type distribution in Nærum, House properties are the most common (50%), reflecting the local real estate landscape.
- Houses represent a significant 50% portion, catering likely to families or larger groups.
Nærum Airbnb Room Capacity Analysis (2026): Bedroom Distribution
Distribution of Listings by Number of Bedrooms
Room Capacity Insights for Nærum
- The dominant room capacity in Nærum is 2 bedrooms listings, making up 25% of the market. This suggests a strong demand for properties suitable for couples or solo travelers.
- Together, 2 bedrooms and 1 bedroom properties represent 50.0% of the active Airbnb listings in Nærum, indicating a high concentration in these sizes.
- A significant 35.0% of listings offer 3+ bedrooms, catering to larger groups and families seeking more space in Nærum.
Nærum Vacation Rental Guest Capacity Trends (2026)
Distribution of Listings by Guest Capacity
Guest Capacity Insights for Nærum
- The most common guest capacity trend in Nærum vacation rentals is listings accommodating 6 guests (20%). This suggests the primary traveler segment is likely larger groups.
- Properties designed for 6 guests and 4 guests dominate the Nærum STR market, accounting for 40.0% of listings.
- 30.0% of properties accommodate 6+ guests, serving the market segment for larger families or group travel in Nærum.
- On average, properties in Nærum are equipped to host 4.1 guests.
Nærum Airbnb Booking Patterns (2026): Available vs. Booked Days
Available Days Distribution
Booked Days Distribution
Booking Pattern Insights for Nærum
- The most common availability pattern in Nærum falls within the 271-366 days range, representing 80% of listings. This suggests many properties have significant open periods on their calendars.
- Approximately 90.0% of listings show high availability (181+ days open annually), indicating potential for increased bookings or specific owner usage patterns.
- For booked days, the 31-90 days range is most frequent in Nærum (45%), reflecting common guest stay durations or potential owner blocking patterns.
- A notable 10.0% of properties secure long booking periods (181+ days booked per year), highlighting successful long-term rental strategies or significant owner usage.
Nærum Airbnb Minimum Stay Requirements Analysis
Distribution of Listings by Minimum Night Requirement
1 Night
1 listings
5% of total
2 Nights
3 listings
15% of total
3 Nights
1 listings
5% of total
4-6 Nights
6 listings
30% of total
7-29 Nights
3 listings
15% of total
30+ Nights
6 listings
30% of total
Key Insights
- The most prevalent minimum stay requirement in Nærum is 4-6 Nights, adopted by 30% of listings. This highlights the market's preference for longer commitments.
- A significant segment (30%) caters to monthly stays (30+ nights) in Nærum, pointing to opportunities in the extended-stay market.
Recommendations
- Align with the market by considering a 4-6 Nights minimum stay, as 30% of Nærum hosts use this setting.
- If feasible, allowing 1-night stays, especially midweek or during low season, could capture last-minute bookings, as only 5% currently do.
- Explore offering discounts for stays of 30+ nights to attract the 30% of the market seeking extended stays.
- Adjust minimum nights based on seasonality – potentially shorter during low season and longer during peak demand periods in Nærum.
Nærum Airbnb Cancellation Policy Trends Analysis (2026)
Flexible
7 listings
35% of total
Moderate
8 listings
40% of total
Firm
4 listings
20% of total
Strict
1 listings
5% of total
Cancellation Policy Insights for Nærum
- The prevailing Airbnb cancellation policy trend in Nærum is Moderate, used by 40% of listings.
- The market strongly favors guest-friendly terms, with 75.0% of listings offering Flexible or Moderate policies. This suggests guests in Nærum may expect booking flexibility.
- Strict cancellation policies are quite rare (5%), potentially making listings with this policy less competitive unless justified by high demand or property type.
Recommendations for Hosts
- Consider adopting a Moderate policy to align with the 40% market standard in Nærum.
- Using a Strict policy might deter some guests, as only 5% of listings use it. Evaluate if potential revenue protection outweighs possible lower booking rates.
- Regularly review your cancellation policy against competitors and market demand shifts in Nærum.
Nærum STR Booking Lead Time Analysis (2026)
Average Booking Lead Time by Month
Booking Lead Time Insights for Nærum
- The overall average booking lead time for vacation rentals in Nærum is 56 days.
- Guests book furthest in advance for stays during June (average 67 days), likely coinciding with peak travel demand or local events.
- The shortest booking windows occur for stays in February (average 16 days), indicating more last-minute travel plans during this time.
- Seasonally, Summer (57 days avg.) sees the longest lead times, while Winter (38 days avg.) has the shortest, reflecting typical travel planning cycles.
Recommendations for Hosts
- Use the overall average lead time (56 days) as a baseline for your pricing and availability strategy in Nærum.
- For June stays, consider implementing length-of-stay discounts or slightly higher rates for bookings made less than 67 days out to capitalize on advance planning.
- Target marketing efforts for the Summer season well in advance (at least 57 days) to capture early planners.
- Monitor your own booking lead times against these Nærum averages to identify opportunities for dynamic pricing adjustments.
Popular & Essential Airbnb Amenities in Nærum (2026)
Amenity Prevalence
Amenity Insights for Nærum
- Essential amenities in Nærum that guests expect include: Kitchen, Wifi, Free parking on premises, Heating, Dishes and silverware, TV, Refrigerator. Lacking these (any) could significantly impact bookings.
- Popular amenities like Washer, Hot water, Oven are common but not universal. Offering these can provide a competitive edge.
Recommendations for Hosts
- Ensure your listing includes all essential amenities for Nærum: Kitchen, Wifi, Free parking on premises, Heating, Dishes and silverware, TV, Refrigerator.
- Prioritize adding missing essentials: Free parking on premises, Heating, Dishes and silverware, TV, Refrigerator.
- Consider adding popular differentiators like Washer or Hot water to increase appeal.
- Highlight unique or less common amenities you offer (e.g., hot tub, dedicated workspace, EV charger) in your listing description and photos.
- Regularly check competitor amenities in Nærum to stay competitive.
Nærum Airbnb Guest Demographics & Profile Analysis (2026)
Guest Profile Summary for Nærum
- The typical guest profile for Airbnb in Nærum consists of a mix of domestic (39%) and international guests, with top international origins including Germany, typically belonging to the Post-2000s (Gen Z/Alpha) group (50%), primarily speaking English or Danish.
- Domestic travelers account for 39.0% of guests.
- Key international markets include Denmark (39%) and Germany (12.2%).
- Top languages spoken are English (46.9%) followed by Danish (28.6%).
- A significant demographic segment is the Post-2000s (Gen Z/Alpha) group, representing 50% of guests.
Recommendations for Hosts
- Focus marketing internationally, particularly towards travelers from Germany.
- Tailor amenities and listing descriptions to appeal to the dominant Post-2000s (Gen Z/Alpha) demographic (e.g., highlight fast WiFi, smart home features, local guides).
- Highlight unique local experiences or amenities relevant to the primary guest profile.
- Consider seasonal promotions aligned with peak travel times for key origin markets.
Nearby Short-Term Rental Market Comparison
How does the Nærum Airbnb market stack up against its neighbors? Compare key performance metrics like average monthly revenue, ADR, and occupancy rates in surrounding areas to understand the broader regional STR landscape.
| Market | Active Properties | Monthly Revenue | Daily Rate | Avg. Occupancy |
|---|---|---|---|---|
| Wittenbeck | 14 | $2,937 | $224.34 | 43% |
| Copenhagen | 9,111 | $2,347 | $222.94 | 52% |
| Råbylille Strand | 31 | $2,254 | $190.70 | 45% |
| Saunte | 10 | $2,212 | $213.23 | 46% |
| Perstorps kommun | 13 | $2,081 | $161.55 | 48% |
| Frederiksberg | 1,015 | $2,062 | $217.28 | 50% |
| Solrød Strand | 54 | $2,032 | $249.51 | 48% |
| Hellerup | 11 | $1,973 | $298.07 | 51% |
| Örkelljunga | 17 | $1,963 | $305.70 | 28% |
| Laröd | 12 | $1,923 | $329.50 | 38% |