Over Dråby Strand Airbnb Market Analysis 2026: Short Term Rental Data & Vacation Rental Statistics in Capital Region of Denmark, Denmark
Is Airbnb profitable in Over Dråby Strand in 2026? Explore comprehensive Airbnb analytics for Over Dråby Strand, Capital Region of Denmark, Denmark to uncover income potential. This 2026 STR market report for Over Dråby Strand, based on AirROI data from February 2025 to January 2026, reveals key trends in the niche market of 19 active listings.
Whether you're considering an Airbnb investment in Over Dråby Strand, optimizing your existing vacation rental, or exploring rental arbitrage opportunities, understanding the Over Dråby Strand Airbnb data is crucial. Leveraging the low regulation environment is key to maximizing your short term rental income potential. Let's dive into the specifics.
Key Over Dråby Strand Airbnb Performance Metrics Overview
Monthly Airbnb Revenue Variations & Income Potential in Over Dråby Strand (2026)
Understanding the monthly revenue variations for Airbnb listings in Over Dråby Strand is key to maximizing your short term rental income potential. Seasonality significantly impacts earnings. Our analysis, based on data from the past 12 months, shows that the peak revenue month for STRs in Over Dråby Strand is typically July, while January often presents the lowest earnings, highlighting opportunities for strategic pricing adjustments during shoulder and low seasons. Explore the typical Airbnb income in Over Dråby Strand across different performance tiers:
- Best-in-class properties (Top 10%) achieve $5,002+ monthly, often utilizing dynamic pricing and superior guest experiences.
- Strong performing properties (Top 25%) earn $3,401 or more, indicating effective management and desirable locations/amenities.
- Typical properties (Median) generate around $1,856 per month, representing the average market performance.
- Entry-level properties (Bottom 25%) see earnings around $1,069, often with potential for optimization.
Average Monthly Airbnb Earnings Trend in Over Dråby Strand
Over Dråby Strand Airbnb Occupancy Rate Trends (2026)
Maximize your bookings by understanding the Over Dråby Strand STR occupancy trends. Seasonal demand shifts significantly influence how often properties are booked. Typically, Julysees the highest demand (peak season occupancy), while January experiences the lowest (low season). Effective strategies, like adjusting minimum stays or offering promotions, can boost occupancy during slower periods. Here's how different property tiers perform in Over Dråby Strand:
- Best-in-class properties (Top 10%) achieve 62%+ occupancy, indicating high desirability and potentially optimized availability.
- Strong performing properties (Top 25%) maintain 52% or higher occupancy, suggesting good market fit and guest satisfaction.
- Typical properties (Median) have an occupancy rate around 36%.
- Entry-level properties (Bottom 25%) average 21% occupancy, potentially facing higher vacancy.
Average Monthly Occupancy Rate Trend in Over Dråby Strand
Average Daily Rate (ADR) Airbnb Trends in Over Dråby Strand (2026)
Effective short term rental pricing strategy in Over Dråby Strand involves understanding monthly ADR fluctuations. The Average Daily Rate (ADR) for Airbnb in Over Dråby Strand typically peaks in December and dips lowest during April. Leveraging Airbnb dynamic pricing tools or strategies based on this seasonality can significantly boost revenue. Here's a look at the typical nightly rates achieved:
- Best-in-class properties (Top 10%) command rates of $316+ per night, often due to premium features or locations.
- Strong performing properties (Top 25%) achieve nightly rates of $220 or more.
- Typical properties (Median) charge around $157 per night.
- Entry-level properties (Bottom 25%) earn around $123 per night.
Average Daily Rate (ADR) Trend by Month in Over Dråby Strand
Get Live Over Dråby Strand Market Intelligence 👇

Explore Real-time Analytics
Airbnb Seasonality Analysis & Trends in Over Dråby Strand (2026)
Peak Season (July, August, June)
- Revenue averages $3,976 per month
- Occupancy rates average 63.3%
- Daily rates average $183
Shoulder Season
- Revenue averages $2,174 per month
- Occupancy maintains around 36.3%
- Daily rates hold near $204
Low Season (January, February, November)
- Revenue drops to average $1,511 per month
- Occupancy decreases to average 17.4%
- Daily rates adjust to average $212
Seasonality Insights for Over Dråby Strand
- The Airbnb seasonality in Over Dråby Strand shows highly seasonal trends requiring careful strategy. While the sections above show seasonal averages, it's also insightful to look at the extremes:
- During the high season, the absolute peak month showcases Over Dråby Strand's highest earning potential, with monthly revenues capable of climbing to $4,428, occupancy reaching a high of 68.6%, and ADRs peaking at $285.
- Conversely, the slowest single month of the year, typically falling within the low season, marks the market's lowest point. In this month, revenue might dip to $1,097, occupancy could drop to 12.0%, and ADRs may adjust down to $176.
- Understanding both the seasonal averages and these monthly peaks and troughs in revenue, occupancy, and ADR is crucial for maximizing your Airbnb profit potential in Over Dråby Strand.
Seasonal Strategies for Maximizing Profit
- Peak Season: Maximize revenue through premium pricing and potentially longer minimum stays. Ensure high availability.
- Low Season: Offer competitive pricing, special promotions (e.g., extended stay discounts), and flexible cancellation policies. Target off-season travelers like remote workers or budget-conscious guests.
- Shoulder Seasons: Implement dynamic pricing that balances peak and low rates. Target weekend travelers or specific events. Offer slightly more flexible terms than peak season.
- Regularly analyze your own performance against these Over Dråby Strand seasonality benchmarks and adjust your pricing and availability strategy accordingly.
Best Areas for Airbnb Investment in Over Dråby Strand (2026)
Exploring the top neighborhoods for short-term rentals in Over Dråby Strand? This section highlights key areas, outlining why they are attractive for hosts and guests, along with notable local attractions. Consider these locations based on your target guest profile and investment strategy.
| Neighborhood / Area | Why Host Here? (Target Guests & Appeal) | Key Attractions & Landmarks |
|---|---|---|
| Over Dråby Strand | A serene coastal area known for its beautiful beaches and relaxed atmosphere. Ideal for families and travelers looking for a peaceful getaway by the sea. | Over Dråby Strand Beach, Local Nature Reserves, Water Sports Activities, Fishing Opportunities, Scenic Cycling Routes, Coastal Walks |
| Copenhagen | The capital city offers a vibrant culture, history, and numerous attractions. Perfect for tourists year-round, with easy access to landmarks and activities. | Tivoli Gardens, The Little Mermaid, Nyhavn, Copenhagen Opera House, Rosenborg Castle, Strøget Shopping Street |
| Helsingør | Famous for Kronborg Castle, this town attracts history buffs and tourists interested in Shakespearean history and coastal charm. | Kronborg Castle, Museum of Hunting and Forestry, Maritime Museum of Denmark, Helsingør Cathedral, Galleon yards, Sculpture for the blind walking trail |
| Roskilde | Home to the iconic Roskilde Festival and rich Viking history, Roskilde attracts music lovers and history enthusiasts alike. | Viking Ship Museum, Roskilde Cathedral, Roskilde Festival Grounds, Museum of Contemporary Art, Roskilde Palace, Nature Parks around the fjord |
| Malmö | Just across the Øresund Bridge from Copenhagen, Malmö combines Danish and Swedish cultures, attracting tourists and business travelers alike. | Turning Torso, Malmö Castle, Lilla Torg, Ribersborg Beach, Malmö Live Concert Hall, Kungsparken |
| Dragør | A charming old fishing village known for its well-preserved buildings and waterfront charm, perfect for a quieter stay near the city. | Dragør Harbor, Old Town, Dragør Fort, Beaches in Dragør, Maritime Museum, Local Seafood Restaurants |
| Køge | Known for its historic town center and beautiful beaches, Køge is a great destination for families seeking relaxation and local culture. | Køge Museum, Køge Marina, Beach at Køge, Køge Old Town, Local Arts and Crafts, Køge Torv market |
| Vordingborg | A picturesque town with rich history and beautiful nature surrounding it, ideal for those looking to escape the hustle and bustle of the city. | Vordingborg Castle, Borreby Manor, Vordingborg Nature Park, Local Beaches, Historic Town Center, Globe of Vordingborg |
Understanding Airbnb License Requirements & STR Laws in Over Dråby Strand (2026)
While Over Dråby Strand, Capital Region of Denmark, Denmark currently shows low STR regulations, specific Airbnb license requirements might still exist or change. Always verify the latest short term rental regulations and Airbnb license requirements directly with local government authorities for Over Dråby Strand to ensure full compliance before hosting.
(Source: AirROI data, 2026, finding no licensed listings among those analyzed)
Top Performing Airbnb Properties in Over Dråby Strand (2026)
Benchmark your potential! Explore examples of top-performing Airbnb properties in Over Dråby Strandbased on Trailing Twelve Month (TTM) revenue. Analyze their characteristics, revenue, occupancy rate, and ADR to understand what drives success in this market.

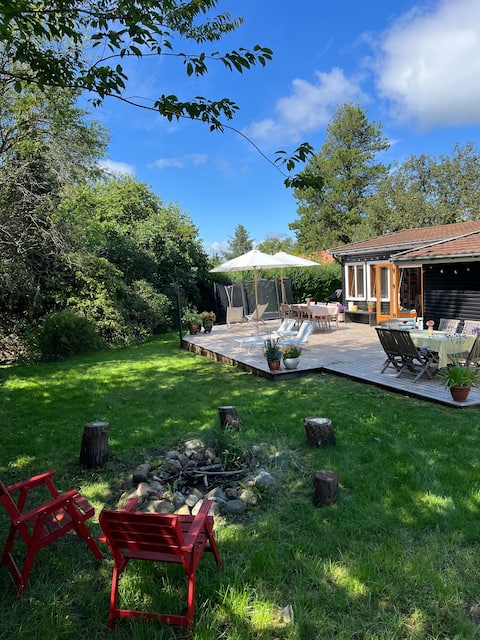
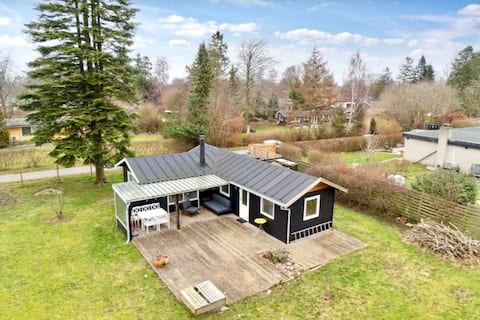
Oceanfront Escape, Private Beach & Sunset Views
Entire Place • 2 bedrooms

Pool and Spa retreat in beautiful nature by Isefjord
Entire Place • 3 bedrooms

Nice summer house with sea view
Entire Place • 3 bedrooms
Cozy, large cottage close to water
Entire Place • 4 bedrooms
Beautiful cottage near forest and water
Entire Place • 2 bedrooms

Oceanfront & peaceful summerhouse
Entire Place • 3 bedrooms
Note: Performance varies based on location, size, amenities, seasonality, and management quality. Data reflects the past 12 months.
Top Performing Airbnb Hosts in Over Dråby Strand (2026)
Learn from the best! This table showcases top-performing Airbnb hosts in Over Dråby Strand based on the number of properties managed and estimated total revenue over the past year. Analyze their scale and performance metrics.
| Host Name | Properties | Grossing Revenue | Stay Reviews | Avg Rating |
|---|---|---|---|---|
| Anders | 1 | $57,416 | 37 | 4.95/5.0 |
| Kim | 1 | $42,114 | 10 | 5.00/5.0 |
| Campaya | 1 | $37,980 | 4 | 4.50/5.0 |
| Cecilie & Søren | 1 | $30,951 | 9 | 5.00/5.0 |
| Anne Sofie Slot | 1 | $29,370 | 9 | 5.00/5.0 |
| Sine | 1 | $29,237 | 42 | 4.83/5.0 |
| Susanne | 1 | $28,830 | 31 | 4.77/5.0 |
| Sonja Solberg | 1 | $25,252 | 5 | 5.00/5.0 |
| Robert | 1 | $19,699 | 7 | 4.71/5.0 |
| Per | 1 | $17,808 | 37 | 4.62/5.0 |
Analyzing the strategies of top hosts, such as their property selection, pricing, and guest communication, can offer valuable lessons for optimizing your own Airbnb operations in Over Dråby Strand.
Dive Deeper: Advanced Over Dråby Strand STR Market Data (2026)
Ready to unlock more insights? AirROI provides access to advanced metrics and comprehensive Airbnb data for Over Dråby Strand. Explore detailed analytics beyond this report to refine your investment strategy, optimize pricing, and maximize your vacation rental profits.
Explore Advanced MetricsOver Dråby Strand Short-Term Rental Market Composition (2026): Property & Room Types
Room Type Distribution
Property Type Distribution
Market Composition Insights for Over Dråby Strand
- The Over Dråby Strand Airbnb market composition is heavily skewed towards Entire Home/Apt listings, which make up 100% of the 19 active rentals. This indicates strong guest preference for privacy and space.
- Looking at the property type distribution in Over Dråby Strand, House properties are the most common (73.7%), reflecting the local real estate landscape.
- Houses represent a significant 73.7% portion, catering likely to families or larger groups.
- The presence of 5.3% Hotel/Boutique listings indicates integration with traditional hospitality.
Over Dråby Strand Airbnb Room Capacity Analysis (2026): Bedroom Distribution
Distribution of Listings by Number of Bedrooms
Room Capacity Insights for Over Dråby Strand
- The dominant room capacity in Over Dråby Strand is 2 bedrooms listings, making up 47.4% of the market. This suggests a strong demand for properties suitable for couples or solo travelers.
- Together, 2 bedrooms and 3 bedrooms properties represent 73.7% of the active Airbnb listings in Over Dråby Strand, indicating a high concentration in these sizes.
- A significant 42.1% of listings offer 3+ bedrooms, catering to larger groups and families seeking more space in Over Dråby Strand.
Over Dråby Strand Vacation Rental Guest Capacity Trends (2026)
Distribution of Listings by Guest Capacity
Guest Capacity Insights for Over Dråby Strand
- The most common guest capacity trend in Over Dråby Strand vacation rentals is listings accommodating 6 guests (42.1%). This suggests the primary traveler segment is likely larger groups.
- Properties designed for 6 guests and 4 guests dominate the Over Dråby Strand STR market, accounting for 73.7% of listings.
- 63.2% of properties accommodate 6+ guests, serving the market segment for larger families or group travel in Over Dråby Strand.
- On average, properties in Over Dråby Strand are equipped to host 5.6 guests.
Over Dråby Strand Airbnb Booking Patterns (2026): Available vs. Booked Days
Available Days Distribution
Booked Days Distribution
Booking Pattern Insights for Over Dråby Strand
- The most common availability pattern in Over Dråby Strand falls within the 181-270 days range, representing 42.1% of listings. This suggests many properties have significant open periods on their calendars.
- Approximately 73.7% of listings show high availability (181+ days open annually), indicating potential for increased bookings or specific owner usage patterns.
- For booked days, the 91-180 days range is most frequent in Over Dråby Strand (42.1%), reflecting common guest stay durations or potential owner blocking patterns.
- A notable 26.4% of properties secure long booking periods (181+ days booked per year), highlighting successful long-term rental strategies or significant owner usage.
Over Dråby Strand Airbnb Minimum Stay Requirements Analysis
Distribution of Listings by Minimum Night Requirement
1 Night
2 listings
10.5% of total
2 Nights
2 listings
10.5% of total
3 Nights
2 listings
10.5% of total
4-6 Nights
3 listings
15.8% of total
30+ Nights
10 listings
52.6% of total
Key Insights
- The most prevalent minimum stay requirement in Over Dråby Strand is 30+ Nights, adopted by 52.6% of listings. This highlights the market's preference for longer commitments.
- A significant segment (52.6%) caters to monthly stays (30+ nights) in Over Dråby Strand, pointing to opportunities in the extended-stay market.
Recommendations
- Align with the market by considering a 30+ Nights minimum stay, as 52.6% of Over Dråby Strand hosts use this setting.
- If feasible, allowing 1-night stays, especially midweek or during low season, could capture last-minute bookings, as only 10.5% currently do.
- Explore offering discounts for stays of 30+ nights to attract the 52.6% of the market seeking extended stays.
- Adjust minimum nights based on seasonality – potentially shorter during low season and longer during peak demand periods in Over Dråby Strand.
Over Dråby Strand Airbnb Cancellation Policy Trends Analysis (2026)
Flexible
4 listings
21.1% of total
Moderate
5 listings
26.3% of total
Firm
6 listings
31.6% of total
Strict
4 listings
21.1% of total
Cancellation Policy Insights for Over Dråby Strand
- The prevailing Airbnb cancellation policy trend in Over Dråby Strand is Firm, used by 31.6% of listings.
- A majority (52.7%) of hosts in Over Dråby Strand utilize Firm or Strict policies, indicating a market where hosts prioritize booking security.
Recommendations for Hosts
- Consider adopting a Firm policy to align with the 31.6% market standard in Over Dråby Strand.
- Regularly review your cancellation policy against competitors and market demand shifts in Over Dråby Strand.
Over Dråby Strand STR Booking Lead Time Analysis (2026)
Average Booking Lead Time by Month
Booking Lead Time Insights for Over Dråby Strand
- The overall average booking lead time for vacation rentals in Over Dråby Strand is 57 days.
- Guests book furthest in advance for stays during August (average 96 days), likely coinciding with peak travel demand or local events.
- The shortest booking windows occur for stays in January (average 2 days), indicating more last-minute travel plans during this time.
- Seasonally, Summer (84 days avg.) sees the longest lead times, while Fall (30 days avg.) has the shortest, reflecting typical travel planning cycles.
Recommendations for Hosts
- Use the overall average lead time (57 days) as a baseline for your pricing and availability strategy in Over Dråby Strand.
- For August stays, consider implementing length-of-stay discounts or slightly higher rates for bookings made less than 96 days out to capitalize on advance planning.
- During January, focus on last-minute booking availability and promotions, as guests book with very short notice (2 days avg.).
- Target marketing efforts for the Summer season well in advance (at least 84 days) to capture early planners.
- Monitor your own booking lead times against these Over Dråby Strand averages to identify opportunities for dynamic pricing adjustments.
Popular & Essential Airbnb Amenities in Over Dråby Strand (2026)
Amenity Prevalence
Amenity Insights for Over Dråby Strand
- Popular amenities like TV, Kitchen, Heating are common but not universal. Offering these can provide a competitive edge.
- Warning: Wifi is not universally provided but is considered essential globally. Ensure reliable Wifi is offered.
Recommendations for Hosts
- Consider adding popular differentiators like TV or Kitchen to increase appeal.
- Highlight unique or less common amenities you offer (e.g., hot tub, dedicated workspace, EV charger) in your listing description and photos.
- Regularly check competitor amenities in Over Dråby Strand to stay competitive.
Over Dråby Strand Airbnb Guest Demographics & Profile Analysis (2026)
Guest Profile Summary for Over Dråby Strand
- The typical guest profile for Airbnb in Over Dråby Strand consists of a mix of domestic (40%) and international guests, with top international origins including Germany, typically belonging to the Post-2000s (Gen Z/Alpha) group (50%), primarily speaking English or German.
- Domestic travelers account for 40.2% of guests.
- Key international markets include Denmark (40.2%) and Germany (28%).
- Top languages spoken are English (37.7%) followed by German (19.5%).
- A significant demographic segment is the Post-2000s (Gen Z/Alpha) group, representing 50% of guests.
Recommendations for Hosts
- Balance marketing efforts between domestic and international channels based on the guest mix.
- Tailor amenities and listing descriptions to appeal to the dominant Post-2000s (Gen Z/Alpha) demographic (e.g., highlight fast WiFi, smart home features, local guides).
- Highlight unique local experiences or amenities relevant to the primary guest profile.
- Consider seasonal promotions aligned with peak travel times for key origin markets.
Nearby Short-Term Rental Market Comparison
How does the Over Dråby Strand Airbnb market stack up against its neighbors? Compare key performance metrics like average monthly revenue, ADR, and occupancy rates in surrounding areas to understand the broader regional STR landscape.
| Market | Active Properties | Monthly Revenue | Daily Rate | Avg. Occupancy |
|---|---|---|---|---|
| Wittenbeck | 14 | $2,937 | $224.34 | 43% |
| Lohals | 20 | $2,866 | $331.99 | 40% |
| Copenhagen | 9,111 | $2,347 | $222.94 | 52% |
| Bissee | 13 | $2,338 | $180.13 | 48% |
| Råbylille Strand | 31 | $2,254 | $190.70 | 45% |
| Saunte | 10 | $2,212 | $213.23 | 46% |
| Rude Strand | 27 | $2,198 | $254.15 | 41% |
| Korshavn | 14 | $2,192 | $244.24 | 41% |
| Tørresø Strand | 26 | $2,145 | $235.54 | 42% |
| Harmsdorf | 10 | $2,076 | $326.10 | 36% |