Stenstrup Airbnb Market Analysis 2025: Short Term Rental Data & Vacation Rental Statistics in Capital Region of Denmark, Denmark
Is Airbnb profitable in Stenstrup in 2025? Explore comprehensive Airbnb analytics for Stenstrup, Capital Region of Denmark, Denmark to uncover income potential. This 2025 STR market report for Stenstrup, based on AirROI data from October 2024 to September 2025, reveals key trends in the niche market of 18 active listings.
Whether you're considering an Airbnb investment in Stenstrup, optimizing your existing vacation rental, or exploring rental arbitrage opportunities, understanding the Stenstrup Airbnb data is crucial. Leveraging the low regulation environment is key to maximizing your short term rental income potential. Let's dive into the specifics.
Key Stenstrup Airbnb Performance Metrics Overview
Monthly Airbnb Revenue Variations & Income Potential in Stenstrup (2025)
Understanding the monthly revenue variations for Airbnb listings in Stenstrup is key to maximizing your short term rental income potential. Seasonality significantly impacts earnings. Our analysis, based on data from the past 12 months, shows that the peak revenue month for STRs in Stenstrup is typically July, while April often presents the lowest earnings, highlighting opportunities for strategic pricing adjustments during shoulder and low seasons. Explore the typical Airbnb income in Stenstrup across different performance tiers:
- Best-in-class properties (Top 10%) achieve $2,966+ monthly, often utilizing dynamic pricing and superior guest experiences.
- Strong performing properties (Top 25%) earn $1,861 or more, indicating effective management and desirable locations/amenities.
- Typical properties (Median) generate around $1,038 per month, representing the average market performance.
- Entry-level properties (Bottom 25%) see earnings around $573, often with potential for optimization.
Average Monthly Airbnb Earnings Trend in Stenstrup
Stenstrup Airbnb Occupancy Rate Trends (2025)
Maximize your bookings by understanding the Stenstrup STR occupancy trends. Seasonal demand shifts significantly influence how often properties are booked. Typically, Augustsees the highest demand (peak season occupancy), while January experiences the lowest (low season). Effective strategies, like adjusting minimum stays or offering promotions, can boost occupancy during slower periods. Here's how different property tiers perform in Stenstrup:
- Best-in-class properties (Top 10%) achieve 67%+ occupancy, indicating high desirability and potentially optimized availability.
- Strong performing properties (Top 25%) maintain 43% or higher occupancy, suggesting good market fit and guest satisfaction.
- Typical properties (Median) have an occupancy rate around 29%.
- Entry-level properties (Bottom 25%) average 14% occupancy, potentially facing higher vacancy.
Average Monthly Occupancy Rate Trend in Stenstrup
Average Daily Rate (ADR) Airbnb Trends in Stenstrup (2025)
Effective short term rental pricing strategy in Stenstrup involves understanding monthly ADR fluctuations. The Average Daily Rate (ADR) for Airbnb in Stenstrup typically peaks in July and dips lowest during April. Leveraging Airbnb dynamic pricing tools or strategies based on this seasonality can significantly boost revenue. Here's a look at the typical nightly rates achieved:
- Best-in-class properties (Top 10%) command rates of $370+ per night, often due to premium features or locations.
- Strong performing properties (Top 25%) achieve nightly rates of $224 or more.
- Typical properties (Median) charge around $153 per night.
- Entry-level properties (Bottom 25%) earn around $97 per night.
Average Daily Rate (ADR) Trend by Month in Stenstrup
Get Live Stenstrup Market Intelligence 👇

Explore Real-time Analytics
Airbnb Seasonality Analysis & Trends in Stenstrup (2025)
Peak Season (July, August, June)
- Revenue averages $3,194 per month
- Occupancy rates average 53.0%
- Daily rates average $201
Shoulder Season
- Revenue averages $896 per month
- Occupancy maintains around 25.9%
- Daily rates hold near $186
Low Season (March, April, May)
- Revenue drops to average $572 per month
- Occupancy decreases to average 22.5%
- Daily rates adjust to average $180
Seasonality Insights for Stenstrup
- The Airbnb seasonality in Stenstrup shows highly seasonal trends requiring careful strategy. While the sections above show seasonal averages, it's also insightful to look at the extremes:
- During the high season, the absolute peak month showcases Stenstrup's highest earning potential, with monthly revenues capable of climbing to $3,582, occupancy reaching a high of 59.2%, and ADRs peaking at $207.
- Conversely, the slowest single month of the year, typically falling within the low season, marks the market's lowest point. In this month, revenue might dip to $503, occupancy could drop to 19.4%, and ADRs may adjust down to $171.
- Understanding both the seasonal averages and these monthly peaks and troughs in revenue, occupancy, and ADR is crucial for maximizing your Airbnb profit potential in Stenstrup.
Seasonal Strategies for Maximizing Profit
- Peak Season: Maximize revenue through premium pricing and potentially longer minimum stays. Ensure high availability.
- Low Season: Offer competitive pricing, special promotions (e.g., extended stay discounts), and flexible cancellation policies. Target off-season travelers like remote workers or budget-conscious guests.
- Shoulder Seasons: Implement dynamic pricing that balances peak and low rates. Target weekend travelers or specific events. Offer slightly more flexible terms than peak season.
- Regularly analyze your own performance against these Stenstrup seasonality benchmarks and adjust your pricing and availability strategy accordingly.
Best Areas for Airbnb Investment in Stenstrup (2025)
Exploring the top neighborhoods for short-term rentals in Stenstrup? This section highlights key areas, outlining why they are attractive for hosts and guests, along with notable local attractions. Consider these locations based on your target guest profile and investment strategy.
| Neighborhood / Area | Why Host Here? (Target Guests & Appeal) | Key Attractions & Landmarks |
|---|---|---|
| Stenstrup Town Center | The heart of Stenstrup with historic charm and local amenities. Attracts travelers looking for a quaint Danish town experience with easy access to local attractions. | Stenstrup Church, Local cafes and bakeries, Biking trails, Nearby parks, Community events |
| Nearby Nature Areas | Stenstrup is close to various beautiful natural landscapes, ideal for outdoor enthusiasts and nature lovers. Offers a peaceful retreat for visitors seeking relaxation in nature. | Stenstrup Forest, Hiking trails, Bird watching, Picnic spots, Scenic views |
| Cultural Sites of Funen | Proximity to Funen's cultural heritage and attractions makes it appealing. Guests can explore Danish history and culture, enriching their stay. | Egeskov Castle, The Danish Railway Museum, Funen Art Museum, Region of South Funen, Odense Zoo |
| Proximity to Odense | Just a short drive to Odense, the third-largest city in Denmark. Visitors benefit from its urban attractions while enjoying the tranquility of Stenstrup. | Hans Christian Andersen Museum, Odense City, Odense River, Shopping districts, Local eateries |
| Culinary Experiences | Stenstrup and its surroundings offer unique Danish culinary experiences, appealing to foodies. Authentic dining options can attract culinary tourists. | Local farms, Danish cuisine restaurants, Food festivals, Wine tastings, Farmers markets |
| Tourist-Friendly Amenities | Stenstrup has developed amenities to welcome tourists, making it easier for visitors to find comfortable accommodations and services. | Guesthouses, Local guides, Transport links, Tourist information center, Local entertainment |
| Family-Friendly Activities | Stenstrup offers various family-friendly activities and attractions which appeal to families looking for a vacation spot that caters to children. | Playgrounds, Family parks, Adventure parks, Educational tours, Local festivals |
| Historical Landmarks | The area is rich in history, which attracts history buffs and those interested in exploring Denmark’s heritage and landmarks. | Historical buildings, Monuments, War memorials, Guided history tours, Cultural festivals |
Understanding Airbnb License Requirements & STR Laws in Stenstrup (2025)
While Stenstrup, Capital Region of Denmark, Denmark currently shows low STR regulations, specific Airbnb license requirements might still exist or change. Always verify the latest short term rental regulations and Airbnb license requirements directly with local government authorities for Stenstrup to ensure full compliance before hosting.
(Source: AirROI data, 2025, finding no licensed listings among those analyzed)
Top Performing Airbnb Properties in Stenstrup (2025)
Benchmark your potential! Explore examples of top-performing Airbnb properties in Stenstrupbased on Trailing Twelve Month (TTM) revenue. Analyze their characteristics, revenue, occupancy rate, and ADR to understand what drives success in this market.
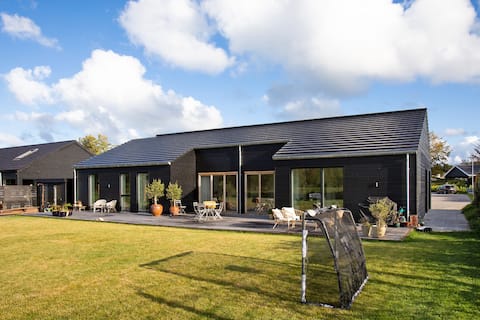
House near the forest and beach
Entire Place • 4 bedrooms
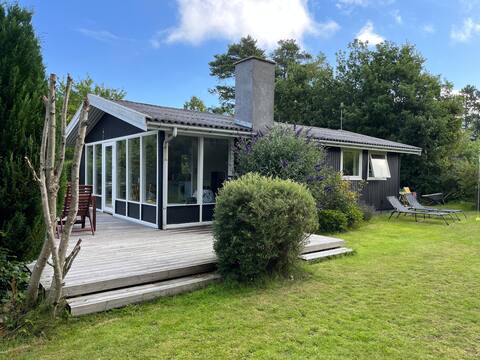
Family-friendly and Charming Cottage in Hornbæk
Entire Place • 3 bedrooms

Cozy guesthouse 1km from beach
Entire Place • 1 bedroom

Cozy family home near forest and beach
Entire Place • 3 bedrooms
Mælkevejen 12
Entire Place • 3 bedrooms
Small gem with a large sunny garden
Entire Place • 2 bedrooms
Note: Performance varies based on location, size, amenities, seasonality, and management quality. Data reflects the past 12 months.
Top Performing Airbnb Hosts in Stenstrup (2025)
Learn from the best! This table showcases top-performing Airbnb hosts in Stenstrup based on the number of properties managed and estimated total revenue over the past year. Analyze their scale and performance metrics.
| Host Name | Properties | Grossing Revenue | Stay Reviews | Avg Rating |
|---|---|---|---|---|
| Emil | 1 | $28,840 | 2 | Not Rated |
| Maja | 1 | $17,733 | 7 | 4.71/5.0 |
| Leonardo | 1 | $16,874 | 50 | 4.86/5.0 |
| Nanna Og Martin | 1 | $15,711 | 7 | 4.86/5.0 |
| Peter | 1 | $14,733 | 15 | 4.80/5.0 |
| Amalie | 1 | $14,119 | 2 | Not Rated |
| Tina | 1 | $12,580 | 8 | 5.00/5.0 |
| Andreas | 1 | $11,833 | 7 | 4.86/5.0 |
| Jesper | 1 | $11,020 | 73 | 4.86/5.0 |
| Niels Henrik | 1 | $9,526 | 32 | 4.63/5.0 |
Analyzing the strategies of top hosts, such as their property selection, pricing, and guest communication, can offer valuable lessons for optimizing your own Airbnb operations in Stenstrup.
Dive Deeper: Advanced Stenstrup STR Market Data (2025)
Ready to unlock more insights? AirROI provides access to advanced metrics and comprehensive Airbnb data for Stenstrup. Explore detailed analytics beyond this report to refine your investment strategy, optimize pricing, and maximize your vacation rental profits.
Explore Advanced MetricsStenstrup Short-Term Rental Market Composition (2025): Property & Room Types
Room Type Distribution
Property Type Distribution
Market Composition Insights for Stenstrup
- The Stenstrup Airbnb market composition is heavily skewed towards Entire Home/Apt listings, which make up 88.9% of the 18 active rentals. This indicates strong guest preference for privacy and space.
- Looking at the property type distribution in Stenstrup, House properties are the most common (61.1%), reflecting the local real estate landscape.
- Houses represent a significant 61.1% portion, catering likely to families or larger groups.
- The presence of 22.2% Hotel/Boutique listings indicates integration with traditional hospitality.
Stenstrup Airbnb Room Capacity Analysis (2025): Bedroom Distribution
Distribution of Listings by Number of Bedrooms
Room Capacity Insights for Stenstrup
- The dominant room capacity in Stenstrup is 3 bedrooms listings, making up 27.8% of the market. This suggests a strong demand for properties suitable for families or small groups.
- Together, 3 bedrooms and 1 bedroom properties represent 50.0% of the active Airbnb listings in Stenstrup, indicating a high concentration in these sizes.
- A significant 44.5% of listings offer 3+ bedrooms, catering to larger groups and families seeking more space in Stenstrup.
Stenstrup Vacation Rental Guest Capacity Trends (2025)
Distribution of Listings by Guest Capacity
Guest Capacity Insights for Stenstrup
- The most common guest capacity trend in Stenstrup vacation rentals is listings accommodating 4 guests (27.8%). This suggests the primary traveler segment is likely small families or groups.
- Properties designed for 4 guests and 2 guests dominate the Stenstrup STR market, accounting for 50.0% of listings.
- 33.3% of properties accommodate 6+ guests, serving the market segment for larger families or group travel in Stenstrup.
- On average, properties in Stenstrup are equipped to host 4.2 guests.
Stenstrup Airbnb Booking Patterns (2025): Available vs. Booked Days
Available Days Distribution
Booked Days Distribution
Booking Pattern Insights for Stenstrup
- The most common availability pattern in Stenstrup falls within the 271-366 days range, representing 88.9% of listings. This suggests many properties have significant open periods on their calendars.
- Approximately 100.0% of listings show high availability (181+ days open annually), indicating potential for increased bookings or specific owner usage patterns.
- For booked days, the 31-90 days range is most frequent in Stenstrup (50%), reflecting common guest stay durations or potential owner blocking patterns.
Stenstrup Airbnb Minimum Stay Requirements Analysis
Distribution of Listings by Minimum Night Requirement
1 Night
5 listings
27.8% of total
2 Nights
4 listings
22.2% of total
3 Nights
1 listings
5.6% of total
4-6 Nights
6 listings
33.3% of total
30+ Nights
2 listings
11.1% of total
Key Insights
- The most prevalent minimum stay requirement in Stenstrup is 4-6 Nights, adopted by 33.3% of listings. This highlights the market's preference for longer commitments.
- A significant segment (11.1%) caters to monthly stays (30+ nights) in Stenstrup, pointing to opportunities in the extended-stay market.
Recommendations
- Align with the market by considering a 4-6 Nights minimum stay, as 33.3% of Stenstrup hosts use this setting.
- If feasible, allowing 1-night stays, especially midweek or during low season, could capture last-minute bookings, as only 27.8% currently do.
- Explore offering discounts for stays of 30+ nights to attract the 11.1% of the market seeking extended stays.
- Adjust minimum nights based on seasonality – potentially shorter during low season and longer during peak demand periods in Stenstrup.
Stenstrup Airbnb Cancellation Policy Trends Analysis (2025)
Flexible
5 listings
27.8% of total
Firm
10 listings
55.6% of total
Strict
3 listings
16.7% of total
Cancellation Policy Insights for Stenstrup
- The prevailing Airbnb cancellation policy trend in Stenstrup is Firm, used by 55.6% of listings.
- A majority (72.3%) of hosts in Stenstrup utilize Firm or Strict policies, indicating a market where hosts prioritize booking security.
Recommendations for Hosts
- Consider adopting a Firm policy to align with the 55.6% market standard in Stenstrup.
- Regularly review your cancellation policy against competitors and market demand shifts in Stenstrup.
Stenstrup STR Booking Lead Time Analysis (2025)
Average Booking Lead Time by Month
Booking Lead Time Insights for Stenstrup
- The overall average booking lead time for vacation rentals in Stenstrup is 50 days.
- Guests book furthest in advance for stays during July (average 72 days), likely coinciding with peak travel demand or local events.
- The shortest booking windows occur for stays in February (average 8 days), indicating more last-minute travel plans during this time.
- Seasonally, Summer (62 days avg.) sees the longest lead times, while Winter (24 days avg.) has the shortest, reflecting typical travel planning cycles.
Recommendations for Hosts
- Use the overall average lead time (50 days) as a baseline for your pricing and availability strategy in Stenstrup.
- For July stays, consider implementing length-of-stay discounts or slightly higher rates for bookings made less than 72 days out to capitalize on advance planning.
- During February, focus on last-minute booking availability and promotions, as guests book with very short notice (8 days avg.).
- Target marketing efforts for the Summer season well in advance (at least 62 days) to capture early planners.
- Monitor your own booking lead times against these Stenstrup averages to identify opportunities for dynamic pricing adjustments.
Popular & Essential Airbnb Amenities in Stenstrup (2025)
Amenity Prevalence
Amenity Insights for Stenstrup
- Popular amenities like Free parking on premises, Wifi, Kitchen are common but not universal. Offering these can provide a competitive edge.
- Warning: Wifi is not universally provided but is considered essential globally. Ensure reliable Wifi is offered.
Recommendations for Hosts
- Consider adding popular differentiators like Free parking on premises or Wifi to increase appeal.
- Highlight unique or less common amenities you offer (e.g., hot tub, dedicated workspace, EV charger) in your listing description and photos.
- Regularly check competitor amenities in Stenstrup to stay competitive.
Stenstrup Airbnb Guest Demographics & Profile Analysis (2025)
Guest Profile Summary for Stenstrup
- The typical guest profile for Airbnb in Stenstrup consists of a mix of domestic (49%) and international guests, with top international origins including Germany, typically belonging to the Post-2000s (Gen Z/Alpha) group (50%), primarily speaking English or Danish.
- Domestic travelers account for 49.2% of guests.
- Key international markets include Denmark (49.2%) and Germany (20.3%).
- Top languages spoken are English (34.6%) followed by Danish (16%).
- A significant demographic segment is the Post-2000s (Gen Z/Alpha) group, representing 50% of guests.
Recommendations for Hosts
- Balance marketing efforts between domestic and international channels based on the guest mix.
- Tailor amenities and listing descriptions to appeal to the dominant Post-2000s (Gen Z/Alpha) demographic (e.g., highlight fast WiFi, smart home features, local guides).
- Highlight unique local experiences or amenities relevant to the primary guest profile.
- Consider seasonal promotions aligned with peak travel times for key origin markets.
Nearby Short-Term Rental Market Comparison
How does the Stenstrup Airbnb market stack up against its neighbors? Compare key performance metrics like average monthly revenue, ADR, and occupancy rates in surrounding areas to understand the broader regional STR landscape.
| Market | Active Properties | Monthly Revenue | Daily Rate | Avg. Occupancy |
|---|---|---|---|---|
| Copenhagen | 9,759 | $2,189 | $211.20 | 50% |
| Lerums kommun | 35 | $2,132 | $265.18 | 45% |
| Laröd | 12 | $2,085 | $348.72 | 39% |
| Solrød Strand | 50 | $2,052 | $222.46 | 47% |
| Hestra | 16 | $2,048 | $190.00 | 41% |
| Stillinge Strand | 22 | $2,006 | $227.91 | 38% |
| Bollebygds kommun | 15 | $1,983 | $184.70 | 41% |
| Frederiksberg | 1,105 | $1,927 | $208.30 | 48% |
| Perstorps kommun | 14 | $1,916 | $156.39 | 49% |
| Gnosjö kommun | 22 | $1,904 | $162.92 | 43% |