Tejn Airbnb Market Analysis 2026: Short Term Rental Data & Vacation Rental Statistics in Capital Region of Denmark, Denmark
Is Airbnb profitable in Tejn in 2026? Explore comprehensive Airbnb analytics for Tejn, Capital Region of Denmark, Denmark to uncover income potential. This 2026 STR market report for Tejn, based on AirROI data from February 2025 to January 2026, reveals key trends in the niche market of 60 active listings.
Whether you're considering an Airbnb investment in Tejn, optimizing your existing vacation rental, or exploring rental arbitrage opportunities, understanding the Tejn Airbnb data is crucial. Leveraging the low regulation environment is key to maximizing your short term rental income potential. Let's dive into the specifics.
Key Tejn Airbnb Performance Metrics Overview
Monthly Airbnb Revenue Variations & Income Potential in Tejn (2026)
Understanding the monthly revenue variations for Airbnb listings in Tejn is key to maximizing your short term rental income potential. Seasonality significantly impacts earnings. Our analysis, based on data from the past 12 months, shows that the peak revenue month for STRs in Tejn is typically July, while January often presents the lowest earnings, highlighting opportunities for strategic pricing adjustments during shoulder and low seasons. Explore the typical Airbnb income in Tejn across different performance tiers:
- Best-in-class properties (Top 10%) achieve $6,953+ monthly, often utilizing dynamic pricing and superior guest experiences.
- Strong performing properties (Top 25%) earn $4,412 or more, indicating effective management and desirable locations/amenities.
- Typical properties (Median) generate around $2,606 per month, representing the average market performance.
- Entry-level properties (Bottom 25%) see earnings around $1,476, often with potential for optimization.
Average Monthly Airbnb Earnings Trend in Tejn
Tejn Airbnb Occupancy Rate Trends (2026)
Maximize your bookings by understanding the Tejn STR occupancy trends. Seasonal demand shifts significantly influence how often properties are booked. Typically, Julysees the highest demand (peak season occupancy), while January experiences the lowest (low season). Effective strategies, like adjusting minimum stays or offering promotions, can boost occupancy during slower periods. Here's how different property tiers perform in Tejn:
- Best-in-class properties (Top 10%) achieve 68%+ occupancy, indicating high desirability and potentially optimized availability.
- Strong performing properties (Top 25%) maintain 54% or higher occupancy, suggesting good market fit and guest satisfaction.
- Typical properties (Median) have an occupancy rate around 39%.
- Entry-level properties (Bottom 25%) average 23% occupancy, potentially facing higher vacancy.
Average Monthly Occupancy Rate Trend in Tejn
Average Daily Rate (ADR) Airbnb Trends in Tejn (2026)
Effective short term rental pricing strategy in Tejn involves understanding monthly ADR fluctuations. The Average Daily Rate (ADR) for Airbnb in Tejn typically peaks in June and dips lowest during February. Leveraging Airbnb dynamic pricing tools or strategies based on this seasonality can significantly boost revenue. Here's a look at the typical nightly rates achieved:
- Best-in-class properties (Top 10%) command rates of $528+ per night, often due to premium features or locations.
- Strong performing properties (Top 25%) achieve nightly rates of $332 or more.
- Typical properties (Median) charge around $196 per night.
- Entry-level properties (Bottom 25%) earn around $147 per night.
Average Daily Rate (ADR) Trend by Month in Tejn
Get Live Tejn Market Intelligence 👇

Explore Real-time Analytics
Airbnb Seasonality Analysis & Trends in Tejn (2026)
Peak Season (July, August, June)
- Revenue averages $5,353 per month
- Occupancy rates average 62.5%
- Daily rates average $278
Shoulder Season
- Revenue averages $3,233 per month
- Occupancy maintains around 36.7%
- Daily rates hold near $268
Low Season (January, February, November)
- Revenue drops to average $2,080 per month
- Occupancy decreases to average 26.9%
- Daily rates adjust to average $256
Seasonality Insights for Tejn
- The Airbnb seasonality in Tejn shows highly seasonal trends requiring careful strategy. While the sections above show seasonal averages, it's also insightful to look at the extremes:
- During the high season, the absolute peak month showcases Tejn's highest earning potential, with monthly revenues capable of climbing to $6,526, occupancy reaching a high of 71.5%, and ADRs peaking at $283.
- Conversely, the slowest single month of the year, typically falling within the low season, marks the market's lowest point. In this month, revenue might dip to $1,465, occupancy could drop to 20.8%, and ADRs may adjust down to $248.
- Understanding both the seasonal averages and these monthly peaks and troughs in revenue, occupancy, and ADR is crucial for maximizing your Airbnb profit potential in Tejn.
Seasonal Strategies for Maximizing Profit
- Peak Season: Maximize revenue through premium pricing and potentially longer minimum stays. Ensure high availability.
- Low Season: Offer competitive pricing, special promotions (e.g., extended stay discounts), and flexible cancellation policies. Target off-season travelers like remote workers or budget-conscious guests.
- Shoulder Seasons: Implement dynamic pricing that balances peak and low rates. Target weekend travelers or specific events. Offer slightly more flexible terms than peak season.
- Regularly analyze your own performance against these Tejn seasonality benchmarks and adjust your pricing and availability strategy accordingly.
Best Areas for Airbnb Investment in Tejn (2026)
Exploring the top neighborhoods for short-term rentals in Tejn? This section highlights key areas, outlining why they are attractive for hosts and guests, along with notable local attractions. Consider these locations based on your target guest profile and investment strategy.
| Neighborhood / Area | Why Host Here? (Target Guests & Appeal) | Key Attractions & Landmarks |
|---|---|---|
| Copenhagen City Center | The heart of Copenhagen, known for its vibrant atmosphere, historical landmarks, and access to shopping and dining. It’s a prime location for tourists looking to explore the city on foot. | Tivoli Gardens, Rosenborg Castle, Nyhavn, The Little Mermaid, Strøget shopping street |
| Vesterbro | A trendy district known for its hip cafes, bars, and the iconic Meatpacking District. Attracts younger travelers and is just a short walk from the city center. | Kødbyen (Meatpacking District), Vesterbro's cafés and bars, Copenhagen Zoo, Skydebanehaven park, Tivoli Gardens |
| Nørrebro | A culturally diverse area popular with young locals and creatives. Known for its parks, food scene, and nightlife, making it appealing for those looking for a unique experience. | Superkilen park, Assistens Cemetery, Nørrebrogade street, The Olive Tree, Café Dyrehaven |
| Frederiksberg | An affluent suburb known for its leafy streets, parks, and the Frederiksberg Palace. It offers a quieter stay while still being close to the city. | Frederiksberg Gardens, Copenhagen Zoo, Frederiksberg Palace, The Royal Danish School of Music, Café Wilder |
| Østerbro | A peaceful residential area with beautiful waterfronts and parks, ideal for families and travelers wanting to escape the hustle and bustle of the city center. | Fælledparken, The Little Mermaid, Søerne (The Lakes), Østerbrogade shopping street, Trianglen square |
| Amager | A growing area that combines urban living with nature. Close to the beach and great for those looking for a balance between city and leisure. | Amager Strandpark, Copenhagen Opera House, Christiania, The Blue Planet, Amager Bakke (CopenHill) |
| Christianshavn | A historic area with canals and a bohemian vibe, it attracts tourists wanting to explore unique shops, restaurants, and the famous Freetown Christiania. | Freetown Christiania, Church of Our Saviour, Nyhavn, The Royal Danish Opera House, Copenhagen Street Food |
| Sjælland | An area outside of Copenhagen, perfect for those seeking a more rural and scenic stay, while still being relatively close to the capital's attractions. | Roskilde Cathedral, Lejre Land of Legends, Celebration of Danish History, Lake Arresø, Tisvilde Beach |
Understanding Airbnb License Requirements & STR Laws in Tejn (2026)
While Tejn, Capital Region of Denmark, Denmark currently shows low STR regulations, specific Airbnb license requirements might still exist or change. Always verify the latest short term rental regulations and Airbnb license requirements directly with local government authorities for Tejn to ensure full compliance before hosting.
(Source: AirROI data, 2026, finding no licensed listings among those analyzed)
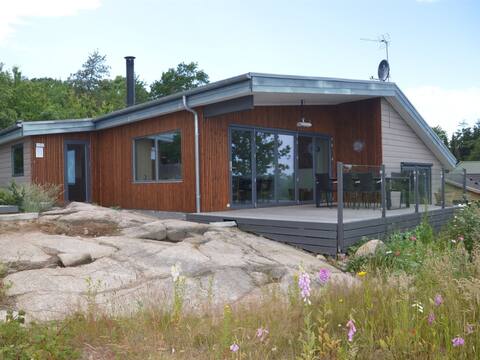
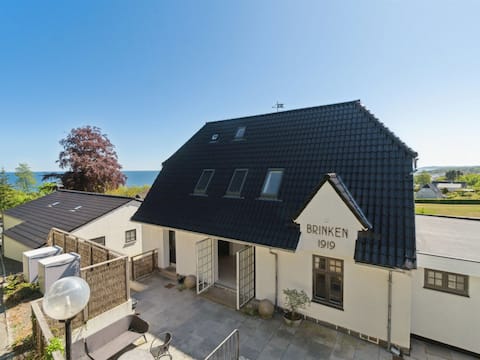
Top Performing Airbnb Properties in Tejn (2026)
Benchmark your potential! Explore examples of top-performing Airbnb properties in Tejnbased on Trailing Twelve Month (TTM) revenue. Analyze their characteristics, revenue, occupancy rate, and ADR to understand what drives success in this market.
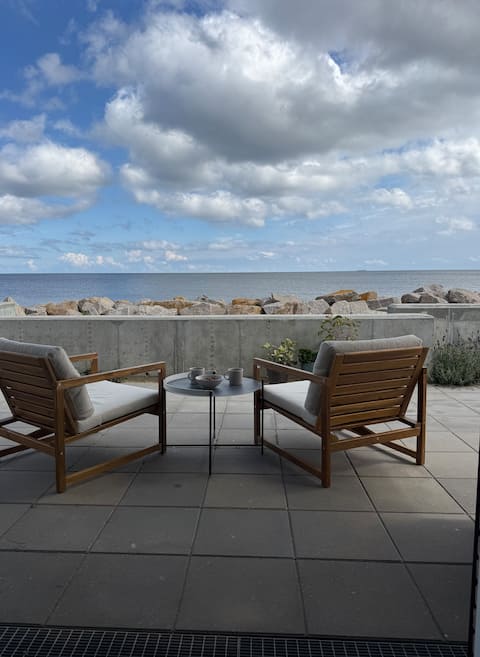
Luxury apartment on the waterfront
Entire Place • 2 bedrooms
"Seetje" - 200m from the sea by Interhome
Entire Place • 3 bedrooms
"Johanna" - 300m from the sea by Interhome
Entire Place • 6 bedrooms

Modern holiday home with exceptional sea views
Entire Place • 6 bedrooms
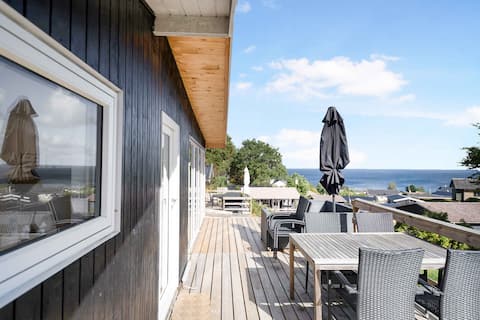
Beautifully situated summer house with sea view
Entire Place • 3 bedrooms

Modern holiday home with sea view in Tejn
Entire Place • 7 bedrooms
Note: Performance varies based on location, size, amenities, seasonality, and management quality. Data reflects the past 12 months.
Top Performing Airbnb Hosts in Tejn (2026)
Learn from the best! This table showcases top-performing Airbnb hosts in Tejn based on the number of properties managed and estimated total revenue over the past year. Analyze their scale and performance metrics.
| Host Name | Properties | Grossing Revenue | Stay Reviews | Avg Rating |
|---|---|---|---|---|
| Paulina - Interhome | 8 | $357,696 | 11 | Not Rated |
| Campaya | 4 | $188,461 | 18 | 4.82/5.0 |
| Annika - Interhome | 5 | $134,646 | 6 | Not Rated |
| Anders | 1 | $122,531 | 3 | 4.67/5.0 |
| Stine Hjorth | 2 | $58,337 | 69 | 4.96/5.0 |
| Mads Koch | 1 | $46,413 | 11 | 5.00/5.0 |
| Jesper | 1 | $46,071 | 18 | 4.94/5.0 |
| Christina | 2 | $45,756 | 211 | 4.53/5.0 |
| Ina | 1 | $38,701 | 124 | 4.92/5.0 |
| Jan | 1 | $35,349 | 39 | 4.87/5.0 |
Analyzing the strategies of top hosts, such as their property selection, pricing, and guest communication, can offer valuable lessons for optimizing your own Airbnb operations in Tejn.
Dive Deeper: Advanced Tejn STR Market Data (2026)
Ready to unlock more insights? AirROI provides access to advanced metrics and comprehensive Airbnb data for Tejn. Explore detailed analytics beyond this report to refine your investment strategy, optimize pricing, and maximize your vacation rental profits.
Explore Advanced MetricsTejn Short-Term Rental Market Composition (2026): Property & Room Types
Room Type Distribution
Property Type Distribution
Market Composition Insights for Tejn
- The Tejn Airbnb market composition is heavily skewed towards Entire Home/Apt listings, which make up 95% of the 60 active rentals. This indicates strong guest preference for privacy and space.
- Looking at the property type distribution in Tejn, House properties are the most common (66.7%), reflecting the local real estate landscape.
- Houses represent a significant 66.7% portion, catering likely to families or larger groups.
Tejn Airbnb Room Capacity Analysis (2026): Bedroom Distribution
Distribution of Listings by Number of Bedrooms
Room Capacity Insights for Tejn
- The dominant room capacity in Tejn is 3 bedrooms listings, making up 35% of the market. This suggests a strong demand for properties suitable for families or small groups.
- Together, 3 bedrooms and 2 bedrooms properties represent 61.7% of the active Airbnb listings in Tejn, indicating a high concentration in these sizes.
- A significant 53.3% of listings offer 3+ bedrooms, catering to larger groups and families seeking more space in Tejn.
Tejn Vacation Rental Guest Capacity Trends (2026)
Distribution of Listings by Guest Capacity
Guest Capacity Insights for Tejn
- The most common guest capacity trend in Tejn vacation rentals is listings accommodating 6 guests (35%). This suggests the primary traveler segment is likely larger groups.
- Properties designed for 6 guests and 4 guests dominate the Tejn STR market, accounting for 56.7% of listings.
- 55.0% of properties accommodate 6+ guests, serving the market segment for larger families or group travel in Tejn.
- On average, properties in Tejn are equipped to host 5.3 guests.
Tejn Airbnb Booking Patterns (2026): Available vs. Booked Days
Available Days Distribution
Booked Days Distribution
Booking Pattern Insights for Tejn
- The most common availability pattern in Tejn falls within the 271-366 days range, representing 50% of listings. This suggests many properties have significant open periods on their calendars.
- Approximately 93.3% of listings show high availability (181+ days open annually), indicating potential for increased bookings or specific owner usage patterns.
- For booked days, the 91-180 days range is most frequent in Tejn (43.3%), reflecting common guest stay durations or potential owner blocking patterns.
- A notable 6.7% of properties secure long booking periods (181+ days booked per year), highlighting successful long-term rental strategies or significant owner usage.
Tejn Airbnb Minimum Stay Requirements Analysis
Distribution of Listings by Minimum Night Requirement
1 Night
10 listings
16.7% of total
2 Nights
7 listings
11.7% of total
3 Nights
1 listings
1.7% of total
4-6 Nights
11 listings
18.3% of total
7-29 Nights
2 listings
3.3% of total
30+ Nights
29 listings
48.3% of total
Key Insights
- The most prevalent minimum stay requirement in Tejn is 30+ Nights, adopted by 48.3% of listings. This highlights the market's preference for longer commitments.
- A significant segment (48.3%) caters to monthly stays (30+ nights) in Tejn, pointing to opportunities in the extended-stay market.
Recommendations
- Align with the market by considering a 30+ Nights minimum stay, as 48.3% of Tejn hosts use this setting.
- If feasible, allowing 1-night stays, especially midweek or during low season, could capture last-minute bookings, as only 16.7% currently do.
- Explore offering discounts for stays of 30+ nights to attract the 48.3% of the market seeking extended stays.
- Adjust minimum nights based on seasonality – potentially shorter during low season and longer during peak demand periods in Tejn.
Tejn Airbnb Cancellation Policy Trends Analysis (2026)
Super Strict 30 Days
2 listings
3.3% of total
Flexible
3 listings
5% of total
Moderate
7 listings
11.7% of total
Firm
38 listings
63.3% of total
Strict
10 listings
16.7% of total
Cancellation Policy Insights for Tejn
- The prevailing Airbnb cancellation policy trend in Tejn is Firm, used by 63.3% of listings.
- A majority (80.0%) of hosts in Tejn utilize Firm or Strict policies, indicating a market where hosts prioritize booking security.
Recommendations for Hosts
- Consider adopting a Firm policy to align with the 63.3% market standard in Tejn.
- Regularly review your cancellation policy against competitors and market demand shifts in Tejn.
Tejn STR Booking Lead Time Analysis (2026)
Average Booking Lead Time by Month
Booking Lead Time Insights for Tejn
- The overall average booking lead time for vacation rentals in Tejn is 105 days.
- Guests book furthest in advance for stays during July (average 165 days), likely coinciding with peak travel demand or local events.
- The shortest booking windows occur for stays in February (average 25 days), indicating more last-minute travel plans during this time.
- Seasonally, Summer (149 days avg.) sees the longest lead times, while Winter (52 days avg.) has the shortest, reflecting typical travel planning cycles.
Recommendations for Hosts
- Use the overall average lead time (105 days) as a baseline for your pricing and availability strategy in Tejn.
- For July stays, consider implementing length-of-stay discounts or slightly higher rates for bookings made less than 165 days out to capitalize on advance planning.
- Target marketing efforts for the Summer season well in advance (at least 149 days) to capture early planners.
- Monitor your own booking lead times against these Tejn averages to identify opportunities for dynamic pricing adjustments.
Popular & Essential Airbnb Amenities in Tejn (2026)
Amenity Prevalence
Amenity Insights for Tejn
- Essential amenities in Tejn that guests expect include: Kitchen, Wifi. Lacking these (any) could significantly impact bookings.
- Popular amenities like Refrigerator, Heating, Dishes and silverware are common but not universal. Offering these can provide a competitive edge.
Recommendations for Hosts
- Ensure your listing includes all essential amenities for Tejn: Kitchen, Wifi.
- Prioritize adding missing essentials: Wifi.
- Consider adding popular differentiators like Refrigerator or Heating to increase appeal.
- Highlight unique or less common amenities you offer (e.g., hot tub, dedicated workspace, EV charger) in your listing description and photos.
- Regularly check competitor amenities in Tejn to stay competitive.
Tejn Airbnb Guest Demographics & Profile Analysis (2026)
Guest Profile Summary for Tejn
- The typical guest profile for Airbnb in Tejn consists of a mix of domestic (61%) and international guests, often arriving from nearby Copenhagen, typically belonging to the Post-2000s (Gen Z/Alpha) group (50%), primarily speaking English or Danish.
- Domestic travelers account for 61.3% of guests.
- Key international markets include Denmark (61.3%) and Germany (17.8%).
- Top languages spoken are English (39.9%) followed by Danish (24.7%).
- A significant demographic segment is the Post-2000s (Gen Z/Alpha) group, representing 50% of guests.
Recommendations for Hosts
- Target domestic marketing efforts towards travelers from Copenhagen and Berlin.
- Tailor amenities and listing descriptions to appeal to the dominant Post-2000s (Gen Z/Alpha) demographic (e.g., highlight fast WiFi, smart home features, local guides).
- Highlight unique local experiences or amenities relevant to the primary guest profile.
- Consider seasonal promotions aligned with peak travel times for key origin markets.
Nearby Short-Term Rental Market Comparison
How does the Tejn Airbnb market stack up against its neighbors? Compare key performance metrics like average monthly revenue, ADR, and occupancy rates in surrounding areas to understand the broader regional STR landscape.
| Market | Active Properties | Monthly Revenue | Daily Rate | Avg. Occupancy |
|---|---|---|---|---|
| Östra Göinge kommun | 10 | $2,138 | $216.64 | 45% |
| Perstorps kommun | 13 | $2,081 | $161.55 | 48% |
| Örkelljunga | 17 | $1,963 | $305.70 | 28% |
| Vellinge | 18 | $1,754 | $176.42 | 44% |
| Årsdale | 37 | $1,750 | $220.09 | 41% |
| Allinge-Sandvig | 88 | $1,711 | $235.69 | 39% |
| Klausdorf | 19 | $1,672 | $146.23 | 44% |
| Listed | 11 | $1,637 | $169.96 | 48% |
| Vittsjö | 20 | $1,636 | $188.66 | 40% |
| Rängs sand | 12 | $1,598 | $258.66 | 47% |