Vellerup Airbnb Market Analysis 2026: Short Term Rental Data & Vacation Rental Statistics in Capital Region of Denmark, Denmark
Is Airbnb profitable in Vellerup in 2026? Explore comprehensive Airbnb analytics for Vellerup, Capital Region of Denmark, Denmark to uncover income potential. This 2026 STR market report for Vellerup, based on AirROI data from February 2025 to January 2026, reveals key trends in the niche market of 19 active listings.
Whether you're considering an Airbnb investment in Vellerup, optimizing your existing vacation rental, or exploring rental arbitrage opportunities, understanding the Vellerup Airbnb data is crucial. Leveraging the low regulation environment is key to maximizing your short term rental income potential. Let's dive into the specifics.
Key Vellerup Airbnb Performance Metrics Overview
Monthly Airbnb Revenue Variations & Income Potential in Vellerup (2026)
Understanding the monthly revenue variations for Airbnb listings in Vellerup is key to maximizing your short term rental income potential. Seasonality significantly impacts earnings. Our analysis, based on data from the past 12 months, shows that the peak revenue month for STRs in Vellerup is typically July, while January often presents the lowest earnings, highlighting opportunities for strategic pricing adjustments during shoulder and low seasons. Explore the typical Airbnb income in Vellerup across different performance tiers:
- Best-in-class properties (Top 10%) achieve $3,677+ monthly, often utilizing dynamic pricing and superior guest experiences.
- Strong performing properties (Top 25%) earn $2,693 or more, indicating effective management and desirable locations/amenities.
- Typical properties (Median) generate around $1,664 per month, representing the average market performance.
- Entry-level properties (Bottom 25%) see earnings around $1,037, often with potential for optimization.
Average Monthly Airbnb Earnings Trend in Vellerup
Vellerup Airbnb Occupancy Rate Trends (2026)
Maximize your bookings by understanding the Vellerup STR occupancy trends. Seasonal demand shifts significantly influence how often properties are booked. Typically, Julysees the highest demand (peak season occupancy), while January experiences the lowest (low season). Effective strategies, like adjusting minimum stays or offering promotions, can boost occupancy during slower periods. Here's how different property tiers perform in Vellerup:
- Best-in-class properties (Top 10%) achieve 75%+ occupancy, indicating high desirability and potentially optimized availability.
- Strong performing properties (Top 25%) maintain 61% or higher occupancy, suggesting good market fit and guest satisfaction.
- Typical properties (Median) have an occupancy rate around 39%.
- Entry-level properties (Bottom 25%) average 20% occupancy, potentially facing higher vacancy.
Average Monthly Occupancy Rate Trend in Vellerup
Average Daily Rate (ADR) Airbnb Trends in Vellerup (2026)
Effective short term rental pricing strategy in Vellerup involves understanding monthly ADR fluctuations. The Average Daily Rate (ADR) for Airbnb in Vellerup typically peaks in December and dips lowest during March. Leveraging Airbnb dynamic pricing tools or strategies based on this seasonality can significantly boost revenue. Here's a look at the typical nightly rates achieved:
- Best-in-class properties (Top 10%) command rates of $268+ per night, often due to premium features or locations.
- Strong performing properties (Top 25%) achieve nightly rates of $191 or more.
- Typical properties (Median) charge around $141 per night.
- Entry-level properties (Bottom 25%) earn around $107 per night.
Average Daily Rate (ADR) Trend by Month in Vellerup
Get Live Vellerup Market Intelligence 👇

Explore Real-time Analytics
Airbnb Seasonality Analysis & Trends in Vellerup (2026)
Peak Season (July, August, September)
- Revenue averages $3,110 per month
- Occupancy rates average 53.6%
- Daily rates average $170
Shoulder Season
- Revenue averages $1,710 per month
- Occupancy maintains around 39.9%
- Daily rates hold near $168
Low Season (January, February, March)
- Revenue drops to average $1,118 per month
- Occupancy decreases to average 31.6%
- Daily rates adjust to average $158
Seasonality Insights for Vellerup
- The Airbnb seasonality in Vellerup shows highly seasonal trends requiring careful strategy. While the sections above show seasonal averages, it's also insightful to look at the extremes:
- During the high season, the absolute peak month showcases Vellerup's highest earning potential, with monthly revenues capable of climbing to $4,062, occupancy reaching a high of 67.3%, and ADRs peaking at $178.
- Conversely, the slowest single month of the year, typically falling within the low season, marks the market's lowest point. In this month, revenue might dip to $887, occupancy could drop to 16.1%, and ADRs may adjust down to $150.
- Understanding both the seasonal averages and these monthly peaks and troughs in revenue, occupancy, and ADR is crucial for maximizing your Airbnb profit potential in Vellerup.
Seasonal Strategies for Maximizing Profit
- Peak Season: Maximize revenue through premium pricing and potentially longer minimum stays. Ensure high availability.
- Low Season: Offer competitive pricing, special promotions (e.g., extended stay discounts), and flexible cancellation policies. Target off-season travelers like remote workers or budget-conscious guests.
- Shoulder Seasons: Implement dynamic pricing that balances peak and low rates. Target weekend travelers or specific events. Offer slightly more flexible terms than peak season.
- Regularly analyze your own performance against these Vellerup seasonality benchmarks and adjust your pricing and availability strategy accordingly.
Best Areas for Airbnb Investment in Vellerup (2026)
Exploring the top neighborhoods for short-term rentals in Vellerup? This section highlights key areas, outlining why they are attractive for hosts and guests, along with notable local attractions. Consider these locations based on your target guest profile and investment strategy.
| Neighborhood / Area | Why Host Here? (Target Guests & Appeal) | Key Attractions & Landmarks |
|---|---|---|
| Vellerup Beach | A scenic beach area perfect for summer getaways, with access to swimming, sunbathing, and beautiful natural surroundings. Attracts families and couples looking for a relaxing vacation by the water. | Vellerup Beach, Vellerup Holme, Beachfront cafes, Walking trails, Nature Parks |
| Vellerup Town Center | The charming town center offers local shops, restaurants, and community events. A great place for visitors wanting to experience Danish culture and everyday life. | Local restaurants, Cafes, Shops, Waterfront promenade, Community parks |
| Heverød | A peaceful residential area close to Vellerup, ideal for families and longer stays. Offers access to nature and quiet surroundings, attracting guests who prefer a more tranquil experience. | Nature reserves, Walking trails, Family-friendly parks, Local farms |
| Frederikssund | Nearby Frederikssund provides cultural heritage and history, appealing to visitors interested in Danish history and architecture. Regular events and a lively atmosphere add to its appeal. | Frederikssund Museum, Viking Ship Museum, Frederikssund Theatre, Cultural events, Historic buildings |
| Roskilde | Known for its historic sites, like the Roskilde Cathedral and Viking Ship Museum, Roskilde attracts many tourists. Offers a mix of culture, history, and scenic waterfront views. | Roskilde Cathedral, Viking Ship Museum, Roskilde Festival grounds, Roskilde Harbor, Cafes and restaurants |
| Skibby | A small town with a cozy atmosphere, nature close by, and proximity to water activities. Perfect for those looking for a rural retreat, with opportunities for cycling and hiking. | Kongernes Nordsjælland National Park, Local markets, Cycling routes, Hiking trails |
| Boreholmen | This area provides a tranquil setting with access to beautiful nature and nearby lakes. Ideal for guests seeking peace and outdoor activities like fishing and hiking. | Lakes, Nature trails, Fishing spots, Local fauna |
| Jægerspris | A historic town known for Jægerspris Castle and surrounding nature. A great spot for visitors interested in history, combined with beautiful parks and lakes. | Jægerspris Castle, Bird sanctuary, Gribskov Forest, Local art galleries, Parks and picnic areas |
Understanding Airbnb License Requirements & STR Laws in Vellerup (2026)
While Vellerup, Capital Region of Denmark, Denmark currently shows low STR regulations, specific Airbnb license requirements might still exist or change. Always verify the latest short term rental regulations and Airbnb license requirements directly with local government authorities for Vellerup to ensure full compliance before hosting.
(Source: AirROI data, 2026, finding no licensed listings among those analyzed)
Top Performing Airbnb Properties in Vellerup (2026)
Benchmark your potential! Explore examples of top-performing Airbnb properties in Vellerupbased on Trailing Twelve Month (TTM) revenue. Analyze their characteristics, revenue, occupancy rate, and ADR to understand what drives success in this market.
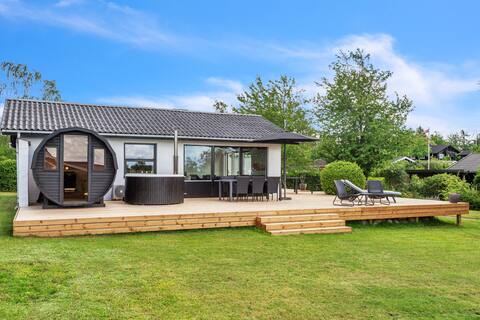
Sauna | Wilderness Bath | Fjord View
Entire Place • 2 bedrooms
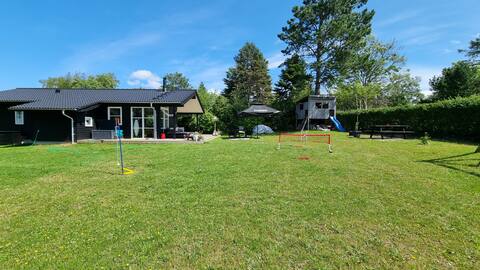
Family country house near sea
Entire Place • 3 bedrooms
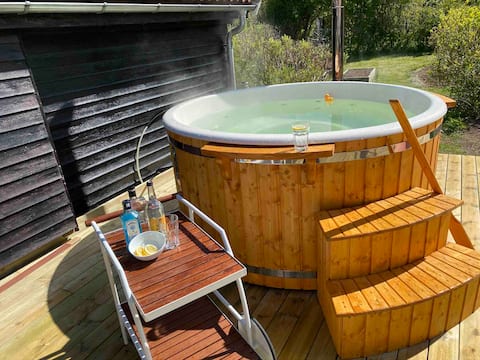
Cozy summer house only 40 minutes from Copenhagen. - NEW SPA
Entire Place • 3 bedrooms
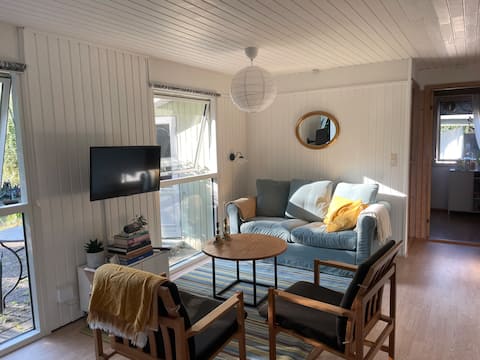
Fantastic summer house by Isefjorden
Entire Place • 4 bedrooms
Cozy timber house
Entire Place • 3 bedrooms

The wooden house in Vikingeland
Entire Place • 3 bedrooms
Note: Performance varies based on location, size, amenities, seasonality, and management quality. Data reflects the past 12 months.
Top Performing Airbnb Hosts in Vellerup (2026)
Learn from the best! This table showcases top-performing Airbnb hosts in Vellerup based on the number of properties managed and estimated total revenue over the past year. Analyze their scale and performance metrics.
| Host Name | Properties | Grossing Revenue | Stay Reviews | Avg Rating |
|---|---|---|---|---|
| Lærke | 1 | $40,396 | 77 | 4.84/5.0 |
| Henriette Og Jacob | 1 | $34,315 | 33 | 5.00/5.0 |
| Poul Arne | 1 | $30,764 | 162 | 4.77/5.0 |
| Hans | 2 | $28,402 | 36 | 4.90/5.0 |
| Asbjørn | 1 | $27,828 | 24 | 4.88/5.0 |
| Søren | 1 | $24,966 | 33 | 4.88/5.0 |
| Daniel | 1 | $21,245 | 72 | 4.81/5.0 |
| Jacob | 1 | $15,947 | 45 | 4.27/5.0 |
| Lise | 1 | $15,736 | 4 | 5.00/5.0 |
| Mehar | 1 | $13,432 | 16 | 4.94/5.0 |
Analyzing the strategies of top hosts, such as their property selection, pricing, and guest communication, can offer valuable lessons for optimizing your own Airbnb operations in Vellerup.
Dive Deeper: Advanced Vellerup STR Market Data (2026)
Ready to unlock more insights? AirROI provides access to advanced metrics and comprehensive Airbnb data for Vellerup. Explore detailed analytics beyond this report to refine your investment strategy, optimize pricing, and maximize your vacation rental profits.
Explore Advanced MetricsVellerup Short-Term Rental Market Composition (2026): Property & Room Types
Room Type Distribution
Property Type Distribution
Market Composition Insights for Vellerup
- The Vellerup Airbnb market composition is heavily skewed towards Entire Home/Apt listings, which make up 100% of the 19 active rentals. This indicates strong guest preference for privacy and space.
- Looking at the property type distribution in Vellerup, House properties are the most common (63.2%), reflecting the local real estate landscape.
- Houses represent a significant 63.2% portion, catering likely to families or larger groups.
- The presence of 5.3% Hotel/Boutique listings indicates integration with traditional hospitality.
Vellerup Airbnb Room Capacity Analysis (2026): Bedroom Distribution
Distribution of Listings by Number of Bedrooms
Room Capacity Insights for Vellerup
- The dominant room capacity in Vellerup is 2 bedrooms listings, making up 36.8% of the market. This suggests a strong demand for properties suitable for couples or solo travelers.
- Together, 2 bedrooms and 3 bedrooms properties represent 63.1% of the active Airbnb listings in Vellerup, indicating a high concentration in these sizes.
- A significant 52.6% of listings offer 3+ bedrooms, catering to larger groups and families seeking more space in Vellerup.
Vellerup Vacation Rental Guest Capacity Trends (2026)
Distribution of Listings by Guest Capacity
Guest Capacity Insights for Vellerup
- The most common guest capacity trend in Vellerup vacation rentals is listings accommodating 6 guests (31.6%). This suggests the primary traveler segment is likely larger groups.
- Properties designed for 6 guests and 8+ guests dominate the Vellerup STR market, accounting for 57.9% of listings.
- 63.2% of properties accommodate 6+ guests, serving the market segment for larger families or group travel in Vellerup.
- On average, properties in Vellerup are equipped to host 5.7 guests.
Vellerup Airbnb Booking Patterns (2026): Available vs. Booked Days
Available Days Distribution
Booked Days Distribution
Booking Pattern Insights for Vellerup
- The most common availability pattern in Vellerup falls within the 271-366 days range, representing 52.6% of listings. This suggests many properties have significant open periods on their calendars.
- Approximately 78.9% of listings show high availability (181+ days open annually), indicating potential for increased bookings or specific owner usage patterns.
- For booked days, the 31-90 days range is most frequent in Vellerup (31.6%), reflecting common guest stay durations or potential owner blocking patterns.
- A notable 21.1% of properties secure long booking periods (181+ days booked per year), highlighting successful long-term rental strategies or significant owner usage.
Vellerup Airbnb Minimum Stay Requirements Analysis
Distribution of Listings by Minimum Night Requirement
1 Night
1 listings
5.3% of total
2 Nights
5 listings
26.3% of total
3 Nights
1 listings
5.3% of total
4-6 Nights
5 listings
26.3% of total
7-29 Nights
2 listings
10.5% of total
30+ Nights
5 listings
26.3% of total
Key Insights
- The most prevalent minimum stay requirement in Vellerup is 2 Nights, adopted by 26.3% of listings. This highlights the market's preference for shorter, flexible bookings.
- A significant segment (26.3%) caters to monthly stays (30+ nights) in Vellerup, pointing to opportunities in the extended-stay market.
Recommendations
- Align with the market by considering a 2 Nights minimum stay, as 26.3% of Vellerup hosts use this setting.
- If feasible, allowing 1-night stays, especially midweek or during low season, could capture last-minute bookings, as only 5.3% currently do.
- Explore offering discounts for stays of 30+ nights to attract the 26.3% of the market seeking extended stays.
- Adjust minimum nights based on seasonality – potentially shorter during low season and longer during peak demand periods in Vellerup.
Vellerup Airbnb Cancellation Policy Trends Analysis (2026)
Limited
1 listings
5.3% of total
Flexible
3 listings
15.8% of total
Moderate
9 listings
47.4% of total
Firm
4 listings
21.1% of total
Strict
2 listings
10.5% of total
Cancellation Policy Insights for Vellerup
- The prevailing Airbnb cancellation policy trend in Vellerup is Moderate, used by 47.4% of listings.
- There's a relatively balanced mix between guest-friendly (63.2%) and stricter (31.6%) policies, offering choices for different guest needs.
Recommendations for Hosts
- Consider adopting a Moderate policy to align with the 47.4% market standard in Vellerup.
- Using a Strict policy might deter some guests, as only 10.5% of listings use it. Evaluate if potential revenue protection outweighs possible lower booking rates.
- Regularly review your cancellation policy against competitors and market demand shifts in Vellerup.
Vellerup STR Booking Lead Time Analysis (2026)
Average Booking Lead Time by Month
Booking Lead Time Insights for Vellerup
- The overall average booking lead time for vacation rentals in Vellerup is 59 days.
- Guests book furthest in advance for stays during August (average 77 days), likely coinciding with peak travel demand or local events.
- The shortest booking windows occur for stays in March (average 21 days), indicating more last-minute travel plans during this time.
- Seasonally, Summer (65 days avg.) sees the longest lead times, while Spring (35 days avg.) has the shortest, reflecting typical travel planning cycles.
Recommendations for Hosts
- Use the overall average lead time (59 days) as a baseline for your pricing and availability strategy in Vellerup.
- For August stays, consider implementing length-of-stay discounts or slightly higher rates for bookings made less than 77 days out to capitalize on advance planning.
- Target marketing efforts for the Summer season well in advance (at least 65 days) to capture early planners.
- Monitor your own booking lead times against these Vellerup averages to identify opportunities for dynamic pricing adjustments.
Popular & Essential Airbnb Amenities in Vellerup (2026)
Amenity Prevalence
Amenity Insights for Vellerup
- Essential amenities in Vellerup that guests expect include: Kitchen, Wifi. Lacking these (any) could significantly impact bookings.
- Popular amenities like Free parking on premises, Heating, Outdoor dining area are common but not universal. Offering these can provide a competitive edge.
Recommendations for Hosts
- Ensure your listing includes all essential amenities for Vellerup: Kitchen, Wifi.
- Consider adding popular differentiators like Free parking on premises or Heating to increase appeal.
- Highlight unique or less common amenities you offer (e.g., hot tub, dedicated workspace, EV charger) in your listing description and photos.
- Regularly check competitor amenities in Vellerup to stay competitive.
Vellerup Airbnb Guest Demographics & Profile Analysis (2026)
Guest Profile Summary for Vellerup
- The typical guest profile for Airbnb in Vellerup consists of a mix of domestic (39%) and international guests, with top international origins including Germany, typically belonging to the Post-2000s (Gen Z/Alpha) group (50%), primarily speaking English or German.
- Domestic travelers account for 38.8% of guests.
- Key international markets include Denmark (38.8%) and Germany (32%).
- Top languages spoken are English (38.4%) followed by German (20.8%).
- A significant demographic segment is the Post-2000s (Gen Z/Alpha) group, representing 50% of guests.
Recommendations for Hosts
- Focus marketing internationally, particularly towards travelers from Germany.
- Tailor amenities and listing descriptions to appeal to the dominant Post-2000s (Gen Z/Alpha) demographic (e.g., highlight fast WiFi, smart home features, local guides).
- Highlight unique local experiences or amenities relevant to the primary guest profile.
- Consider seasonal promotions aligned with peak travel times for key origin markets.
Nearby Short-Term Rental Market Comparison
How does the Vellerup Airbnb market stack up against its neighbors? Compare key performance metrics like average monthly revenue, ADR, and occupancy rates in surrounding areas to understand the broader regional STR landscape.
| Market | Active Properties | Monthly Revenue | Daily Rate | Avg. Occupancy |
|---|---|---|---|---|
| Wittenbeck | 14 | $2,937 | $224.34 | 43% |
| Lohals | 20 | $2,866 | $331.99 | 40% |
| Copenhagen | 9,111 | $2,347 | $222.94 | 52% |
| Bissee | 13 | $2,338 | $180.13 | 48% |
| Råbylille Strand | 31 | $2,254 | $190.70 | 45% |
| Saunte | 10 | $2,212 | $213.23 | 46% |
| Rude Strand | 27 | $2,198 | $254.15 | 41% |
| Korshavn | 14 | $2,192 | $244.24 | 41% |
| Tørresø Strand | 26 | $2,145 | $235.54 | 42% |
| Harmsdorf | 10 | $2,076 | $326.10 | 36% |