Østerlars Airbnb Market Analysis 2026: Short Term Rental Data & Vacation Rental Statistics in Capital Region of Denmark, Denmark
Is Airbnb profitable in Østerlars in 2026? Explore comprehensive Airbnb analytics for Østerlars, Capital Region of Denmark, Denmark to uncover income potential. This 2026 STR market report for Østerlars, based on AirROI data from February 2025 to January 2026, reveals key trends in the niche market of 18 active listings.
Whether you're considering an Airbnb investment in Østerlars, optimizing your existing vacation rental, or exploring rental arbitrage opportunities, understanding the Østerlars Airbnb data is crucial. Leveraging the low regulation environment is key to maximizing your short term rental income potential. Let's dive into the specifics.
Key Østerlars Airbnb Performance Metrics Overview
Monthly Airbnb Revenue Variations & Income Potential in Østerlars (2026)
Understanding the monthly revenue variations for Airbnb listings in Østerlars is key to maximizing your short term rental income potential. Seasonality significantly impacts earnings. Our analysis, based on data from the past 12 months, shows that the peak revenue month for STRs in Østerlars is typically July, while December often presents the lowest earnings, highlighting opportunities for strategic pricing adjustments during shoulder and low seasons. Explore the typical Airbnb income in Østerlars across different performance tiers:
- Best-in-class properties (Top 10%) achieve $4,627+ monthly, often utilizing dynamic pricing and superior guest experiences.
- Strong performing properties (Top 25%) earn $1,967 or more, indicating effective management and desirable locations/amenities.
- Typical properties (Median) generate around $1,135 per month, representing the average market performance.
- Entry-level properties (Bottom 25%) see earnings around $481, often with potential for optimization.
Average Monthly Airbnb Earnings Trend in Østerlars
Østerlars Airbnb Occupancy Rate Trends (2026)
Maximize your bookings by understanding the Østerlars STR occupancy trends. Seasonal demand shifts significantly influence how often properties are booked. Typically, Julysees the highest demand (peak season occupancy), while May experiences the lowest (low season). Effective strategies, like adjusting minimum stays or offering promotions, can boost occupancy during slower periods. Here's how different property tiers perform in Østerlars:
- Best-in-class properties (Top 10%) achieve 68%+ occupancy, indicating high desirability and potentially optimized availability.
- Strong performing properties (Top 25%) maintain 42% or higher occupancy, suggesting good market fit and guest satisfaction.
- Typical properties (Median) have an occupancy rate around 27%.
- Entry-level properties (Bottom 25%) average 13% occupancy, potentially facing higher vacancy.
Average Monthly Occupancy Rate Trend in Østerlars
Average Daily Rate (ADR) Airbnb Trends in Østerlars (2026)
Effective short term rental pricing strategy in Østerlars involves understanding monthly ADR fluctuations. The Average Daily Rate (ADR) for Airbnb in Østerlars typically peaks in January and dips lowest during March. Leveraging Airbnb dynamic pricing tools or strategies based on this seasonality can significantly boost revenue. Here's a look at the typical nightly rates achieved:
- Best-in-class properties (Top 10%) command rates of $240+ per night, often due to premium features or locations.
- Strong performing properties (Top 25%) achieve nightly rates of $170 or more.
- Typical properties (Median) charge around $128 per night.
- Entry-level properties (Bottom 25%) earn around $90 per night.
Average Daily Rate (ADR) Trend by Month in Østerlars
Get Live Østerlars Market Intelligence 👇

Explore Real-time Analytics
Airbnb Seasonality Analysis & Trends in Østerlars (2026)
Peak Season (July, August, September)
- Revenue averages $2,898 per month
- Occupancy rates average 49.5%
- Daily rates average $151
Shoulder Season
- Revenue averages $1,513 per month
- Occupancy maintains around 28.0%
- Daily rates hold near $137
Low Season (January, April, December)
- Revenue drops to average $826 per month
- Occupancy decreases to average 22.9%
- Daily rates adjust to average $148
Seasonality Insights for Østerlars
- The Airbnb seasonality in Østerlars shows highly seasonal trends requiring careful strategy. While the sections above show seasonal averages, it's also insightful to look at the extremes:
- During the high season, the absolute peak month showcases Østerlars's highest earning potential, with monthly revenues capable of climbing to $3,613, occupancy reaching a high of 60.1%, and ADRs peaking at $162.
- Conversely, the slowest single month of the year, typically falling within the low season, marks the market's lowest point. In this month, revenue might dip to $607, occupancy could drop to 16.9%, and ADRs may adjust down to $120.
- Understanding both the seasonal averages and these monthly peaks and troughs in revenue, occupancy, and ADR is crucial for maximizing your Airbnb profit potential in Østerlars.
Seasonal Strategies for Maximizing Profit
- Peak Season: Maximize revenue through premium pricing and potentially longer minimum stays. Ensure high availability.
- Low Season: Offer competitive pricing, special promotions (e.g., extended stay discounts), and flexible cancellation policies. Target off-season travelers like remote workers or budget-conscious guests.
- Shoulder Seasons: Implement dynamic pricing that balances peak and low rates. Target weekend travelers or specific events. Offer slightly more flexible terms than peak season.
- Regularly analyze your own performance against these Østerlars seasonality benchmarks and adjust your pricing and availability strategy accordingly.
Best Areas for Airbnb Investment in Østerlars (2026)
Exploring the top neighborhoods for short-term rentals in Østerlars? This section highlights key areas, outlining why they are attractive for hosts and guests, along with notable local attractions. Consider these locations based on your target guest profile and investment strategy.
| Neighborhood / Area | Why Host Here? (Target Guests & Appeal) | Key Attractions & Landmarks |
|---|---|---|
| Østerlars Church | Famous for being one of the round churches in Denmark, it attracts tourists interested in history and architecture. Its unique design and cultural significance make it a prime spot for visitors. | Østerlars Round Church, Local museums, Historic sites |
| Christiansø | A small island that is part of the Ertholmene archipelago, known for its beautiful nature and tranquility. Ideal for tourists looking to escape to nature and enjoy outdoor activities such as hiking and bird watching. | Beautiful coastal views, Historic buildings, Nature trails |
| Bornholm Coastal Path | Stunning natural scenery along the coastline, ideal for hiking and biking. Attracts nature lovers and adventurers wanting to explore Denmark's beautiful landscapes. | Stunning seaside views, Hiking and biking trails, Wildlife watching |
| Svaneke | Charming coastal town known for its artisan shops and local craft beer. A favorite for those seeking a cozy retreat with culture and local gastronomy. | Svaneke Brewery, Local artisan shops, Beautiful harbors |
| Rønne | The largest town on Bornholm, offering a mix of cultural activities, shopping, and seaside attractions. It serves as a hub for tourists wanting to explore the island. | Rønne Theatre, Bornholm Museum, Shopping areas |
| Hammershus | The largest medieval fortification in Northern Europe, it attracts history buffs and families. Visitors enjoy the scenic views and the historical tour. | Hammershus Castle ruins, Stunning cliff views, Historical exhibits |
| Dueodde Beach | Known for its soft, white sand and clear waters, it's a popular beach destination during the summer months, ideal for families and sunbathers. | Swimming and sunbathing, Beach cafes, Water sports |
| Klemensker | A rural area known for its tranquility and beautiful scenery, appealing to those looking for a peaceful getaway amidst nature and farms. | Countryside walks, Local farms, Scenic landscapes |
Understanding Airbnb License Requirements & STR Laws in Østerlars (2026)
While Østerlars, Capital Region of Denmark, Denmark currently shows low STR regulations, specific Airbnb license requirements might still exist or change. Always verify the latest short term rental regulations and Airbnb license requirements directly with local government authorities for Østerlars to ensure full compliance before hosting.
(Source: AirROI data, 2026, finding no licensed listings among those analyzed)
Top Performing Airbnb Properties in Østerlars (2026)
Benchmark your potential! Explore examples of top-performing Airbnb properties in Østerlarsbased on Trailing Twelve Month (TTM) revenue. Analyze their characteristics, revenue, occupancy rate, and ADR to understand what drives success in this market.

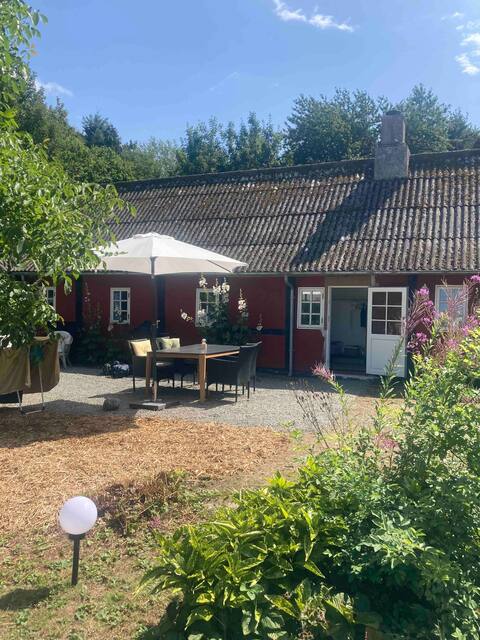
320 m2 Proprietary home on Lehnsgaard near Gudhjem
Entire Place • 9 bedrooms

Outside Gudhjem
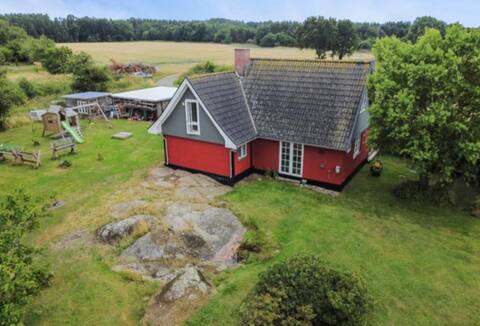
Entire Place • 4 bedrooms
Idyllic Bornholm half-timbered house
Entire Place • 3 bedrooms

Holiday on Bornholm in a beautiful house with beautiful views
Entire Place • 2 bedrooms
Summer house on Bornholm (Østerlars)
Entire Place • 3 bedrooms
Country holidays
Entire Place • 2 bedrooms
Note: Performance varies based on location, size, amenities, seasonality, and management quality. Data reflects the past 12 months.
Top Performing Airbnb Hosts in Østerlars (2026)
Learn from the best! This table showcases top-performing Airbnb hosts in Østerlars based on the number of properties managed and estimated total revenue over the past year. Analyze their scale and performance metrics.
| Host Name | Properties | Grossing Revenue | Stay Reviews | Avg Rating |
|---|---|---|---|---|
| Søren | 1 | $59,416 | 82 | 4.88/5.0 |
| A. F. | 1 | $27,856 | 29 | 4.69/5.0 |
| Tine | 1 | $25,756 | 27 | 4.93/5.0 |
| Margit | 1 | $25,464 | 24 | 4.88/5.0 |
| Jonas | 1 | $22,459 | 6 | 5.00/5.0 |
| Helle | 1 | $19,055 | 143 | 5.00/5.0 |
| Tabea | 3 | $14,765 | 45 | 4.86/5.0 |
| Lene Feldthus | 2 | $13,718 | 10 | 4.88/5.0 |
| Ernst | 1 | $8,797 | 19 | 4.84/5.0 |
| Evan Patrick | 1 | $8,433 | 95 | 4.75/5.0 |
Analyzing the strategies of top hosts, such as their property selection, pricing, and guest communication, can offer valuable lessons for optimizing your own Airbnb operations in Østerlars.
Dive Deeper: Advanced Østerlars STR Market Data (2026)
Ready to unlock more insights? AirROI provides access to advanced metrics and comprehensive Airbnb data for Østerlars. Explore detailed analytics beyond this report to refine your investment strategy, optimize pricing, and maximize your vacation rental profits.
Explore Advanced MetricsØsterlars Short-Term Rental Market Composition (2026): Property & Room Types
Room Type Distribution
Property Type Distribution
Market Composition Insights for Østerlars
- The Østerlars Airbnb market composition is heavily skewed towards Entire Home/Apt listings, which make up 77.8% of the 18 active rentals. This indicates strong guest preference for privacy and space.
- Looking at the property type distribution in Østerlars, House properties are the most common (50%), reflecting the local real estate landscape.
- Houses represent a significant 50% portion, catering likely to families or larger groups.
- The presence of 5.6% Hotel/Boutique listings indicates integration with traditional hospitality.
Østerlars Airbnb Room Capacity Analysis (2026): Bedroom Distribution
Distribution of Listings by Number of Bedrooms
Room Capacity Insights for Østerlars
- The dominant room capacity in Østerlars is 2 bedrooms listings, making up 33.3% of the market. This suggests a strong demand for properties suitable for couples or solo travelers.
- Together, 2 bedrooms and 1 bedroom properties represent 55.5% of the active Airbnb listings in Østerlars, indicating a high concentration in these sizes.
- A significant 27.9% of listings offer 3+ bedrooms, catering to larger groups and families seeking more space in Østerlars.
Østerlars Vacation Rental Guest Capacity Trends (2026)
Distribution of Listings by Guest Capacity
Guest Capacity Insights for Østerlars
- The most common guest capacity trend in Østerlars vacation rentals is listings accommodating 8+ guests (33.3%). This suggests the primary traveler segment is likely larger groups.
- Properties designed for 8+ guests and 4 guests dominate the Østerlars STR market, accounting for 55.5% of listings.
- 44.4% of properties accommodate 6+ guests, serving the market segment for larger families or group travel in Østerlars.
- On average, properties in Østerlars are equipped to host 4.4 guests.
Østerlars Airbnb Booking Patterns (2026): Available vs. Booked Days
Available Days Distribution
Booked Days Distribution
Booking Pattern Insights for Østerlars
- The most common availability pattern in Østerlars falls within the 271-366 days range, representing 55.6% of listings. This suggests many properties have significant open periods on their calendars.
- Approximately 100.0% of listings show high availability (181+ days open annually), indicating potential for increased bookings or specific owner usage patterns.
- For booked days, the 91-180 days range is most frequent in Østerlars (50%), reflecting common guest stay durations or potential owner blocking patterns.
Østerlars Airbnb Minimum Stay Requirements Analysis
Distribution of Listings by Minimum Night Requirement
1 Night
4 listings
22.2% of total
2 Nights
1 listings
5.6% of total
3 Nights
2 listings
11.1% of total
4-6 Nights
5 listings
27.8% of total
30+ Nights
6 listings
33.3% of total
Key Insights
- The most prevalent minimum stay requirement in Østerlars is 30+ Nights, adopted by 33.3% of listings. This highlights the market's preference for longer commitments.
- A significant segment (33.3%) caters to monthly stays (30+ nights) in Østerlars, pointing to opportunities in the extended-stay market.
Recommendations
- Align with the market by considering a 30+ Nights minimum stay, as 33.3% of Østerlars hosts use this setting.
- If feasible, allowing 1-night stays, especially midweek or during low season, could capture last-minute bookings, as only 22.2% currently do.
- Explore offering discounts for stays of 30+ nights to attract the 33.3% of the market seeking extended stays.
- Adjust minimum nights based on seasonality – potentially shorter during low season and longer during peak demand periods in Østerlars.
Østerlars Airbnb Cancellation Policy Trends Analysis (2026)
Flexible
3 listings
17.6% of total
Moderate
2 listings
11.8% of total
Firm
9 listings
52.9% of total
Strict
3 listings
17.6% of total
Cancellation Policy Insights for Østerlars
- The prevailing Airbnb cancellation policy trend in Østerlars is Firm, used by 52.9% of listings.
- A majority (70.5%) of hosts in Østerlars utilize Firm or Strict policies, indicating a market where hosts prioritize booking security.
Recommendations for Hosts
- Consider adopting a Firm policy to align with the 52.9% market standard in Østerlars.
- Regularly review your cancellation policy against competitors and market demand shifts in Østerlars.
Østerlars STR Booking Lead Time Analysis (2026)
Average Booking Lead Time by Month
Booking Lead Time Insights for Østerlars
- The overall average booking lead time for vacation rentals in Østerlars is 112 days.
- Guests book furthest in advance for stays during June (average 197 days), likely coinciding with peak travel demand or local events.
- The shortest booking windows occur for stays in October (average 41 days), indicating more last-minute travel plans during this time.
- Seasonally, Summer (148 days avg.) sees the longest lead times, while Winter (63 days avg.) has the shortest, reflecting typical travel planning cycles.
Recommendations for Hosts
- Use the overall average lead time (112 days) as a baseline for your pricing and availability strategy in Østerlars.
- For June stays, consider implementing length-of-stay discounts or slightly higher rates for bookings made less than 197 days out to capitalize on advance planning.
- Target marketing efforts for the Summer season well in advance (at least 148 days) to capture early planners.
- Monitor your own booking lead times against these Østerlars averages to identify opportunities for dynamic pricing adjustments.
Popular & Essential Airbnb Amenities in Østerlars (2026)
Amenity Prevalence
Amenity Insights for Østerlars
- Essential amenities in Østerlars that guests expect include: Free parking on premises. Lacking these (this) could significantly impact bookings.
- Popular amenities like Kitchen, Washer, Heating are common but not universal. Offering these can provide a competitive edge.
- Warning: Wifi is not universally provided but is considered essential globally. Ensure reliable Wifi is offered.
Recommendations for Hosts
- Ensure your listing includes all essential amenities for Østerlars: Free parking on premises.
- Consider adding popular differentiators like Kitchen or Washer to increase appeal.
- Highlight unique or less common amenities you offer (e.g., hot tub, dedicated workspace, EV charger) in your listing description and photos.
- Regularly check competitor amenities in Østerlars to stay competitive.
Østerlars Airbnb Guest Demographics & Profile Analysis (2026)
Guest Profile Summary for Østerlars
- The typical guest profile for Airbnb in Østerlars consists of a mix of domestic (43%) and international guests, with top international origins including Germany, typically belonging to the Post-2000s (Gen Z/Alpha) group (50%), primarily speaking English or German.
- Domestic travelers account for 43.1% of guests.
- Key international markets include Denmark (43.1%) and Germany (29.3%).
- Top languages spoken are English (38.3%) followed by German (19.8%).
- A significant demographic segment is the Post-2000s (Gen Z/Alpha) group, representing 50% of guests.
Recommendations for Hosts
- Balance marketing efforts between domestic and international channels based on the guest mix.
- Tailor amenities and listing descriptions to appeal to the dominant Post-2000s (Gen Z/Alpha) demographic (e.g., highlight fast WiFi, smart home features, local guides).
- Highlight unique local experiences or amenities relevant to the primary guest profile.
- Consider seasonal promotions aligned with peak travel times for key origin markets.
Nearby Short-Term Rental Market Comparison
How does the Østerlars Airbnb market stack up against its neighbors? Compare key performance metrics like average monthly revenue, ADR, and occupancy rates in surrounding areas to understand the broader regional STR landscape.
| Market | Active Properties | Monthly Revenue | Daily Rate | Avg. Occupancy |
|---|---|---|---|---|
| Tejn | 60 | $2,181 | $275.98 | 43% |
| Östra Göinge kommun | 10 | $2,138 | $216.64 | 45% |
| Perstorps kommun | 13 | $2,081 | $161.55 | 48% |
| Örkelljunga | 17 | $1,963 | $305.70 | 28% |
| Vellinge | 18 | $1,754 | $176.42 | 44% |
| Årsdale | 37 | $1,750 | $220.09 | 41% |
| Allinge-Sandvig | 88 | $1,711 | $235.69 | 39% |
| Klausdorf | 19 | $1,672 | $146.23 | 44% |
| Listed | 11 | $1,637 | $169.96 | 48% |
| Vittsjö | 20 | $1,636 | $188.66 | 40% |