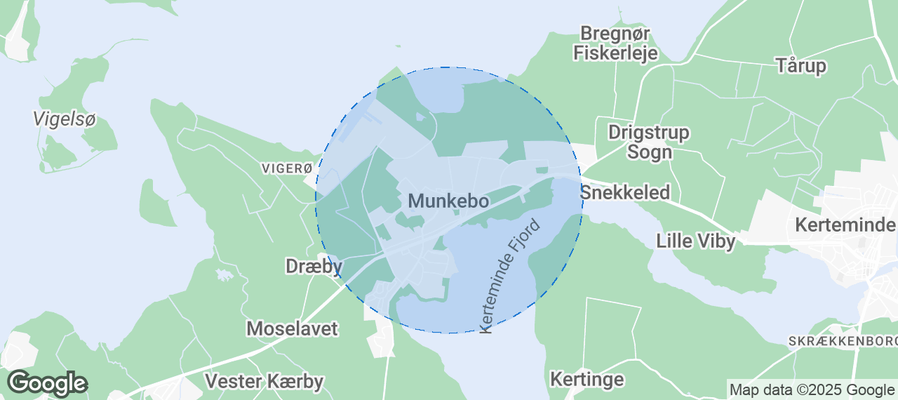
Munkebo Airbnb Market Analysis 2026: Short Term Rental Data & Vacation Rental Statistics in Region of Southern Denmark, Denmark
Is Airbnb profitable in Munkebo in 2026? Explore comprehensive Airbnb analytics for Munkebo, Region of Southern Denmark, Denmark to uncover income potential. This 2026 STR market report for Munkebo, based on AirROI data from February 2025 to January 2026, reveals key trends in the niche market of 23 active listings.
Whether you're considering an Airbnb investment in Munkebo, optimizing your existing vacation rental, or exploring rental arbitrage opportunities, understanding the Munkebo Airbnb data is crucial. Leveraging the low regulation environment is key to maximizing your short term rental income potential. Let's dive into the specifics.
Key Munkebo Airbnb Performance Metrics Overview
Monthly Airbnb Revenue Variations & Income Potential in Munkebo (2026)
Understanding the monthly revenue variations for Airbnb listings in Munkebo is key to maximizing your short term rental income potential. Seasonality significantly impacts earnings. Our analysis, based on data from the past 12 months, shows that the peak revenue month for STRs in Munkebo is typically August, while January often presents the lowest earnings, highlighting opportunities for strategic pricing adjustments during shoulder and low seasons. Explore the typical Airbnb income in Munkebo across different performance tiers:
- Best-in-class properties (Top 10%) achieve $4,623+ monthly, often utilizing dynamic pricing and superior guest experiences.
- Strong performing properties (Top 25%) earn $3,531 or more, indicating effective management and desirable locations/amenities.
- Typical properties (Median) generate around $2,221 per month, representing the average market performance.
- Entry-level properties (Bottom 25%) see earnings around $1,347, often with potential for optimization.
Average Monthly Airbnb Earnings Trend in Munkebo
Munkebo Airbnb Occupancy Rate Trends (2026)
Maximize your bookings by understanding the Munkebo STR occupancy trends. Seasonal demand shifts significantly influence how often properties are booked. Typically, Augustsees the highest demand (peak season occupancy), while December experiences the lowest (low season). Effective strategies, like adjusting minimum stays or offering promotions, can boost occupancy during slower periods. Here's how different property tiers perform in Munkebo:
- Best-in-class properties (Top 10%) achieve 89%+ occupancy, indicating high desirability and potentially optimized availability.
- Strong performing properties (Top 25%) maintain 77% or higher occupancy, suggesting good market fit and guest satisfaction.
- Typical properties (Median) have an occupancy rate around 54%.
- Entry-level properties (Bottom 25%) average 31% occupancy, potentially facing higher vacancy.
Average Monthly Occupancy Rate Trend in Munkebo
Average Daily Rate (ADR) Airbnb Trends in Munkebo (2026)
Effective short term rental pricing strategy in Munkebo involves understanding monthly ADR fluctuations. The Average Daily Rate (ADR) for Airbnb in Munkebo typically peaks in October and dips lowest during April. Leveraging Airbnb dynamic pricing tools or strategies based on this seasonality can significantly boost revenue. Here's a look at the typical nightly rates achieved:
- Best-in-class properties (Top 10%) command rates of $228+ per night, often due to premium features or locations.
- Strong performing properties (Top 25%) achieve nightly rates of $190 or more.
- Typical properties (Median) charge around $163 per night.
- Entry-level properties (Bottom 25%) earn around $99 per night.
Average Daily Rate (ADR) Trend by Month in Munkebo
Get Live Munkebo Market Intelligence 👇
Explore Real-time Analytics
Airbnb Seasonality Analysis & Trends in Munkebo (2026)
Peak Season (August, July, October)
- Revenue averages $3,342 per month
- Occupancy rates average 63.1%
- Daily rates average $159
Shoulder Season
- Revenue averages $2,351 per month
- Occupancy maintains around 51.1%
- Daily rates hold near $158
Low Season (January, February, May)
- Revenue drops to average $1,933 per month
- Occupancy decreases to average 47.4%
- Daily rates adjust to average $155
Seasonality Insights for Munkebo
- The Airbnb seasonality in Munkebo shows highly seasonal trends requiring careful strategy. While the sections above show seasonal averages, it's also insightful to look at the extremes:
- During the high season, the absolute peak month showcases Munkebo's highest earning potential, with monthly revenues capable of climbing to $3,777, occupancy reaching a high of 71.0%, and ADRs peaking at $171.
- Conversely, the slowest single month of the year, typically falling within the low season, marks the market's lowest point. In this month, revenue might dip to $1,607, occupancy could drop to 35.1%, and ADRs may adjust down to $144.
- Understanding both the seasonal averages and these monthly peaks and troughs in revenue, occupancy, and ADR is crucial for maximizing your Airbnb profit potential in Munkebo.
Seasonal Strategies for Maximizing Profit
- Peak Season: Maximize revenue through premium pricing and potentially longer minimum stays. Ensure high availability.
- Low Season: Offer competitive pricing, special promotions (e.g., extended stay discounts), and flexible cancellation policies. Target off-season travelers like remote workers or budget-conscious guests.
- Shoulder Seasons: Implement dynamic pricing that balances peak and low rates. Target weekend travelers or specific events. Offer slightly more flexible terms than peak season.
- Regularly analyze your own performance against these Munkebo seasonality benchmarks and adjust your pricing and availability strategy accordingly.
Best Areas for Airbnb Investment in Munkebo (2026)
Exploring the top neighborhoods for short-term rentals in Munkebo? This section highlights key areas, outlining why they are attractive for hosts and guests, along with notable local attractions. Consider these locations based on your target guest profile and investment strategy.
| Neighborhood / Area | Why Host Here? (Target Guests & Appeal) | Key Attractions & Landmarks |
|---|---|---|
| Munkebo Beach | A scenic beach area ideal for families and holidaymakers looking for a relaxing seaside getaway. Features beautiful views and local dining options. | Munkebo Strand, Munkebo Marina, Fjordbyen, Danish shores, Cycling paths |
| Munkebo Town Center | The charming town center with local shops, cafes, and cultural sights. Offers a blend of local life and easy access to larger towns in the region. | Munkebo Church, Local boutiques, Cafés and eateries, Munkebo Havn, Community events |
| Munkebo Green Park | A green, peaceful area perfect for nature lovers and those seeking tranquility. Features walking paths and spaces for relaxation. | Nature trails, Picnic areas, Playgrounds, Wildlife observation, Seasonal flower displays |
| Kerteminde | Nearby Kerteminde is famous for its charming harbor and beaches. A popular spot for tourists and offers rich cultural experiences and activities. | Kerteminde Beach, The Fjordland Museum, Local seafood restaurants, Aquarium of Kerteminde, Historical architecture |
| Nyborg | A historical town with rich heritage and proximity to attractions like castles and picturesque scenery, ideal for exploring Danish history. | Nyborg Castle, Danish Railway Museum, Beach parks, Cafés along the coast, Old town charm |
| Odense | The nearest large city, Odense, known for its cultural attractions related to Hans Christian Andersen. Draws in visitors year-round with varied experiences. | Hans Christian Andersen Museum, Odense Zoo, Funen Village, Historic city center, Royal Garden |
| Svendborg | A maritime town with a picturesque harbor, boutique shops, and restaurants. Good for travelers seeking a relaxing atmosphere with water-based activities. | Svendborg Marina, Boat tours, Svendborg's cafes, Historical buildings, Cycling routes |
| Lillebælt | The Lillebælt region offers beautiful nature and opportunities for sailing and fishing, attracting nature and water sports enthusiasts. | Lillebælt Bridge, Sailing tours, Nature reserves, Fishing spots, Biking trails |
Understanding Airbnb License Requirements & STR Laws in Munkebo (2026)
While Munkebo, Region of Southern Denmark, Denmark currently shows low STR regulations, specific Airbnb license requirements might still exist or change. Always verify the latest short term rental regulations and Airbnb license requirements directly with local government authorities for Munkebo to ensure full compliance before hosting.
(Source: AirROI data, 2026, finding no licensed listings among those analyzed)
Top Performing Airbnb Properties in Munkebo (2026)
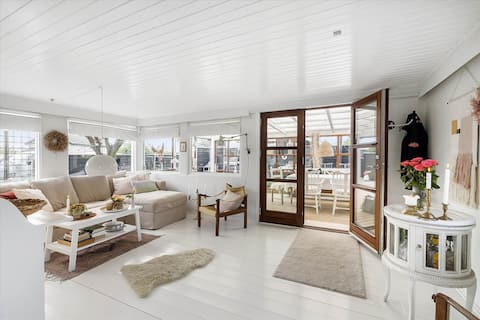
Benchmark your potential! Explore examples of top-performing Airbnb properties in Munkebobased on Trailing Twelve Month (TTM) revenue. Analyze their characteristics, revenue, occupancy rate, and ADR to understand what drives success in this market.
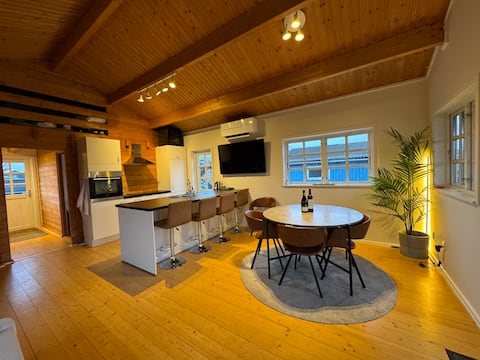
Log cabin 100 meters from the water
Entire Place • 3 bedrooms
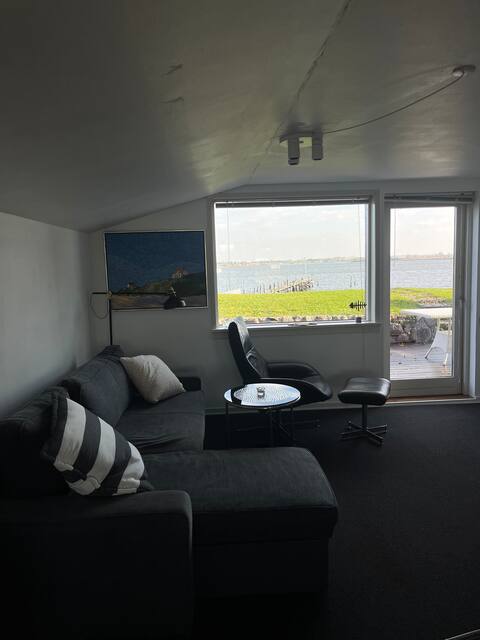
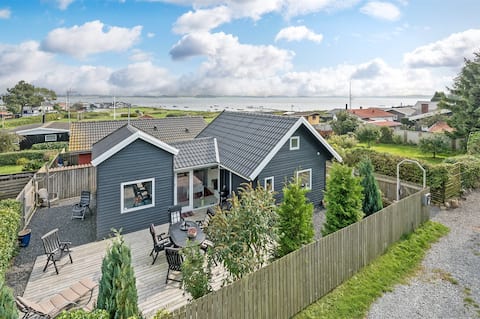
Summer house with panoramic views of the fjord
Entire Place • 2 bedrooms
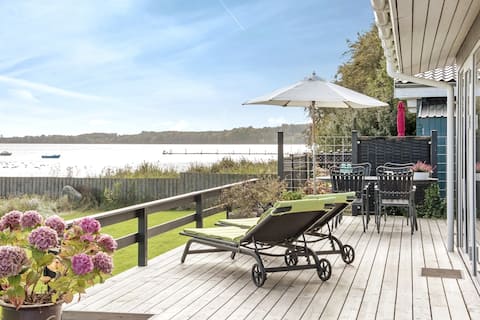
***** exclusive vacation home with panoramic views
Entire Place • 3 bedrooms
Cozy cottage 100 meters from the water
Entire Place • 1 bedroom
Beautiful cottage with ocean views on secluded grounds
Entire Place • 2 bedrooms

Cozy cottage with a view of Kerteminde Fjord
Entire Place • 2 bedrooms
Note: Performance varies based on location, size, amenities, seasonality, and management quality. Data reflects the past 12 months.
Top Performing Airbnb Hosts in Munkebo (2026)
Learn from the best! This table showcases top-performing Airbnb hosts in Munkebo based on the number of properties managed and estimated total revenue over the past year. Analyze their scale and performance metrics.
| Host Name | Properties | Grossing Revenue | Stay Reviews | Avg Rating |
|---|---|---|---|---|
| Lene | 4 | $99,878 | 96 | 4.92/5.0 |
| Mikkel | 2 | $95,706 | 72 | 4.96/5.0 |
| Trine | 2 | $61,767 | 63 | 4.74/5.0 |
| Dien | 4 | $42,097 | 12 | 4.83/5.0 |
| Campaya | 1 | $25,013 | 3 | 4.67/5.0 |
| Anette Og Jørgen Erik | 2 | $21,465 | 110 | 4.88/5.0 |
| Rune | 1 | $18,509 | 25 | 4.40/5.0 |
| Sara | 1 | $17,232 | 4 | 5.00/5.0 |
| Allan | 1 | $16,347 | 8 | 4.88/5.0 |
| Kenn Ehler | 1 | $13,126 | 44 | 4.91/5.0 |
Analyzing the strategies of top hosts, such as their property selection, pricing, and guest communication, can offer valuable lessons for optimizing your own Airbnb operations in Munkebo.
Dive Deeper: Advanced Munkebo STR Market Data (2026)
Ready to unlock more insights? AirROI provides access to advanced metrics and comprehensive Airbnb data for Munkebo. Explore detailed analytics beyond this report to refine your investment strategy, optimize pricing, and maximize your vacation rental profits.
Explore Advanced MetricsMunkebo Short-Term Rental Market Composition (2026): Property & Room Types
Room Type Distribution
Property Type Distribution
Market Composition Insights for Munkebo
- The Munkebo Airbnb market composition is heavily skewed towards Entire Home/Apt listings, which make up 82.6% of the 23 active rentals. This indicates strong guest preference for privacy and space.
- Looking at the property type distribution in Munkebo, House properties are the most common (91.3%), reflecting the local real estate landscape.
- Houses represent a significant 91.3% portion, catering likely to families or larger groups.
Munkebo Airbnb Room Capacity Analysis (2026): Bedroom Distribution
Distribution of Listings by Number of Bedrooms
Room Capacity Insights for Munkebo
- The dominant room capacity in Munkebo is 2 bedrooms listings, making up 43.5% of the market. This suggests a strong demand for properties suitable for couples or solo travelers.
- Together, 2 bedrooms and 3 bedrooms properties represent 69.6% of the active Airbnb listings in Munkebo, indicating a high concentration in these sizes.
- A significant 26.1% of listings offer 3+ bedrooms, catering to larger groups and families seeking more space in Munkebo.
Munkebo Vacation Rental Guest Capacity Trends (2026)
Distribution of Listings by Guest Capacity
Guest Capacity Insights for Munkebo
- The most common guest capacity trend in Munkebo vacation rentals is listings accommodating 4 guests (30.4%). This suggests the primary traveler segment is likely small families or groups.
- Properties designed for 4 guests and 6 guests dominate the Munkebo STR market, accounting for 47.8% of listings.
- 21.7% of properties accommodate 6+ guests, serving the market segment for larger families or group travel in Munkebo.
- On average, properties in Munkebo are equipped to host 3.5 guests.
Munkebo Airbnb Booking Patterns (2026): Available vs. Booked Days
Available Days Distribution
Booked Days Distribution
Booking Pattern Insights for Munkebo
- The most common availability pattern in Munkebo falls within the 271-366 days range, representing 56.5% of listings. This suggests many properties have significant open periods on their calendars.
- Approximately 73.9% of listings show high availability (181+ days open annually), indicating potential for increased bookings or specific owner usage patterns.
- For booked days, the 31-90 days range is most frequent in Munkebo (43.5%), reflecting common guest stay durations or potential owner blocking patterns.
- A notable 26.1% of properties secure long booking periods (181+ days booked per year), highlighting successful long-term rental strategies or significant owner usage.
Munkebo Airbnb Minimum Stay Requirements Analysis
Distribution of Listings by Minimum Night Requirement
1 Night
10 listings
43.5% of total
2 Nights
4 listings
17.4% of total
4-6 Nights
4 listings
17.4% of total
30+ Nights
5 listings
21.7% of total
Key Insights
- The most prevalent minimum stay requirement in Munkebo is 1 Night, adopted by 43.5% of listings. This highlights the market's preference for shorter, flexible bookings.
- A strong majority (60.9%) of the Munkebo Airbnb data shows acceptance of very short stays (1-2 nights), indicating a dynamic, high-turnover market.
- A significant segment (21.7%) caters to monthly stays (30+ nights) in Munkebo, pointing to opportunities in the extended-stay market.
Recommendations
- Align with the market by considering a 1 Night minimum stay, as 43.5% of Munkebo hosts use this setting.
- Explore offering discounts for stays of 30+ nights to attract the 21.7% of the market seeking extended stays.
- Adjust minimum nights based on seasonality – potentially shorter during low season and longer during peak demand periods in Munkebo.
Munkebo Airbnb Cancellation Policy Trends Analysis (2026)
Flexible
8 listings
34.8% of total
Moderate
5 listings
21.7% of total
Firm
6 listings
26.1% of total
Strict
4 listings
17.4% of total
Cancellation Policy Insights for Munkebo
- The prevailing Airbnb cancellation policy trend in Munkebo is Flexible, used by 34.8% of listings.
- There's a relatively balanced mix between guest-friendly (56.5%) and stricter (43.5%) policies, offering choices for different guest needs.
Recommendations for Hosts
- Consider adopting a Flexible policy to align with the 34.8% market standard in Munkebo.
- Regularly review your cancellation policy against competitors and market demand shifts in Munkebo.
Munkebo STR Booking Lead Time Analysis (2026)
Average Booking Lead Time by Month
Booking Lead Time Insights for Munkebo
- The overall average booking lead time for vacation rentals in Munkebo is 47 days.
- Guests book furthest in advance for stays during August (average 62 days), likely coinciding with peak travel demand or local events.
- The shortest booking windows occur for stays in October (average 21 days), indicating more last-minute travel plans during this time.
- Seasonally, Summer (54 days avg.) sees the longest lead times, while Winter (28 days avg.) has the shortest, reflecting typical travel planning cycles.
Recommendations for Hosts
- Use the overall average lead time (47 days) as a baseline for your pricing and availability strategy in Munkebo.
- For August stays, consider implementing length-of-stay discounts or slightly higher rates for bookings made less than 62 days out to capitalize on advance planning.
- Target marketing efforts for the Summer season well in advance (at least 54 days) to capture early planners.
- Monitor your own booking lead times against these Munkebo averages to identify opportunities for dynamic pricing adjustments.
Popular & Essential Airbnb Amenities in Munkebo (2026)
Amenity Prevalence
Amenity Insights for Munkebo
- Essential amenities in Munkebo that guests expect include: Free parking on premises, TV, Wifi, Kitchen. Lacking these (any) could significantly impact bookings.
- Popular amenities like BBQ grill, Washer, Refrigerator are common but not universal. Offering these can provide a competitive edge.
Recommendations for Hosts
- Ensure your listing includes all essential amenities for Munkebo: Free parking on premises, TV, Wifi, Kitchen.
- Prioritize adding missing essentials: TV, Wifi, Kitchen.
- Consider adding popular differentiators like BBQ grill or Washer to increase appeal.
- Highlight unique or less common amenities you offer (e.g., hot tub, dedicated workspace, EV charger) in your listing description and photos.
- Regularly check competitor amenities in Munkebo to stay competitive.
Munkebo Airbnb Guest Demographics & Profile Analysis (2026)
Guest Profile Summary for Munkebo
- The typical guest profile for Airbnb in Munkebo consists of a mix of domestic (44%) and international guests, with top international origins including Germany, typically belonging to the Post-2000s (Gen Z/Alpha) group (50%), primarily speaking English or German.
- Domestic travelers account for 44.0% of guests.
- Key international markets include Denmark (44%) and Germany (27.5%).
- Top languages spoken are English (34.6%) followed by German (22.4%).
- A significant demographic segment is the Post-2000s (Gen Z/Alpha) group, representing 50% of guests.
Recommendations for Hosts
- Balance marketing efforts between domestic and international channels based on the guest mix.
- Tailor amenities and listing descriptions to appeal to the dominant Post-2000s (Gen Z/Alpha) demographic (e.g., highlight fast WiFi, smart home features, local guides).
- Highlight unique local experiences or amenities relevant to the primary guest profile.
- Consider seasonal promotions aligned with peak travel times for key origin markets.
Nearby Short-Term Rental Market Comparison
How does the Munkebo Airbnb market stack up against its neighbors? Compare key performance metrics like average monthly revenue, ADR, and occupancy rates in surrounding areas to understand the broader regional STR landscape.
| Market | Active Properties | Monthly Revenue | Daily Rate | Avg. Occupancy |
|---|---|---|---|---|
| Wittenbeck | 14 | $2,937 | $224.34 | 43% |
| Lohals | 20 | $2,866 | $331.99 | 40% |
| Bissee | 13 | $2,338 | $180.13 | 48% |
| Rude Strand | 27 | $2,198 | $254.15 | 41% |
| Korshavn | 14 | $2,192 | $244.24 | 41% |
| Tørresø Strand | 26 | $2,145 | $235.54 | 42% |
| Harmsdorf | 10 | $2,076 | $326.10 | 36% |
| Billund | 105 | $2,027 | $194.14 | 46% |
| Ærøskøbing | 33 | $1,996 | $177.48 | 46% |
| Stillinge Strand | 22 | $1,853 | $228.00 | 36% |