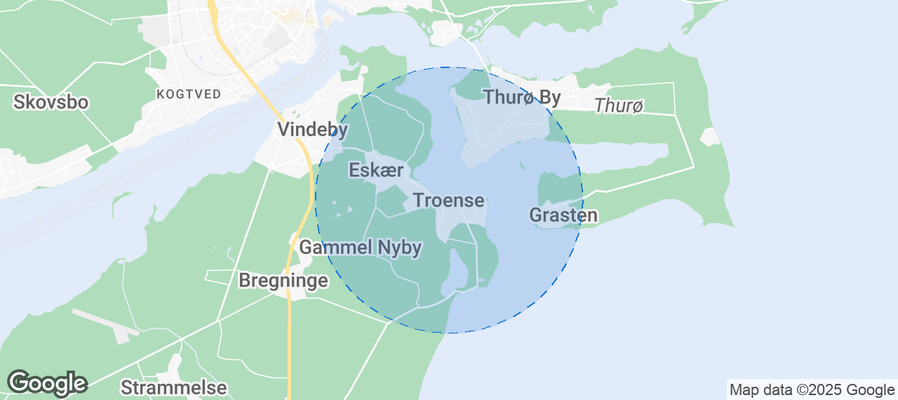
Troense Airbnb Market Analysis 2025: Short Term Rental Data & Vacation Rental Statistics in Region of Southern Denmark, Denmark
Is Airbnb profitable in Troense in 2025? Explore comprehensive Airbnb analytics for Troense, Region of Southern Denmark, Denmark to uncover income potential. This 2025 STR market report for Troense, based on AirROI data from November 2024 to October 2025, reveals key trends in the niche market of 17 active listings.
Whether you're considering an Airbnb investment in Troense, optimizing your existing vacation rental, or exploring rental arbitrage opportunities, understanding the Troense Airbnb data is crucial. Leveraging the low regulation environment is key to maximizing your short term rental income potential. Let's dive into the specifics.
Key Troense Airbnb Performance Metrics Overview
Monthly Airbnb Revenue Variations & Income Potential in Troense (2025)
Understanding the monthly revenue variations for Airbnb listings in Troense is key to maximizing your short term rental income potential. Seasonality significantly impacts earnings. Our analysis, based on data from the past 12 months, shows that the peak revenue month for STRs in Troense is typically March, while January often presents the lowest earnings, highlighting opportunities for strategic pricing adjustments during shoulder and low seasons. Explore the typical Airbnb income in Troense across different performance tiers:
- Best-in-class properties (Top 10%) achieve $7,128+ monthly, often utilizing dynamic pricing and superior guest experiences.
- Strong performing properties (Top 25%) earn $3,846 or more, indicating effective management and desirable locations/amenities.
- Typical properties (Median) generate around $1,585 per month, representing the average market performance.
- Entry-level properties (Bottom 25%) see earnings around $656, often with potential for optimization.
Average Monthly Airbnb Earnings Trend in Troense
Troense Airbnb Occupancy Rate Trends (2025)
Maximize your bookings by understanding the Troense STR occupancy trends. Seasonal demand shifts significantly influence how often properties are booked. Typically, Marchsees the highest demand (peak season occupancy), while January experiences the lowest (low season). Effective strategies, like adjusting minimum stays or offering promotions, can boost occupancy during slower periods. Here's how different property tiers perform in Troense:
- Best-in-class properties (Top 10%) achieve 71%+ occupancy, indicating high desirability and potentially optimized availability.
- Strong performing properties (Top 25%) maintain 57% or higher occupancy, suggesting good market fit and guest satisfaction.
- Typical properties (Median) have an occupancy rate around 34%.
- Entry-level properties (Bottom 25%) average 17% occupancy, potentially facing higher vacancy.
Average Monthly Occupancy Rate Trend in Troense
Average Daily Rate (ADR) Airbnb Trends in Troense (2025)
Effective short term rental pricing strategy in Troense involves understanding monthly ADR fluctuations. The Average Daily Rate (ADR) for Airbnb in Troense typically peaks in September and dips lowest during April. Leveraging Airbnb dynamic pricing tools or strategies based on this seasonality can significantly boost revenue. Here's a look at the typical nightly rates achieved:
- Best-in-class properties (Top 10%) command rates of $327+ per night, often due to premium features or locations.
- Strong performing properties (Top 25%) achieve nightly rates of $206 or more.
- Typical properties (Median) charge around $124 per night.
- Entry-level properties (Bottom 25%) earn around $101 per night.
Average Daily Rate (ADR) Trend by Month in Troense
Get Live Troense Market Intelligence 👇
Explore Real-time Analytics
Airbnb Seasonality Analysis & Trends in Troense (2025)
Peak Season (March, September, August)
- Revenue averages $5,647 per month
- Occupancy rates average 58.0%
- Daily rates average $182
Shoulder Season
- Revenue averages $2,989 per month
- Occupancy maintains around 39.1%
- Daily rates hold near $178
Low Season (January, November, December)
- Revenue drops to average $572 per month
- Occupancy decreases to average 18.0%
- Daily rates adjust to average $172
Seasonality Insights for Troense
- The Airbnb seasonality in Troense shows highly seasonal trends requiring careful strategy. While the sections above show seasonal averages, it's also insightful to look at the extremes:
- During the high season, the absolute peak month showcases Troense's highest earning potential, with monthly revenues capable of climbing to $9,058, occupancy reaching a high of 62.9%, and ADRs peaking at $189.
- Conversely, the slowest single month of the year, typically falling within the low season, marks the market's lowest point. In this month, revenue might dip to $386, occupancy could drop to 12.1%, and ADRs may adjust down to $169.
- Understanding both the seasonal averages and these monthly peaks and troughs in revenue, occupancy, and ADR is crucial for maximizing your Airbnb profit potential in Troense.
Seasonal Strategies for Maximizing Profit
- Peak Season: Maximize revenue through premium pricing and potentially longer minimum stays. Ensure high availability.
- Low Season: Offer competitive pricing, special promotions (e.g., extended stay discounts), and flexible cancellation policies. Target off-season travelers like remote workers or budget-conscious guests.
- Shoulder Seasons: Implement dynamic pricing that balances peak and low rates. Target weekend travelers or specific events. Offer slightly more flexible terms than peak season.
- Regularly analyze your own performance against these Troense seasonality benchmarks and adjust your pricing and availability strategy accordingly.
Best Areas for Airbnb Investment in Troense (2025)
Exploring the top neighborhoods for short-term rentals in Troense? This section highlights key areas, outlining why they are attractive for hosts and guests, along with notable local attractions. Consider these locations based on your target guest profile and investment strategy.
| Neighborhood / Area | Why Host Here? (Target Guests & Appeal) | Key Attractions & Landmarks |
|---|---|---|
| Troense Harbor | Picturesque harbor area offering scenic views and waterfront attractions. Ideal for guests looking to experience the charm of a traditional Danish harbor town. | Troense Harbor, Troense Museum, Yacht Marina, Local seafood restaurants, Nature walks along the waterfront |
| Sydstranden | Beautiful beach area known for its sandy shores and relaxation opportunities. Perfect for families and beach lovers seeking a summer getaway. | Sydstranden Beach, Water sports activities, Beach cafes, Walking trails, Nearby wooded areas |
| Sydfyn's Archipelago | A stunning collection of small islands offering unique natural beauty and a tranquil escape. Great for nature enthusiasts and those looking for peace and quiet. | Kerteminde Bay, Island hopping tours, Fishing spots, Kayaking, Wildlife watching |
| Valdemar Slot | Historic castle and museum offering guests a glimpse into Denmark's royal history. Attractive to history buffs and families interested in cultural heritage. | Valdemar Castle, Castle gardens, Guided tours, Historical exhibits, Events and festivals |
| Troense Village | Charming village atmosphere with traditional Danish architecture and local craftsmanship. Ideal for visitors wanting to immerse in local culture. | Traditional Danish houses, Artisan shops, Local markets, Quaint cafes, Historic church |
| Cliffs of Mols Bjerge | Nearby natural reserve with dramatic cliffs and beautiful landscapes. Popular with hikers and outdoor enthusiasts seeking adventure. | Mols Bjerge National Park, Hiking trails, Panoramic views, Birdwatching, Wildflower viewing |
| Cultural Center | A hub for local arts and events, showcasing Danish culture and community activities. Attracts tourists interested in local events and artistic exhibitions. | Local art exhibitions, Theater performances, Community festivals, Workshops, Gallery shows |
| Culinary Experiences | Region known for its exceptional dining experiences and culinary tours, attracting food lovers wanting to explore local cuisine. | Local food markets, Culinary tours, Farm-to-table restaurants, Wine tasting experiences, Cooking classes |
Understanding Airbnb License Requirements & STR Laws in Troense (2025)
While Troense, Region of Southern Denmark, Denmark currently shows low STR regulations, specific Airbnb license requirements might still exist or change. Always verify the latest short term rental regulations and Airbnb license requirements directly with local government authorities for Troense to ensure full compliance before hosting.
(Source: AirROI data, 2025, finding no licensed listings among those analyzed)
Top Performing Airbnb Properties in Troense (2025)
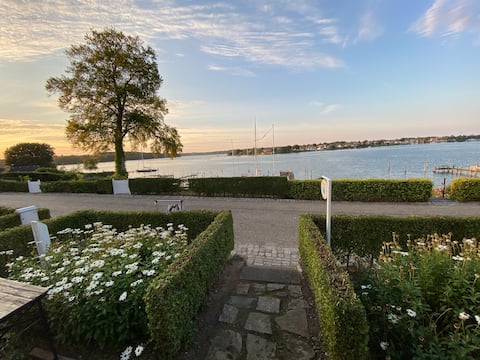
Benchmark your potential! Explore examples of top-performing Airbnb properties in Troensebased on Trailing Twelve Month (TTM) revenue. Analyze their characteristics, revenue, occupancy rate, and ADR to understand what drives success in this market.
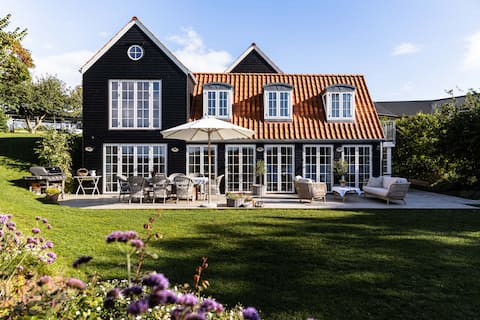
Idyllic pearl - direct access to the water in the garden
Entire Place • 5 bedrooms

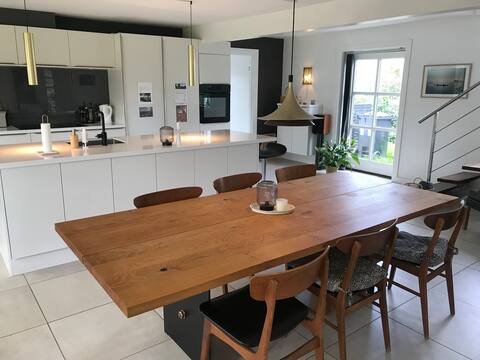
Stokroseidyl i Troense
Entire Place • 2 bedrooms
Beautiful holiday apartment in the middle of Smukke Troense.
Entire Place • N/A

Cozy Family Home with a View
Entire Place • 4 bedrooms
Family house in old Troense
Entire Place • 4 bedrooms
Family-friendly villa in the South Funen Archipelago
Entire Place • 4 bedrooms
Note: Performance varies based on location, size, amenities, seasonality, and management quality. Data reflects the past 12 months.
Top Performing Airbnb Hosts in Troense (2025)
Learn from the best! This table showcases top-performing Airbnb hosts in Troense based on the number of properties managed and estimated total revenue over the past year. Analyze their scale and performance metrics.
| Host Name | Properties | Grossing Revenue | Stay Reviews | Avg Rating |
|---|---|---|---|---|
| Anne Sofie Møller | 1 | $150,165 | 8 | 4.88/5.0 |
| Peder | 1 | $23,310 | 100 | 4.94/5.0 |
| Pia | 1 | $23,216 | 135 | 4.97/5.0 |
| Chris | 1 | $23,179 | 5 | 4.80/5.0 |
| Thomas | 1 | $17,737 | 2 | Not Rated |
| Linda | 1 | $16,634 | 12 | 5.00/5.0 |
| Lene | 1 | $16,353 | 32 | 5.00/5.0 |
| Anders | 1 | $11,346 | 67 | 4.94/5.0 |
| Jonna | 4 | $11,218 | 287 | 4.79/5.0 |
| Kirsten | 1 | $10,453 | 42 | 4.76/5.0 |
Analyzing the strategies of top hosts, such as their property selection, pricing, and guest communication, can offer valuable lessons for optimizing your own Airbnb operations in Troense.
Dive Deeper: Advanced Troense STR Market Data (2025)
Ready to unlock more insights? AirROI provides access to advanced metrics and comprehensive Airbnb data for Troense. Explore detailed analytics beyond this report to refine your investment strategy, optimize pricing, and maximize your vacation rental profits.
Explore Advanced MetricsTroense Short-Term Rental Market Composition (2025): Property & Room Types
Room Type Distribution
Property Type Distribution
Market Composition Insights for Troense
- The Troense Airbnb market composition is heavily skewed towards Entire Home/Apt listings, which make up 70.6% of the 17 active rentals. This indicates strong guest preference for privacy and space.
- Looking at the property type distribution in Troense, House properties are the most common (82.4%), reflecting the local real estate landscape.
- Houses represent a significant 82.4% portion, catering likely to families or larger groups.
Troense Airbnb Room Capacity Analysis (2025): Bedroom Distribution
Distribution of Listings by Number of Bedrooms
Room Capacity Insights for Troense
- The dominant room capacity in Troense is 1 bedroom listings, making up 23.5% of the market. This suggests a strong demand for properties suitable for couples or solo travelers.
- Together, 1 bedroom and 2 bedrooms properties represent 47.0% of the active Airbnb listings in Troense, indicating a high concentration in these sizes.
- A significant 29.4% of listings offer 3+ bedrooms, catering to larger groups and families seeking more space in Troense.
Troense Vacation Rental Guest Capacity Trends (2025)
Distribution of Listings by Guest Capacity
Guest Capacity Insights for Troense
- The most common guest capacity trend in Troense vacation rentals is listings accommodating 6 guests (23.5%). This suggests the primary traveler segment is likely larger groups.
- Properties designed for 6 guests and 4 guests dominate the Troense STR market, accounting for 41.1% of listings.
- 29.4% of properties accommodate 6+ guests, serving the market segment for larger families or group travel in Troense.
- On average, properties in Troense are equipped to host 3.1 guests.
Troense Airbnb Booking Patterns (2025): Available vs. Booked Days
Available Days Distribution
Booked Days Distribution
Booking Pattern Insights for Troense
- The most common availability pattern in Troense falls within the 271-366 days range, representing 64.7% of listings. This suggests many properties have significant open periods on their calendars.
- Approximately 88.2% of listings show high availability (181+ days open annually), indicating potential for increased bookings or specific owner usage patterns.
- For booked days, the 31-90 days range is most frequent in Troense (41.2%), reflecting common guest stay durations or potential owner blocking patterns.
- A notable 11.8% of properties secure long booking periods (181+ days booked per year), highlighting successful long-term rental strategies or significant owner usage.
Troense Airbnb Minimum Stay Requirements Analysis
Distribution of Listings by Minimum Night Requirement
1 Night
2 listings
11.8% of total
2 Nights
7 listings
41.2% of total
3 Nights
2 listings
11.8% of total
4-6 Nights
2 listings
11.8% of total
30+ Nights
4 listings
23.5% of total
Key Insights
- The most prevalent minimum stay requirement in Troense is 2 Nights, adopted by 41.2% of listings. This highlights the market's preference for shorter, flexible bookings.
- A significant segment (23.5%) caters to monthly stays (30+ nights) in Troense, pointing to opportunities in the extended-stay market.
Recommendations
- Align with the market by considering a 2 Nights minimum stay, as 41.2% of Troense hosts use this setting.
- If feasible, allowing 1-night stays, especially midweek or during low season, could capture last-minute bookings, as only 11.8% currently do.
- A 2-night minimum appears standard (41.2%). Consider this for weekends or peak periods.
- Explore offering discounts for stays of 30+ nights to attract the 23.5% of the market seeking extended stays.
- Adjust minimum nights based on seasonality – potentially shorter during low season and longer during peak demand periods in Troense.
Troense Airbnb Cancellation Policy Trends Analysis (2025)
Flexible
9 listings
52.9% of total
Moderate
4 listings
23.5% of total
Firm
3 listings
17.6% of total
Strict
1 listings
5.9% of total
Cancellation Policy Insights for Troense
- The prevailing Airbnb cancellation policy trend in Troense is Flexible, used by 52.9% of listings.
- The market strongly favors guest-friendly terms, with 76.4% of listings offering Flexible or Moderate policies. This suggests guests in Troense may expect booking flexibility.
- Strict cancellation policies are quite rare (5.9%), potentially making listings with this policy less competitive unless justified by high demand or property type.
Recommendations for Hosts
- Consider adopting a Flexible policy to align with the 52.9% market standard in Troense.
- Given the high prevalence of Flexible policies (52.9%), offering this can enhance booking appeal, especially during shoulder seasons.
- Using a Strict policy might deter some guests, as only 5.9% of listings use it. Evaluate if potential revenue protection outweighs possible lower booking rates.
- Regularly review your cancellation policy against competitors and market demand shifts in Troense.
Troense STR Booking Lead Time Analysis (2025)
Average Booking Lead Time by Month
Booking Lead Time Insights for Troense
- The overall average booking lead time for vacation rentals in Troense is 57 days.
- Guests book furthest in advance for stays during October (average 86 days), likely coinciding with peak travel demand or local events.
- The shortest booking windows occur for stays in February (average 16 days), indicating more last-minute travel plans during this time.
- Seasonally, Summer (72 days avg.) sees the longest lead times, while Winter (26 days avg.) has the shortest, reflecting typical travel planning cycles.
Recommendations for Hosts
- Use the overall average lead time (57 days) as a baseline for your pricing and availability strategy in Troense.
- For October stays, consider implementing length-of-stay discounts or slightly higher rates for bookings made less than 86 days out to capitalize on advance planning.
- Target marketing efforts for the Summer season well in advance (at least 72 days) to capture early planners.
- Monitor your own booking lead times against these Troense averages to identify opportunities for dynamic pricing adjustments.
Popular & Essential Airbnb Amenities in Troense (2025)
Amenity Prevalence
Amenity Insights for Troense
- Essential amenities in Troense that guests expect include: Wifi. Lacking these (this) could significantly impact bookings.
- Popular amenities like Heating, Smoke alarm, Free parking on premises are common but not universal. Offering these can provide a competitive edge.
Recommendations for Hosts
- Ensure your listing includes all essential amenities for Troense: Wifi.
- Consider adding popular differentiators like Heating or Smoke alarm to increase appeal.
- Highlight unique or less common amenities you offer (e.g., hot tub, dedicated workspace, EV charger) in your listing description and photos.
- Regularly check competitor amenities in Troense to stay competitive.
Troense Airbnb Guest Demographics & Profile Analysis (2025)
Guest Profile Summary for Troense
- The typical guest profile for Airbnb in Troense consists of a mix of domestic (54%) and international guests, often arriving from nearby Copenhagen, typically belonging to the Post-2000s (Gen Z/Alpha) group (50%), primarily speaking English or Danish.
- Domestic travelers account for 53.7% of guests.
- Key international markets include Denmark (53.7%) and Germany (20%).
- Top languages spoken are English (41.6%) followed by Danish (23%).
- A significant demographic segment is the Post-2000s (Gen Z/Alpha) group, representing 50% of guests.
Recommendations for Hosts
- Balance marketing efforts between domestic and international channels based on the guest mix.
- Tailor amenities and listing descriptions to appeal to the dominant Post-2000s (Gen Z/Alpha) demographic (e.g., highlight fast WiFi, smart home features, local guides).
- Highlight unique local experiences or amenities relevant to the primary guest profile.
- Consider seasonal promotions aligned with peak travel times for key origin markets.
Nearby Short-Term Rental Market Comparison
How does the Troense Airbnb market stack up against its neighbors? Compare key performance metrics like average monthly revenue, ADR, and occupancy rates in surrounding areas to understand the broader regional STR landscape.
| Market | Active Properties | Monthly Revenue | Daily Rate | Avg. Occupancy |
|---|---|---|---|---|
| Lohals | 20 | $3,098 | $343.22 | 38% |
| Wittenbeck | 14 | $2,515 | $214.51 | 40% |
| Tørresø Strand | 26 | $2,293 | $241.38 | 43% |
| Rude Strand | 28 | $2,229 | $256.20 | 38% |
| Korshavn | 15 | $2,227 | $262.44 | 41% |
| Ærøskøbing | 30 | $2,226 | $185.51 | 47% |
| Billund | 96 | $2,165 | $192.49 | 48% |
| Stapel | 10 | $2,149 | $291.45 | 33% |
| Sunds | 16 | $2,097 | $209.93 | 46% |
| Stillinge Strand | 22 | $2,054 | $236.97 | 37% |