Stubbekøbing Airbnb Market Analysis 2026: Short Term Rental Data & Vacation Rental Statistics in Region Zealand, Denmark
Is Airbnb profitable in Stubbekøbing in 2026? Explore comprehensive Airbnb analytics for Stubbekøbing, Region Zealand, Denmark to uncover income potential. This 2026 STR market report for Stubbekøbing, based on AirROI data from February 2025 to January 2026, reveals key trends in the niche market of 19 active listings.
Whether you're considering an Airbnb investment in Stubbekøbing, optimizing your existing vacation rental, or exploring rental arbitrage opportunities, understanding the Stubbekøbing Airbnb data is crucial. Leveraging the low regulation environment is key to maximizing your short term rental income potential. Let's dive into the specifics.
Key Stubbekøbing Airbnb Performance Metrics Overview
Monthly Airbnb Revenue Variations & Income Potential in Stubbekøbing (2026)
Understanding the monthly revenue variations for Airbnb listings in Stubbekøbing is key to maximizing your short term rental income potential. Seasonality significantly impacts earnings. Our analysis, based on data from the past 12 months, shows that the peak revenue month for STRs in Stubbekøbing is typically July, while February often presents the lowest earnings, highlighting opportunities for strategic pricing adjustments during shoulder and low seasons. Explore the typical Airbnb income in Stubbekøbing across different performance tiers:
- Best-in-class properties (Top 10%) achieve $2,121+ monthly, often utilizing dynamic pricing and superior guest experiences.
- Strong performing properties (Top 25%) earn $1,342 or more, indicating effective management and desirable locations/amenities.
- Typical properties (Median) generate around $632 per month, representing the average market performance.
- Entry-level properties (Bottom 25%) see earnings around $347, often with potential for optimization.
Average Monthly Airbnb Earnings Trend in Stubbekøbing
Stubbekøbing Airbnb Occupancy Rate Trends (2026)
Maximize your bookings by understanding the Stubbekøbing STR occupancy trends. Seasonal demand shifts significantly influence how often properties are booked. Typically, Julysees the highest demand (peak season occupancy), while December experiences the lowest (low season). Effective strategies, like adjusting minimum stays or offering promotions, can boost occupancy during slower periods. Here's how different property tiers perform in Stubbekøbing:
- Best-in-class properties (Top 10%) achieve 73%+ occupancy, indicating high desirability and potentially optimized availability.
- Strong performing properties (Top 25%) maintain 51% or higher occupancy, suggesting good market fit and guest satisfaction.
- Typical properties (Median) have an occupancy rate around 24%.
- Entry-level properties (Bottom 25%) average 11% occupancy, potentially facing higher vacancy.
Average Monthly Occupancy Rate Trend in Stubbekøbing
Average Daily Rate (ADR) Airbnb Trends in Stubbekøbing (2026)
Effective short term rental pricing strategy in Stubbekøbing involves understanding monthly ADR fluctuations. The Average Daily Rate (ADR) for Airbnb in Stubbekøbing typically peaks in July and dips lowest during March. Leveraging Airbnb dynamic pricing tools or strategies based on this seasonality can significantly boost revenue. Here's a look at the typical nightly rates achieved:
- Best-in-class properties (Top 10%) command rates of $153+ per night, often due to premium features or locations.
- Strong performing properties (Top 25%) achieve nightly rates of $114 or more.
- Typical properties (Median) charge around $100 per night.
- Entry-level properties (Bottom 25%) earn around $86 per night.
Average Daily Rate (ADR) Trend by Month in Stubbekøbing
Get Live Stubbekøbing Market Intelligence 👇
Explore Real-time Analytics
Airbnb Seasonality Analysis & Trends in Stubbekøbing (2026)
Peak Season (July, August, September)
- Revenue averages $1,499 per month
- Occupancy rates average 48.9%
- Daily rates average $106
Shoulder Season
- Revenue averages $829 per month
- Occupancy maintains around 31.7%
- Daily rates hold near $102
Low Season (January, February, December)
- Revenue drops to average $501 per month
- Occupancy decreases to average 19.3%
- Daily rates adjust to average $102
Seasonality Insights for Stubbekøbing
- The Airbnb seasonality in Stubbekøbing shows highly seasonal trends requiring careful strategy. While the sections above show seasonal averages, it's also insightful to look at the extremes:
- During the high season, the absolute peak month showcases Stubbekøbing's highest earning potential, with monthly revenues capable of climbing to $1,788, occupancy reaching a high of 57.9%, and ADRs peaking at $106.
- Conversely, the slowest single month of the year, typically falling within the low season, marks the market's lowest point. In this month, revenue might dip to $429, occupancy could drop to 17.6%, and ADRs may adjust down to $98.
- Understanding both the seasonal averages and these monthly peaks and troughs in revenue, occupancy, and ADR is crucial for maximizing your Airbnb profit potential in Stubbekøbing.
Seasonal Strategies for Maximizing Profit
- Peak Season: Maximize revenue through premium pricing and potentially longer minimum stays. Ensure high availability.
- Low Season: Offer competitive pricing, special promotions (e.g., extended stay discounts), and flexible cancellation policies. Target off-season travelers like remote workers or budget-conscious guests.
- Shoulder Seasons: Implement dynamic pricing that balances peak and low rates. Target weekend travelers or specific events. Offer slightly more flexible terms than peak season.
- Regularly analyze your own performance against these Stubbekøbing seasonality benchmarks and adjust your pricing and availability strategy accordingly.
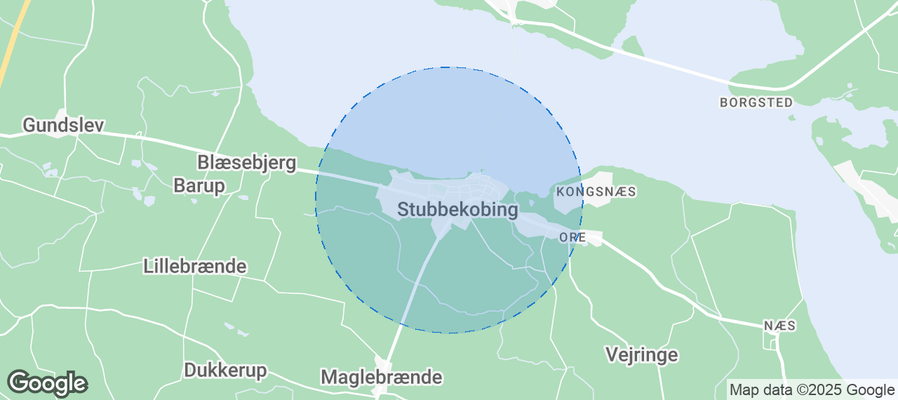
Best Areas for Airbnb Investment in Stubbekøbing (2026)
Exploring the top neighborhoods for short-term rentals in Stubbekøbing? This section highlights key areas, outlining why they are attractive for hosts and guests, along with notable local attractions. Consider these locations based on your target guest profile and investment strategy.
| Neighborhood / Area | Why Host Here? (Target Guests & Appeal) | Key Attractions & Landmarks |
|---|---|---|
| Stubbekøbing Marina | A popular spot for boating enthusiasts and families, offering scenic views and easy access to the water. It attracts visitors looking to enjoy the outdoors, fishing, and local dining options. | Stubbekøbing Marina, Bellevue Strand, Stubbekøbing old town, Local seafood restaurants, Stubbekøbing Motor Museum |
| Stubbekøbing Beach | A quaint beach area that provides a relaxing environment for families and couples looking to spend time by the sea. The beach is well-kept and offers various recreational activities. | Stubbekøbing Beach, Water sports, Nearby hiking trails, Cafes and beachside dining, Scenic picnic spots |
| Guldborgsund Bridge | A landmark in the area, attracting visitors interested in architecture and photography. It connects key areas and is a beautiful sight for tourists and locals alike. | Guldborgsund Bridge, Biking excursions, Photography opportunities, Walks along the water, Views of the surrounding landscape |
| Stubbekøbing Town Center | The heart of Stubbekøbing with shops, restaurants, and cultural experiences. It draws tourists looking for local cuisine and shops as well as community events. | Local shops, Restaurants, Cultural festivals, Historic buildings, Art galleries |
| Mollekaer | A scenic area near Stubbekøbing known for its natural beauty and tranquility, ideal for nature lovers and those seeking peace away from city life. | Nature trails, Bird watching, Picnic areas, Scenic views, Flora and fauna observations |
| Sillebroen | A vibrant area known for its community activities and events. It engages visitors with local traditions and outdoor markets, promoting the local culture. | Local markets, Community events, Cultural performances, Food stalls, Outdoor activities |
| Nysted | Nearby picturesque town known for its historical charm and coastal activities. It provides a quaint experience with various local attractions. | Historical sites, Nysted marina, Seaside activities, Local art galleries, Cafes |
| Planterskoven | A beautiful forested area perfect for hiking and outdoor activities, appealing to those who love nature and adventure. It is ideal for family outings and nature walks. | Hiking trails, Playgrounds, Educational nature signs, Guided nature tours, Biking paths |
Understanding Airbnb License Requirements & STR Laws in Stubbekøbing (2026)
While Stubbekøbing, Region Zealand, Denmark currently shows low STR regulations, specific Airbnb license requirements might still exist or change. Always verify the latest short term rental regulations and Airbnb license requirements directly with local government authorities for Stubbekøbing to ensure full compliance before hosting.
(Source: AirROI data, 2026, finding no licensed listings among those analyzed)
Top Performing Airbnb Properties in Stubbekøbing (2026)
Benchmark your potential! Explore examples of top-performing Airbnb properties in Stubbekøbingbased on Trailing Twelve Month (TTM) revenue. Analyze their characteristics, revenue, occupancy rate, and ADR to understand what drives success in this market.
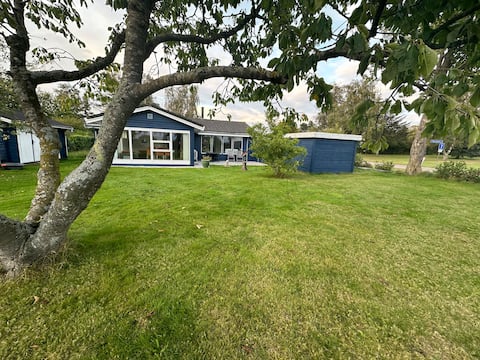
Cozy cottage close to the water!
Entire Place • 2 bedrooms
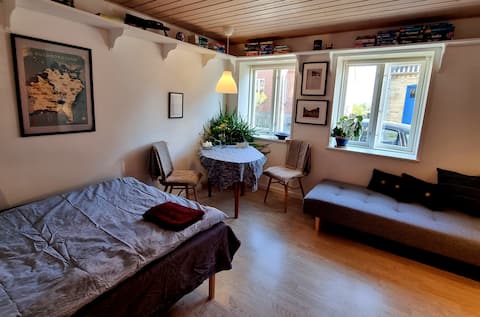
The baker's room
Private Room • N/A
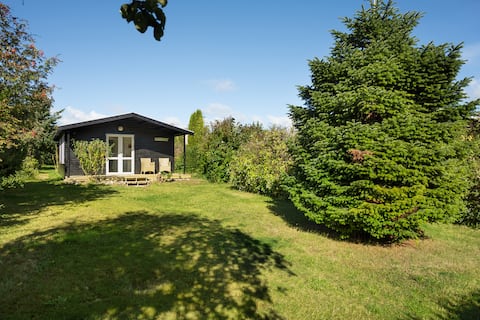
Newly renovated cottage centrally located in Stubbekøbing
Entire Place • 2 bedrooms
The House in Grønnegade
Entire Place • 1 bedroom
Room with private bathroom - room 6
Private Room • N/A
family room for max 5 pers.
Private Room • N/A
Note: Performance varies based on location, size, amenities, seasonality, and management quality. Data reflects the past 12 months.
Top Performing Airbnb Hosts in Stubbekøbing (2026)
Learn from the best! This table showcases top-performing Airbnb hosts in Stubbekøbing based on the number of properties managed and estimated total revenue over the past year. Analyze their scale and performance metrics.
| Host Name | Properties | Grossing Revenue | Stay Reviews | Avg Rating |
|---|---|---|---|---|
| Randi | 5 | $33,323 | 217 | 4.52/5.0 |
| Alan | 1 | $22,924 | 23 | 4.78/5.0 |
| Lotte | 2 | $22,789 | 60 | 4.92/5.0 |
| Sara | 1 | $16,915 | 24 | 4.83/5.0 |
| Helle | 1 | $14,710 | 169 | 4.50/5.0 |
| Josefine | 1 | $7,905 | 107 | 4.95/5.0 |
| Sally | 2 | $6,563 | 7 | 5.00/5.0 |
| Milad | 1 | $5,198 | 127 | 4.80/5.0 |
| Tina | 1 | $3,777 | 34 | 4.76/5.0 |
| Casper | 1 | $3,660 | 71 | 4.61/5.0 |
Analyzing the strategies of top hosts, such as their property selection, pricing, and guest communication, can offer valuable lessons for optimizing your own Airbnb operations in Stubbekøbing.
Dive Deeper: Advanced Stubbekøbing STR Market Data (2026)
Ready to unlock more insights? AirROI provides access to advanced metrics and comprehensive Airbnb data for Stubbekøbing. Explore detailed analytics beyond this report to refine your investment strategy, optimize pricing, and maximize your vacation rental profits.
Explore Advanced MetricsStubbekøbing Short-Term Rental Market Composition (2026): Property & Room Types
Room Type Distribution
Property Type Distribution
Market Composition Insights for Stubbekøbing
- The Stubbekøbing Airbnb market composition is heavily skewed towards Private Room listings, which make up 52.6% of the 19 active rentals. This indicates strong guest preference for privacy and space.
- Looking at the property type distribution in Stubbekøbing, House properties are the most common (47.4%), reflecting the local real estate landscape.
- Houses represent a significant 47.4% portion, catering likely to families or larger groups.
- The presence of 26.3% Hotel/Boutique listings indicates integration with traditional hospitality.
Stubbekøbing Airbnb Room Capacity Analysis (2026): Bedroom Distribution
Distribution of Listings by Number of Bedrooms
Room Capacity Insights for Stubbekøbing
- The dominant room capacity in Stubbekøbing is 1 bedroom listings, making up 26.3% of the market. This suggests a strong demand for properties suitable for couples or solo travelers.
- Together, 1 bedroom and 2 bedrooms properties represent 47.4% of the active Airbnb listings in Stubbekøbing, indicating a high concentration in these sizes.
Stubbekøbing Vacation Rental Guest Capacity Trends (2026)
Distribution of Listings by Guest Capacity
Guest Capacity Insights for Stubbekøbing
- The most common guest capacity trend in Stubbekøbing vacation rentals is listings accommodating 4 guests (26.3%). This suggests the primary traveler segment is likely small families or groups.
- Properties designed for 4 guests and 2 guests dominate the Stubbekøbing STR market, accounting for 42.1% of listings.
- On average, properties in Stubbekøbing are equipped to host 1.8 guests.
Stubbekøbing Airbnb Booking Patterns (2026): Available vs. Booked Days
Available Days Distribution
Booked Days Distribution
Booking Pattern Insights for Stubbekøbing
- The most common availability pattern in Stubbekøbing falls within the 271-366 days range, representing 68.4% of listings. This suggests many properties have significant open periods on their calendars.
- Approximately 89.5% of listings show high availability (181+ days open annually), indicating potential for increased bookings or specific owner usage patterns.
- For booked days, the 31-90 days range is most frequent in Stubbekøbing (47.4%), reflecting common guest stay durations or potential owner blocking patterns.
- A notable 10.5% of properties secure long booking periods (181+ days booked per year), highlighting successful long-term rental strategies or significant owner usage.
Stubbekøbing Airbnb Minimum Stay Requirements Analysis
Distribution of Listings by Minimum Night Requirement
1 Night
13 listings
68.4% of total
2 Nights
2 listings
10.5% of total
4-6 Nights
2 listings
10.5% of total
30+ Nights
2 listings
10.5% of total
Key Insights
- The most prevalent minimum stay requirement in Stubbekøbing is 1 Night, adopted by 68.4% of listings. This highlights the market's preference for shorter, flexible bookings.
- A strong majority (78.9%) of the Stubbekøbing Airbnb data shows acceptance of very short stays (1-2 nights), indicating a dynamic, high-turnover market.
- A significant segment (10.5%) caters to monthly stays (30+ nights) in Stubbekøbing, pointing to opportunities in the extended-stay market.
Recommendations
- Align with the market by considering a 1 Night minimum stay, as 68.4% of Stubbekøbing hosts use this setting.
- Explore offering discounts for stays of 30+ nights to attract the 10.5% of the market seeking extended stays.
- Adjust minimum nights based on seasonality – potentially shorter during low season and longer during peak demand periods in Stubbekøbing.
Stubbekøbing Airbnb Cancellation Policy Trends Analysis (2026)
Flexible
13 listings
68.4% of total
Moderate
3 listings
15.8% of total
Firm
1 listings
5.3% of total
Strict
2 listings
10.5% of total
Cancellation Policy Insights for Stubbekøbing
- The prevailing Airbnb cancellation policy trend in Stubbekøbing is Flexible, used by 68.4% of listings.
- The market strongly favors guest-friendly terms, with 84.2% of listings offering Flexible or Moderate policies. This suggests guests in Stubbekøbing may expect booking flexibility.
Recommendations for Hosts
- Consider adopting a Flexible policy to align with the 68.4% market standard in Stubbekøbing.
- Given the high prevalence of Flexible policies (68.4%), offering this can enhance booking appeal, especially during shoulder seasons.
- Using a Strict policy might deter some guests, as only 10.5% of listings use it. Evaluate if potential revenue protection outweighs possible lower booking rates.
- Regularly review your cancellation policy against competitors and market demand shifts in Stubbekøbing.
Stubbekøbing STR Booking Lead Time Analysis (2026)
Average Booking Lead Time by Month
Booking Lead Time Insights for Stubbekøbing
- The overall average booking lead time for vacation rentals in Stubbekøbing is 48 days.
- Guests book furthest in advance for stays during June (average 98 days), likely coinciding with peak travel demand or local events.
- The shortest booking windows occur for stays in February (average 13 days), indicating more last-minute travel plans during this time.
- Seasonally, Summer (67 days avg.) sees the longest lead times, while Winter (29 days avg.) has the shortest, reflecting typical travel planning cycles.
Recommendations for Hosts
- Use the overall average lead time (48 days) as a baseline for your pricing and availability strategy in Stubbekøbing.
- For June stays, consider implementing length-of-stay discounts or slightly higher rates for bookings made less than 98 days out to capitalize on advance planning.
- During February, focus on last-minute booking availability and promotions, as guests book with very short notice (13 days avg.).
- Target marketing efforts for the Summer season well in advance (at least 67 days) to capture early planners.
- Monitor your own booking lead times against these Stubbekøbing averages to identify opportunities for dynamic pricing adjustments.
Popular & Essential Airbnb Amenities in Stubbekøbing (2026)
Amenity Prevalence
Amenity Insights for Stubbekøbing
- Popular amenities like Kitchen, Heating, Wifi are common but not universal. Offering these can provide a competitive edge.
- Warning: Wifi is not universally provided but is considered essential globally. Ensure reliable Wifi is offered.
Recommendations for Hosts
- Consider adding popular differentiators like Kitchen or Heating to increase appeal.
- Highlight unique or less common amenities you offer (e.g., hot tub, dedicated workspace, EV charger) in your listing description and photos.
- Regularly check competitor amenities in Stubbekøbing to stay competitive.
Stubbekøbing Airbnb Guest Demographics & Profile Analysis (2026)
Guest Profile Summary for Stubbekøbing
- The typical guest profile for Airbnb in Stubbekøbing consists of predominantly international visitors (83%), with top international origins including Denmark, typically belonging to the Post-2000s (Gen Z/Alpha) group (50%), primarily speaking English or German.
- Domestic travelers account for 17.4% of guests.
- Key international markets include Germany (39.1%) and Denmark (17.4%).
- Top languages spoken are English (37.4%) followed by German (22.2%).
- A significant demographic segment is the Post-2000s (Gen Z/Alpha) group, representing 50% of guests.
Recommendations for Hosts
- Focus marketing internationally, particularly towards travelers from Denmark.
- Tailor amenities and listing descriptions to appeal to the dominant Post-2000s (Gen Z/Alpha) demographic (e.g., highlight fast WiFi, smart home features, local guides).
- Highlight unique local experiences or amenities relevant to the primary guest profile.
- Consider seasonal promotions aligned with peak travel times for key origin markets.
Nearby Short-Term Rental Market Comparison
How does the Stubbekøbing Airbnb market stack up against its neighbors? Compare key performance metrics like average monthly revenue, ADR, and occupancy rates in surrounding areas to understand the broader regional STR landscape.
| Market | Active Properties | Monthly Revenue | Daily Rate | Avg. Occupancy |
|---|---|---|---|---|
| Gallin-Kuppentin | 14 | $2,958 | $358.55 | 30% |
| Wittenbeck | 14 | $2,937 | $224.34 | 43% |
| Groß Nemerow | 13 | $2,404 | $135.17 | 60% |
| Heiligengrabe | 12 | $2,400 | $226.39 | 39% |
| Copenhagen | 9,111 | $2,347 | $222.94 | 52% |
| Råbylille Strand | 31 | $2,254 | $190.70 | 45% |
| Alt Sührkow | 10 | $2,175 | $426.32 | 28% |
| Frederiksberg | 1,015 | $2,062 | $217.28 | 50% |
| Solrød Strand | 54 | $2,032 | $249.51 | 48% |
| Hellerup | 11 | $1,973 | $298.07 | 51% |