Sosúa Airbnb Market Analysis 2026: Short Term Rental Data & Vacation Rental Statistics in Puerto Plata, Dominican Republic
Is Airbnb profitable in Sosúa in 2026? Explore comprehensive Airbnb analytics for Sosúa, Puerto Plata, Dominican Republic to uncover income potential. This 2026 STR market report for Sosúa, based on AirROI data from February 2025 to January 2026, reveals key trends in the bustling market of 1,556 active listings.
Whether you're considering an Airbnb investment in Sosúa, optimizing your existing vacation rental, or exploring rental arbitrage opportunities, understanding the Sosúa Airbnb data is crucial. Leveraging the low regulation environment is key to maximizing your short term rental income potential. Let's dive into the specifics.
Key Sosúa Airbnb Performance Metrics Overview
Monthly Airbnb Revenue Variations & Income Potential in Sosúa (2026)
Understanding the monthly revenue variations for Airbnb listings in Sosúa is key to maximizing your short term rental income potential. Seasonality significantly impacts earnings. Our analysis, based on data from the past 12 months, shows that the peak revenue month for STRs in Sosúa is typically February, while September often presents the lowest earnings, highlighting opportunities for strategic pricing adjustments during shoulder and low seasons. Explore the typical Airbnb income in Sosúa across different performance tiers:
- Best-in-class properties (Top 10%) achieve $4,896+ monthly, often utilizing dynamic pricing and superior guest experiences.
- Strong performing properties (Top 25%) earn $2,675 or more, indicating effective management and desirable locations/amenities.
- Typical properties (Median) generate around $1,250 per month, representing the average market performance.
- Entry-level properties (Bottom 25%) see earnings around $529, often with potential for optimization.
Average Monthly Airbnb Earnings Trend in Sosúa
Sosúa Airbnb Occupancy Rate Trends (2026)
Maximize your bookings by understanding the Sosúa STR occupancy trends. Seasonal demand shifts significantly influence how often properties are booked. Typically, Februarysees the highest demand (peak season occupancy), while October experiences the lowest (low season). Effective strategies, like adjusting minimum stays or offering promotions, can boost occupancy during slower periods. Here's how different property tiers perform in Sosúa:
- Best-in-class properties (Top 10%) achieve 67%+ occupancy, indicating high desirability and potentially optimized availability.
- Strong performing properties (Top 25%) maintain 48% or higher occupancy, suggesting good market fit and guest satisfaction.
- Typical properties (Median) have an occupancy rate around 28%.
- Entry-level properties (Bottom 25%) average 14% occupancy, potentially facing higher vacancy.
Average Monthly Occupancy Rate Trend in Sosúa
Average Daily Rate (ADR) Airbnb Trends in Sosúa (2026)
Effective short term rental pricing strategy in Sosúa involves understanding monthly ADR fluctuations. The Average Daily Rate (ADR) for Airbnb in Sosúa typically peaks in September and dips lowest during November. Leveraging Airbnb dynamic pricing tools or strategies based on this seasonality can significantly boost revenue. Here's a look at the typical nightly rates achieved:
- Best-in-class properties (Top 10%) command rates of $415+ per night, often due to premium features or locations.
- Strong performing properties (Top 25%) achieve nightly rates of $244 or more.
- Typical properties (Median) charge around $136 per night.
- Entry-level properties (Bottom 25%) earn around $68 per night.
Average Daily Rate (ADR) Trend by Month in Sosúa
Get Live Sosúa Market Intelligence 👇

Explore Real-time Analytics
Airbnb Seasonality Analysis & Trends in Sosúa (2026)
Peak Season (February, March, April)
- Revenue averages $2,737 per month
- Occupancy rates average 43.1%
- Daily rates average $212
Shoulder Season
- Revenue averages $2,149 per month
- Occupancy maintains around 31.4%
- Daily rates hold near $211
Low Season (September, October, November)
- Revenue drops to average $1,680 per month
- Occupancy decreases to average 26.5%
- Daily rates adjust to average $210
Seasonality Insights for Sosúa
- The Airbnb seasonality in Sosúa shows moderate seasonality with distinct peak and low periods. While the sections above show seasonal averages, it's also insightful to look at the extremes:
- During the high season, the absolute peak month showcases Sosúa's highest earning potential, with monthly revenues capable of climbing to $2,955, occupancy reaching a high of 48.6%, and ADRs peaking at $215.
- Conversely, the slowest single month of the year, typically falling within the low season, marks the market's lowest point. In this month, revenue might dip to $1,649, occupancy could drop to 25.2%, and ADRs may adjust down to $207.
- Understanding both the seasonal averages and these monthly peaks and troughs in revenue, occupancy, and ADR is crucial for maximizing your Airbnb profit potential in Sosúa.
Seasonal Strategies for Maximizing Profit
- Peak Season: Maximize revenue through premium pricing and potentially longer minimum stays. Ensure high availability.
- Low Season: Offer competitive pricing, special promotions (e.g., extended stay discounts), and flexible cancellation policies. Target off-season travelers like remote workers or budget-conscious guests.
- Shoulder Seasons: Implement dynamic pricing that balances peak and low rates. Target weekend travelers or specific events. Offer slightly more flexible terms than peak season.
- Regularly analyze your own performance against these Sosúa seasonality benchmarks and adjust your pricing and availability strategy accordingly.
Best Areas for Airbnb Investment in Sosúa (2026)
Exploring the top neighborhoods for short-term rentals in Sosúa? This section highlights key areas, outlining why they are attractive for hosts and guests, along with notable local attractions. Consider these locations based on your target guest profile and investment strategy.
| Neighborhood / Area | Why Host Here? (Target Guests & Appeal) | Key Attractions & Landmarks |
|---|---|---|
| Cabarete | Famous for its water sports, vibrant nightlife, and stunning beaches. A hotspot for adventure seekers and those looking for a lively atmosphere. | Kite beach, Cabarete Bay, El Choco National Park, Wind Sports School, Cabarete Market |
| Sosúa Beach | Known for its beautiful beach and rich cultural diversity. Attracts tourists looking for relaxation and local experiences. | Sosúa Beach, Playa Alicia, Coral Reef, Sosúa Ocean Village, Jewish Museum of Sosúa |
| Puerto Plata | Historic city with rich colonial architecture and beautiful coastline. Offers a mix of cultural experiences and beach leisure. | Fort San Felipe, Amber Museum, Malecon Puerto Plata, Mount Isabel de Torres, Ocean World Adventure Park |
| Playa Dorada | A popular beach resort area known for its all-inclusive resorts and golf courses. Ideal for families and beachgoers. | Playa Dorada Beach, Playa Dorada Golf Course, Iberostar Costa Dorada, Ocean World Adventure Park, Playa Grande |
| Los Charamicos | Authentic Dominican neighborhood near Sosúa that provides cultural immersion and local experiences. | Local markets, Culinary tours, Cultural sites, Community events, Crafts shops |
| Sosúa’s nightclubs | Known for its vibrant nightlife and entertainment options, appealing to travelers looking for social and nightlife experiences. | Club Casa Blanca, Nightclubs and bars along the beach, Live music venues, Dance clubs, Local concerts |
| Cerro de la Cruz | Offers panoramic views of Sosúa and the surrounding landscapes. A tranquil spot for nature lovers. | Hiking trails, Viewpoints, Nature parks, Birdwatching, Scenic photography |
| Costambar | A quieter beach area near Puerto Plata, ideal for families and those seeking relaxation away from the hustle and bustle. | Costambar Beach, Local shops, Beachfront dining, Relaxation spots, Water activities |
Understanding Airbnb License Requirements & STR Laws in Sosúa (2026)
While Sosúa, Puerto Plata, Dominican Republic currently shows low STR regulations, specific Airbnb license requirements might still exist or change. Always verify the latest short term rental regulations and Airbnb license requirements directly with local government authorities for Sosúa to ensure full compliance before hosting.
(Source: AirROI data, 2026, based on 1% licensed listings)
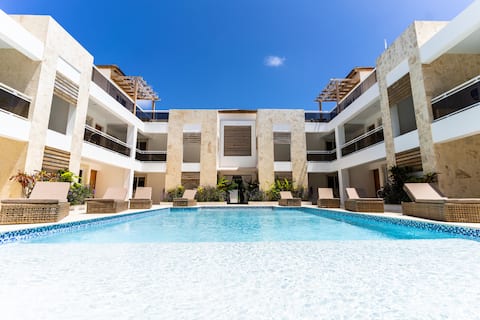
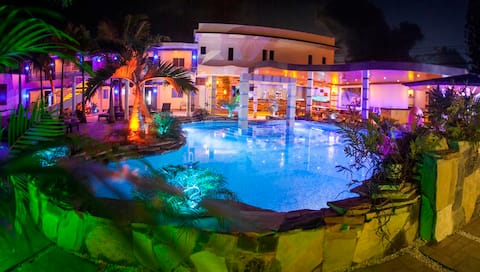
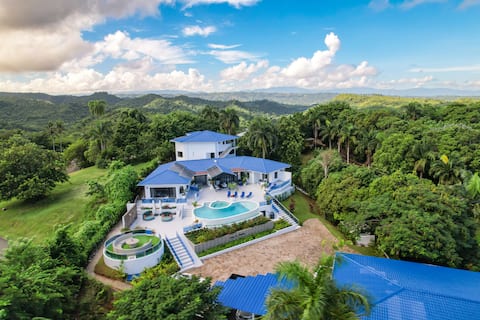
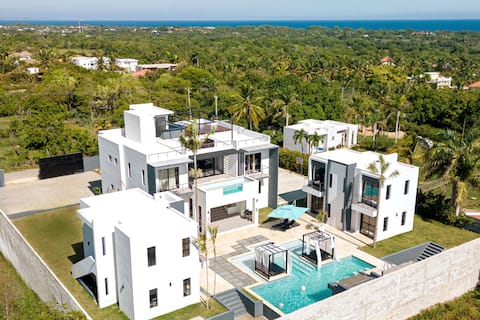
Top Performing Airbnb Properties in Sosúa (2026)
Benchmark your potential! Explore examples of top-performing Airbnb properties in Sosúabased on Trailing Twelve Month (TTM) revenue. Analyze their characteristics, revenue, occupancy rate, and ADR to understand what drives success in this market.

Sweet Blue Sky 20BR Airport pick up included
Entire Place • 20 bedrooms
Private 22 BR Oasis, steps from beach
Entire Place • 22 bedrooms
Huge Luxury Party Villa 14 BR w/Breakfast
Entire Place • 14 bedrooms
Ultimate Private Luxury Compound
Entire Place • 13 bedrooms
14 Bedroom Sosua Mansion
Entire Place • 14 bedrooms

Christmas Haven · 7 Suites & HOT Jacuzzi
Entire Place • 7 bedrooms
Note: Performance varies based on location, size, amenities, seasonality, and management quality. Data reflects the past 12 months.
Top Performing Airbnb Hosts in Sosúa (2026)
Learn from the best! This table showcases top-performing Airbnb hosts in Sosúa based on the number of properties managed and estimated total revenue over the past year. Analyze their scale and performance metrics.
| Host Name | Properties | Grossing Revenue | Stay Reviews | Avg Rating |
|---|---|---|---|---|
| Karen Beatriz | 40 | $1,048,327 | 340 | 4.84/5.0 |
| Carlos Daniel Bierd Peralta | 43 | $913,213 | 590 | 4.74/5.0 |
| CASA COCO Villa Rentals | 25 | $860,790 | 932 | 4.80/5.0 |
| The Good Life Sosúa | 36 | $816,943 | 1121 | 4.81/5.0 |
| Villas Agua Dulce | 23 | $614,598 | 492 | 4.92/5.0 |
| Eury | 10 | $561,518 | 153 | 4.85/5.0 |
| Brenda | 3 | $503,411 | 48 | 4.93/5.0 |
| Sunsets Vacations | 15 | $494,503 | 474 | 4.70/5.0 |
| Frailyn | 19 | $480,586 | 298 | 4.79/5.0 |
| Ben | 2 | $451,836 | 55 | 4.99/5.0 |
Analyzing the strategies of top hosts, such as their property selection, pricing, and guest communication, can offer valuable lessons for optimizing your own Airbnb operations in Sosúa.
Dive Deeper: Advanced Sosúa STR Market Data (2026)
Ready to unlock more insights? AirROI provides access to advanced metrics and comprehensive Airbnb data for Sosúa. Explore detailed analytics beyond this report to refine your investment strategy, optimize pricing, and maximize your vacation rental profits.
Explore Advanced MetricsSosúa Short-Term Rental Market Composition (2026): Property & Room Types
Room Type Distribution
Property Type Distribution
Market Composition Insights for Sosúa
- The Sosúa Airbnb market composition is heavily skewed towards Entire Home/Apt listings, which make up 94.2% of the 1,556 active rentals. This indicates strong guest preference for privacy and space.
- Looking at the property type distribution in Sosúa, House properties are the most common (48.5%), reflecting the local real estate landscape.
- Houses represent a significant 48.5% portion, catering likely to families or larger groups.
- Smaller segments like hotel/boutique, others, unique stays (combined 3.8%) offer potential for unique stay experiences.
Sosúa Airbnb Room Capacity Analysis (2026): Bedroom Distribution
Distribution of Listings by Number of Bedrooms
Room Capacity Insights for Sosúa
- The dominant room capacity in Sosúa is 1 bedroom listings, making up 28.7% of the market. This suggests a strong demand for properties suitable for couples or solo travelers.
- Together, 1 bedroom and 2 bedrooms properties represent 55.6% of the active Airbnb listings in Sosúa, indicating a high concentration in these sizes.
- A significant 40.0% of listings offer 3+ bedrooms, catering to larger groups and families seeking more space in Sosúa.
Sosúa Vacation Rental Guest Capacity Trends (2026)
Distribution of Listings by Guest Capacity
Guest Capacity Insights for Sosúa
- The most common guest capacity trend in Sosúa vacation rentals is listings accommodating 8+ guests (26.3%). This suggests the primary traveler segment is likely larger groups.
- Properties designed for 8+ guests and 2 guests dominate the Sosúa STR market, accounting for 49.8% of listings.
- 43.4% of properties accommodate 6+ guests, serving the market segment for larger families or group travel in Sosúa.
- On average, properties in Sosúa are equipped to host 4.8 guests.
Sosúa Airbnb Booking Patterns (2026): Available vs. Booked Days
Available Days Distribution
Booked Days Distribution
Booking Pattern Insights for Sosúa
- The most common availability pattern in Sosúa falls within the 271-366 days range, representing 71% of listings. This suggests many properties have significant open periods on their calendars.
- Approximately 94.8% of listings show high availability (181+ days open annually), indicating potential for increased bookings or specific owner usage patterns.
- For booked days, the 31-90 days range is most frequent in Sosúa (37.7%), reflecting common guest stay durations or potential owner blocking patterns.
- A notable 6.1% of properties secure long booking periods (181+ days booked per year), highlighting successful long-term rental strategies or significant owner usage.
Sosúa Airbnb Minimum Stay Requirements Analysis
Distribution of Listings by Minimum Night Requirement
1 Night
401 listings
25.8% of total
2 Nights
500 listings
32.1% of total
3 Nights
159 listings
10.2% of total
4-6 Nights
76 listings
4.9% of total
7-29 Nights
29 listings
1.9% of total
30+ Nights
391 listings
25.1% of total
Key Insights
- The most prevalent minimum stay requirement in Sosúa is 2 Nights, adopted by 32.1% of listings. This highlights the market's preference for shorter, flexible bookings.
- A significant segment (25.1%) caters to monthly stays (30+ nights) in Sosúa, pointing to opportunities in the extended-stay market.
Recommendations
- Align with the market by considering a 2 Nights minimum stay, as 32.1% of Sosúa hosts use this setting.
- If feasible, allowing 1-night stays, especially midweek or during low season, could capture last-minute bookings, as only 25.8% currently do.
- Explore offering discounts for stays of 30+ nights to attract the 25.1% of the market seeking extended stays.
- Adjust minimum nights based on seasonality – potentially shorter during low season and longer during peak demand periods in Sosúa.
Sosúa Airbnb Cancellation Policy Trends Analysis (2026)
Limited
32 listings
2.1% of total
Super Strict 60 Days
6 listings
0.4% of total
Super Strict 30 Days
4 listings
0.3% of total
Flexible
426 listings
27.5% of total
Moderate
312 listings
20.1% of total
Firm
456 listings
29.4% of total
Strict
313 listings
20.2% of total
Cancellation Policy Insights for Sosúa
- The prevailing Airbnb cancellation policy trend in Sosúa is Firm, used by 29.4% of listings.
- There's a relatively balanced mix between guest-friendly (47.6%) and stricter (49.6%) policies, offering choices for different guest needs.
Recommendations for Hosts
- Consider adopting a Firm policy to align with the 29.4% market standard in Sosúa.
- Regularly review your cancellation policy against competitors and market demand shifts in Sosúa.
Sosúa STR Booking Lead Time Analysis (2026)
Average Booking Lead Time by Month
Booking Lead Time Insights for Sosúa
- The overall average booking lead time for vacation rentals in Sosúa is 44 days.
- Guests book furthest in advance for stays during January (average 66 days), likely coinciding with peak travel demand or local events.
- The shortest booking windows occur for stays in June (average 29 days), indicating more last-minute travel plans during this time.
- Seasonally, Winter (61 days avg.) sees the longest lead times, while Summer (33 days avg.) has the shortest, reflecting typical travel planning cycles.
Recommendations for Hosts
- Use the overall average lead time (44 days) as a baseline for your pricing and availability strategy in Sosúa.
- For January stays, consider implementing length-of-stay discounts or slightly higher rates for bookings made less than 66 days out to capitalize on advance planning.
- Target marketing efforts for the Winter season well in advance (at least 61 days) to capture early planners.
- Monitor your own booking lead times against these Sosúa averages to identify opportunities for dynamic pricing adjustments.
Popular & Essential Airbnb Amenities in Sosúa (2026)
Amenity Prevalence
Amenity Insights for Sosúa
- Essential amenities in Sosúa that guests expect include: Wifi, Air conditioning, TV. Lacking these (any) could significantly impact bookings.
- Popular amenities like Kitchen, Free parking on premises, Pool are common but not universal. Offering these can provide a competitive edge.
- A pool is a highly desired but not standard amenity, making it a key feature for attracting guests seeking leisure in Sosúa.
Recommendations for Hosts
- Ensure your listing includes all essential amenities for Sosúa: Wifi, Air conditioning, TV.
- Prioritize adding missing essentials: Wifi, Air conditioning, TV.
- Consider adding popular differentiators like Kitchen or Free parking on premises to increase appeal.
- Highlight unique or less common amenities you offer (e.g., hot tub, dedicated workspace, EV charger) in your listing description and photos.
- Regularly check competitor amenities in Sosúa to stay competitive.
Sosúa Airbnb Guest Demographics & Profile Analysis (2026)
Guest Profile Summary for Sosúa
- The typical guest profile for Airbnb in Sosúa consists of predominantly international visitors (85%), with top international origins including Dominican Republic, typically belonging to the Post-2000s (Gen Z/Alpha) group (50%), primarily speaking English or Spanish.
- Domestic travelers account for 14.9% of guests.
- Key international markets include United States (71.7%) and Dominican Republic (14.9%).
- Top languages spoken are English (57.5%) followed by Spanish (30.5%).
- A significant demographic segment is the Post-2000s (Gen Z/Alpha) group, representing 50% of guests.
Recommendations for Hosts
- Focus marketing internationally, particularly towards travelers from Dominican Republic.
- Tailor amenities and listing descriptions to appeal to the dominant Post-2000s (Gen Z/Alpha) demographic (e.g., highlight fast WiFi, smart home features, local guides).
- Highlight unique local experiences or amenities relevant to the primary guest profile.
- Consider seasonal promotions aligned with peak travel times for key origin markets.
Nearby Short-Term Rental Market Comparison
How does the Sosúa Airbnb market stack up against its neighbors? Compare key performance metrics like average monthly revenue, ADR, and occupancy rates in surrounding areas to understand the broader regional STR landscape.
| Market | Active Properties | Monthly Revenue | Daily Rate | Avg. Occupancy |
|---|---|---|---|---|
| Abreu | 15 | $2,503 | $204.50 | 26% |
| Juan Esteban | 12 | $1,703 | $346.19 | 21% |
| Punta Rucia;Damaris | 33 | $1,683 | $223.57 | 21% |
| Las Terrenas | 2,242 | $1,559 | $225.03 | 32% |
| Las Charcas | 57 | $1,432 | $304.97 | 19% |
| Punta Rucia | 14 | $1,403 | $203.53 | 21% |
| Buena Vista | 22 | $1,170 | $235.10 | 24% |
| Cabarete | 1,025 | $1,066 | $159.24 | 35% |
| Tamboril | 33 | $1,050 | $135.33 | 27% |
| Monte Plata | 17 | $1,033 | $170.06 | 21% |