Puñal Airbnb Market Analysis 2026: Short Term Rental Data & Vacation Rental Statistics in Santiago, Dominican Republic
Is Airbnb profitable in Puñal in 2026? Explore comprehensive Airbnb analytics for Puñal, Santiago, Dominican Republic to uncover income potential. This 2026 STR market report for Puñal, based on AirROI data from February 2025 to January 2026, reveals key trends in the market of 246 active listings.
Whether you're considering an Airbnb investment in Puñal, optimizing your existing vacation rental, or exploring rental arbitrage opportunities, understanding the Puñal Airbnb data is crucial. Leveraging the low regulation environment is key to maximizing your short term rental income potential. Let's dive into the specifics.
Key Puñal Airbnb Performance Metrics Overview
Monthly Airbnb Revenue Variations & Income Potential in Puñal (2026)
Understanding the monthly revenue variations for Airbnb listings in Puñal is key to maximizing your short term rental income potential. Seasonality significantly impacts earnings. Our analysis, based on data from the past 12 months, shows that the peak revenue month for STRs in Puñal is typically August, while December often presents the lowest earnings, highlighting opportunities for strategic pricing adjustments during shoulder and low seasons. Explore the typical Airbnb income in Puñal across different performance tiers:
- Best-in-class properties (Top 10%) achieve $1,551+ monthly, often utilizing dynamic pricing and superior guest experiences.
- Strong performing properties (Top 25%) earn $1,094 or more, indicating effective management and desirable locations/amenities.
- Typical properties (Median) generate around $619 per month, representing the average market performance.
- Entry-level properties (Bottom 25%) see earnings around $288, often with potential for optimization.
Average Monthly Airbnb Earnings Trend in Puñal
Puñal Airbnb Occupancy Rate Trends (2026)
Maximize your bookings by understanding the Puñal STR occupancy trends. Seasonal demand shifts significantly influence how often properties are booked. Typically, Augustsees the highest demand (peak season occupancy), while December experiences the lowest (low season). Effective strategies, like adjusting minimum stays or offering promotions, can boost occupancy during slower periods. Here's how different property tiers perform in Puñal:
- Best-in-class properties (Top 10%) achieve 79%+ occupancy, indicating high desirability and potentially optimized availability.
- Strong performing properties (Top 25%) maintain 59% or higher occupancy, suggesting good market fit and guest satisfaction.
- Typical properties (Median) have an occupancy rate around 34%.
- Entry-level properties (Bottom 25%) average 15% occupancy, potentially facing higher vacancy.
Average Monthly Occupancy Rate Trend in Puñal
Average Daily Rate (ADR) Airbnb Trends in Puñal (2026)
Effective short term rental pricing strategy in Puñal involves understanding monthly ADR fluctuations. The Average Daily Rate (ADR) for Airbnb in Puñal typically peaks in September and dips lowest during March. Leveraging Airbnb dynamic pricing tools or strategies based on this seasonality can significantly boost revenue. Here's a look at the typical nightly rates achieved:
- Best-in-class properties (Top 10%) command rates of $96+ per night, often due to premium features or locations.
- Strong performing properties (Top 25%) achieve nightly rates of $68 or more.
- Typical properties (Median) charge around $57 per night.
- Entry-level properties (Bottom 25%) earn around $48 per night.
Average Daily Rate (ADR) Trend by Month in Puñal
Get Live Puñal Market Intelligence 👇

Explore Real-time Analytics
Airbnb Seasonality Analysis & Trends in Puñal (2026)
Peak Season (August, July, October)
- Revenue averages $1,001 per month
- Occupancy rates average 43.5%
- Daily rates average $68
Shoulder Season
- Revenue averages $778 per month
- Occupancy maintains around 38.4%
- Daily rates hold near $67
Low Season (January, April, December)
- Revenue drops to average $712 per month
- Occupancy decreases to average 34.4%
- Daily rates adjust to average $66
Seasonality Insights for Puñal
- The Airbnb seasonality in Puñal shows moderate seasonality with distinct peak and low periods. While the sections above show seasonal averages, it's also insightful to look at the extremes:
- During the high season, the absolute peak month showcases Puñal's highest earning potential, with monthly revenues capable of climbing to $1,098, occupancy reaching a high of 48.5%, and ADRs peaking at $69.
- Conversely, the slowest single month of the year, typically falling within the low season, marks the market's lowest point. In this month, revenue might dip to $696, occupancy could drop to 32.1%, and ADRs may adjust down to $64.
- Understanding both the seasonal averages and these monthly peaks and troughs in revenue, occupancy, and ADR is crucial for maximizing your Airbnb profit potential in Puñal.
Seasonal Strategies for Maximizing Profit
- Peak Season: Maximize revenue through premium pricing and potentially longer minimum stays. Ensure high availability.
- Low Season: Offer competitive pricing, special promotions (e.g., extended stay discounts), and flexible cancellation policies. Target off-season travelers like remote workers or budget-conscious guests.
- Shoulder Seasons: Implement dynamic pricing that balances peak and low rates. Target weekend travelers or specific events. Offer slightly more flexible terms than peak season.
- Regularly analyze your own performance against these Puñal seasonality benchmarks and adjust your pricing and availability strategy accordingly.
Best Areas for Airbnb Investment in Puñal (2026)
Exploring the top neighborhoods for short-term rentals in Puñal? This section highlights key areas, outlining why they are attractive for hosts and guests, along with notable local attractions. Consider these locations based on your target guest profile and investment strategy.
| Neighborhood / Area | Why Host Here? (Target Guests & Appeal) | Key Attractions & Landmarks |
|---|---|---|
| Los Jardines | A sought-after residential and tourist area known for its lush green spaces and proximity to shopping centers. Ideal for families and travelers looking for a comfortable stay near amenities. | Jardín Botánico, Centro Comercial Plaza 10, Parque Nacional Jaragua, Catedral de Santiago |
| El Embrujo | An upscale neighborhood offering modern developments and a blend of residential and commercial options. Popular for both short-term rentals and longer stays due to its tranquility and accessibility. | Universidad Autónoma de Santo Domingo, Parque El Embrujo, Café Gran K, Café Cacao, Cuerpo de Bomberos de Santiago |
| Santiago City Center | The vibrant heart of Santiago with a mix of commerce, culture, and nightlife. Ideal for visitors wanting to experience the local scene and attractions firsthand. | Catedral de Santiago, Parque Central, Monumento a los Héroes de la Restauración, Casa de Las Huellas, Museo de Arte Moderno |
| La Mina | A historical neighborhood known for its cultural significance and local charm. Attracts tourists interested in experiencing authentic Dominican life. | Parque de la Mina, Iglesia Santa Ana, Calle Del Sol, Mercado de La Mina |
| Hato del Yaque | A quieter residential area, great for long-term stays. Attracts families and those seeking a peaceful environment close to the city. | Río Yaque del Norte, Parque Deportivo Hato del Yaque, Centro Educativo Renovación |
| Canca la Reyna | A growing neighborhood with modern infrastructure and a local feel, suitable for travelers looking to escape the hustle and bustle of the city. | Plaza Canca, Iglesia de Canca, Centro de Salud Canca |
| Cervantes | A trendy, up-and-coming area with a youthful vibe and close proximity to the university. Perfect for younger travelers and students. | Universidad Tecnológica de Santiago, Café La Delicia, Parque Cervantes |
| Pueblo Nuevo | A lively neighborhood that blends cultural attractions with local dining and nightlife, making it an ideal spot for tourists looking to explore Dominican culture. | Café El Punto, Iglesia del Pueblo Nuevo, La Cueva de Tainó |
Understanding Airbnb License Requirements & STR Laws in Puñal (2026)
While Puñal, Santiago, Dominican Republic currently shows low STR regulations, specific Airbnb license requirements might still exist or change. Always verify the latest short term rental regulations and Airbnb license requirements directly with local government authorities for Puñal to ensure full compliance before hosting.
(Source: AirROI data, 2026, based on 1% licensed listings)
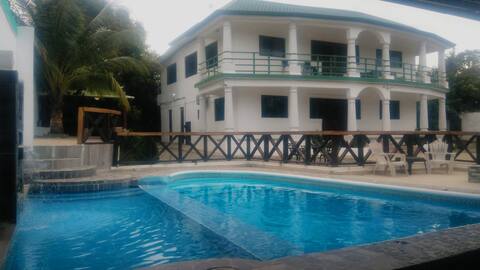
Top Performing Airbnb Properties in Puñal (2026)
Benchmark your potential! Explore examples of top-performing Airbnb properties in Puñalbased on Trailing Twelve Month (TTM) revenue. Analyze their characteristics, revenue, occupancy rate, and ADR to understand what drives success in this market.

Family Home with Pool & Jacuzzi
Entire Place • 4 bedrooms
5 Bedroom Villa In Santiago, Dominican Republic
Entire Place • 5 bedrooms

Dream Penthouse+Jacuzzi W/Hot Water+3BR w/AC+Pool
Entire Place • 3 bedrooms
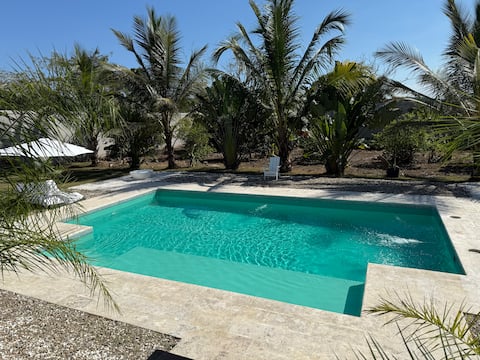
Tropical Paradise!
Entire Place • 4 bedrooms

Spacious Luxury PH- Jacuzzi. Pool Table, Bar, Gym
Entire Place • 5 bedrooms

Vacation Apt w/ Private Jacuzzi Area
Entire Place • 3 bedrooms
Note: Performance varies based on location, size, amenities, seasonality, and management quality. Data reflects the past 12 months.
Top Performing Airbnb Hosts in Puñal (2026)
Learn from the best! This table showcases top-performing Airbnb hosts in Puñal based on the number of properties managed and estimated total revenue over the past year. Analyze their scale and performance metrics.
| Host Name | Properties | Grossing Revenue | Stay Reviews | Avg Rating |
|---|---|---|---|---|
| Nestor | 5 | $76,544 | 162 | 4.92/5.0 |
| Heather | 1 | $56,737 | 19 | 4.95/5.0 |
| Jhoseph | 7 | $43,932 | 124 | 4.57/5.0 |
| J Carlos Retals | 1 | $41,955 | 93 | 4.76/5.0 |
| María J. | 3 | $33,417 | 20 | 4.82/5.0 |
| Christopher | 4 | $33,226 | 331 | 4.90/5.0 |
| Yessenia | 5 | $32,001 | 91 | 4.75/5.0 |
| Edison | 1 | $31,367 | 15 | 5.00/5.0 |
| Ismael | 1 | $29,514 | 39 | 4.79/5.0 |
| Luis | 1 | $25,547 | 99 | 4.95/5.0 |
Analyzing the strategies of top hosts, such as their property selection, pricing, and guest communication, can offer valuable lessons for optimizing your own Airbnb operations in Puñal.
Dive Deeper: Advanced Puñal STR Market Data (2026)
Ready to unlock more insights? AirROI provides access to advanced metrics and comprehensive Airbnb data for Puñal. Explore detailed analytics beyond this report to refine your investment strategy, optimize pricing, and maximize your vacation rental profits.
Explore Advanced MetricsPuñal Short-Term Rental Market Composition (2026): Property & Room Types
Room Type Distribution
Property Type Distribution
Market Composition Insights for Puñal
- The Puñal Airbnb market composition is heavily skewed towards Entire Home/Apt listings, which make up 99.6% of the 246 active rentals. This indicates strong guest preference for privacy and space.
- Looking at the property type distribution in Puñal, Apartment/Condo properties are the most common (91.9%), reflecting the local real estate landscape.
- Smaller segments like outdoor/unique, hotel/boutique (combined 1.2%) offer potential for unique stay experiences.
Puñal Airbnb Room Capacity Analysis (2026): Bedroom Distribution
Distribution of Listings by Number of Bedrooms
Room Capacity Insights for Puñal
- The dominant room capacity in Puñal is 3 bedrooms listings, making up 74.8% of the market. This suggests a strong demand for properties suitable for families or small groups.
- Together, 3 bedrooms and 2 bedrooms properties represent 89.8% of the active Airbnb listings in Puñal, indicating a high concentration in these sizes.
- A significant 81.7% of listings offer 3+ bedrooms, catering to larger groups and families seeking more space in Puñal.
Puñal Vacation Rental Guest Capacity Trends (2026)
Distribution of Listings by Guest Capacity
Guest Capacity Insights for Puñal
- The most common guest capacity trend in Puñal vacation rentals is listings accommodating 6 guests (66.3%). This suggests the primary traveler segment is likely larger groups.
- Properties designed for 6 guests and 4 guests dominate the Puñal STR market, accounting for 81.3% of listings.
- 77.7% of properties accommodate 6+ guests, serving the market segment for larger families or group travel in Puñal.
- On average, properties in Puñal are equipped to host 5.7 guests.
Puñal Airbnb Booking Patterns (2026): Available vs. Booked Days
Available Days Distribution
Booked Days Distribution
Booking Pattern Insights for Puñal
- The most common availability pattern in Puñal falls within the 271-366 days range, representing 60.6% of listings. This suggests many properties have significant open periods on their calendars.
- Approximately 80.9% of listings show high availability (181+ days open annually), indicating potential for increased bookings or specific owner usage patterns.
- For booked days, the 31-90 days range is most frequent in Puñal (37%), reflecting common guest stay durations or potential owner blocking patterns.
- A notable 19.1% of properties secure long booking periods (181+ days booked per year), highlighting successful long-term rental strategies or significant owner usage.
Puñal Airbnb Minimum Stay Requirements Analysis
Distribution of Listings by Minimum Night Requirement
1 Night
52 listings
21.1% of total
2 Nights
81 listings
32.9% of total
3 Nights
45 listings
18.3% of total
4-6 Nights
12 listings
4.9% of total
7-29 Nights
3 listings
1.2% of total
30+ Nights
53 listings
21.5% of total
Key Insights
- The most prevalent minimum stay requirement in Puñal is 2 Nights, adopted by 32.9% of listings. This highlights the market's preference for shorter, flexible bookings.
- A significant segment (21.5%) caters to monthly stays (30+ nights) in Puñal, pointing to opportunities in the extended-stay market.
Recommendations
- Align with the market by considering a 2 Nights minimum stay, as 32.9% of Puñal hosts use this setting.
- If feasible, allowing 1-night stays, especially midweek or during low season, could capture last-minute bookings, as only 21.1% currently do.
- Explore offering discounts for stays of 30+ nights to attract the 21.5% of the market seeking extended stays.
- Adjust minimum nights based on seasonality – potentially shorter during low season and longer during peak demand periods in Puñal.
Puñal Airbnb Cancellation Policy Trends Analysis (2026)
Limited
3 listings
1.2% of total
Flexible
127 listings
51.6% of total
Moderate
53 listings
21.5% of total
Firm
53 listings
21.5% of total
Strict
10 listings
4.1% of total
Cancellation Policy Insights for Puñal
- The prevailing Airbnb cancellation policy trend in Puñal is Flexible, used by 51.6% of listings.
- The market strongly favors guest-friendly terms, with 73.1% of listings offering Flexible or Moderate policies. This suggests guests in Puñal may expect booking flexibility.
- Strict cancellation policies are quite rare (4.1%), potentially making listings with this policy less competitive unless justified by high demand or property type.
Recommendations for Hosts
- Consider adopting a Flexible policy to align with the 51.6% market standard in Puñal.
- Given the high prevalence of Flexible policies (51.6%), offering this can enhance booking appeal, especially during shoulder seasons.
- Using a Strict policy might deter some guests, as only 4.1% of listings use it. Evaluate if potential revenue protection outweighs possible lower booking rates.
- Regularly review your cancellation policy against competitors and market demand shifts in Puñal.
Puñal STR Booking Lead Time Analysis (2026)
Average Booking Lead Time by Month
Booking Lead Time Insights for Puñal
- The overall average booking lead time for vacation rentals in Puñal is 20 days.
- Guests book furthest in advance for stays during December (average 37 days), likely coinciding with peak travel demand or local events.
- The shortest booking windows occur for stays in March (average 12 days), indicating more last-minute travel plans during this time.
- Seasonally, Summer (27 days avg.) sees the longest lead times, while Spring (16 days avg.) has the shortest, reflecting typical travel planning cycles.
Recommendations for Hosts
- Use the overall average lead time (20 days) as a baseline for your pricing and availability strategy in Puñal.
- For December stays, consider implementing length-of-stay discounts or slightly higher rates for bookings made less than 37 days out to capitalize on advance planning.
- During March, focus on last-minute booking availability and promotions, as guests book with very short notice (12 days avg.).
- Target marketing efforts for the Summer season well in advance (at least 27 days) to capture early planners.
- Monitor your own booking lead times against these Puñal averages to identify opportunities for dynamic pricing adjustments.
Popular & Essential Airbnb Amenities in Puñal (2026)
Amenity Prevalence
Amenity Insights for Puñal
- Essential amenities in Puñal that guests expect include: TV, Wifi, Air conditioning, Washer, Free parking on premises, Kitchen. Lacking these (any) could significantly impact bookings.
- Popular amenities like Iron, Hot water, Dishes and silverware are common but not universal. Offering these can provide a competitive edge.
Recommendations for Hosts
- Ensure your listing includes all essential amenities for Puñal: TV, Wifi, Air conditioning, Washer, Free parking on premises, Kitchen.
- Prioritize adding missing essentials: TV, Wifi, Air conditioning, Washer, Free parking on premises, Kitchen.
- Consider adding popular differentiators like Iron or Hot water to increase appeal.
- Highlight unique or less common amenities you offer (e.g., hot tub, dedicated workspace, EV charger) in your listing description and photos.
- Regularly check competitor amenities in Puñal to stay competitive.
Puñal Airbnb Guest Demographics & Profile Analysis (2026)
Guest Profile Summary for Puñal
- The typical guest profile for Airbnb in Puñal consists of predominantly international visitors (79%), with top international origins including Dominican Republic, typically belonging to the Post-2000s (Gen Z/Alpha) group (50%), primarily speaking Spanish or English.
- Domestic travelers account for 20.7% of guests.
- Key international markets include United States (71.6%) and Dominican Republic (20.7%).
- Top languages spoken are Spanish (46.2%) followed by English (44.9%).
- A significant demographic segment is the Post-2000s (Gen Z/Alpha) group, representing 50% of guests.
Recommendations for Hosts
- Focus marketing internationally, particularly towards travelers from Dominican Republic.
- Offer listing details and communication support in Spanish.
- Tailor amenities and listing descriptions to appeal to the dominant Post-2000s (Gen Z/Alpha) demographic (e.g., highlight fast WiFi, smart home features, local guides).
- Highlight unique local experiences or amenities relevant to the primary guest profile.
- Consider seasonal promotions aligned with peak travel times for key origin markets.
Nearby Short-Term Rental Market Comparison
How does the Puñal Airbnb market stack up against its neighbors? Compare key performance metrics like average monthly revenue, ADR, and occupancy rates in surrounding areas to understand the broader regional STR landscape.
| Market | Active Properties | Monthly Revenue | Daily Rate | Avg. Occupancy |
|---|---|---|---|---|
| Abreu | 15 | $2,503 | $204.50 | 26% |
| Juan Esteban | 12 | $1,703 | $346.19 | 21% |
| Punta Rucia;Damaris | 33 | $1,683 | $223.57 | 21% |
| Las Terrenas | 2,242 | $1,559 | $225.03 | 32% |
| Las Charcas | 57 | $1,432 | $304.97 | 19% |
| Punta Rucia | 14 | $1,403 | $203.53 | 21% |
| Sosúa | 1,556 | $1,233 | $208.18 | 31% |
| Buena Vista | 22 | $1,170 | $235.10 | 24% |
| Cabarete | 1,025 | $1,066 | $159.24 | 35% |
| Tamboril | 33 | $1,050 | $135.33 | 27% |