Bellavista Airbnb Market Analysis 2026: Short Term Rental Data & Vacation Rental Statistics in Galápagos, Ecuador
Is Airbnb profitable in Bellavista in 2026? Explore comprehensive Airbnb analytics for Bellavista, Galápagos, Ecuador to uncover income potential. This 2026 STR market report for Bellavista, based on AirROI data from May 2024 to April 2025, reveals key trends in the niche market of 19 active listings.
Whether you're considering an Airbnb investment in Bellavista, optimizing your existing vacation rental, or exploring rental arbitrage opportunities, understanding the Bellavista Airbnb data is crucial. Leveraging the low regulation environment is key to maximizing your short term rental income potential. Let's dive into the specifics.
Key Bellavista Airbnb Performance Metrics Overview
Monthly Airbnb Revenue Variations & Income Potential in Bellavista (2026)
Understanding the monthly revenue variations for Airbnb listings in Bellavista is key to maximizing your short term rental income potential. Seasonality significantly impacts earnings. Our analysis, based on data from the past 12 months, shows that the peak revenue month for STRs in Bellavista is typically February, while August often presents the lowest earnings, highlighting opportunities for strategic pricing adjustments during shoulder and low seasons. Explore the typical Airbnb income in Bellavista across different performance tiers:
- Best-in-class properties (Top 10%) achieve $4,466+ monthly, often utilizing dynamic pricing and superior guest experiences.
- Strong performing properties (Top 25%) earn $2,425 or more, indicating effective management and desirable locations/amenities.
- Typical properties (Median) generate around $1,076 per month, representing the average market performance.
- Entry-level properties (Bottom 25%) see earnings around $486, often with potential for optimization.
Average Monthly Airbnb Earnings Trend in Bellavista
Bellavista Airbnb Occupancy Rate Trends (2026)
Maximize your bookings by understanding the Bellavista STR occupancy trends. Seasonal demand shifts significantly influence how often properties are booked. Typically, Julysees the highest demand (peak season occupancy), while May experiences the lowest (low season). Effective strategies, like adjusting minimum stays or offering promotions, can boost occupancy during slower periods. Here's how different property tiers perform in Bellavista:
- Best-in-class properties (Top 10%) achieve 52%+ occupancy, indicating high desirability and potentially optimized availability.
- Strong performing properties (Top 25%) maintain 37% or higher occupancy, suggesting good market fit and guest satisfaction.
- Typical properties (Median) have an occupancy rate around 19%.
- Entry-level properties (Bottom 25%) average 12% occupancy, potentially facing higher vacancy.
Average Monthly Occupancy Rate Trend in Bellavista
Average Daily Rate (ADR) Airbnb Trends in Bellavista (2026)
Effective short term rental pricing strategy in Bellavista involves understanding monthly ADR fluctuations. The Average Daily Rate (ADR) for Airbnb in Bellavista typically peaks in January and dips lowest during September. Leveraging Airbnb dynamic pricing tools or strategies based on this seasonality can significantly boost revenue. Here's a look at the typical nightly rates achieved:
- Best-in-class properties (Top 10%) command rates of $241+ per night, often due to premium features or locations.
- Strong performing properties (Top 25%) achieve nightly rates of $124 or more.
- Typical properties (Median) charge around $53 per night.
- Entry-level properties (Bottom 25%) earn around $24 per night.
Average Daily Rate (ADR) Trend by Month in Bellavista
Get Live Bellavista Market Intelligence 👇
Explore Real-time Analytics
Airbnb Seasonality Analysis & Trends in Bellavista (2025)
Peak Season (February, May, June)
- Revenue averages $2,368 per month
- Occupancy rates average 21.0%
- Daily rates average $96
Shoulder Season
- Revenue averages $1,684 per month
- Occupancy maintains around 27.4%
- Daily rates hold near $102
Low Season (July, August, September)
- Revenue drops to average $1,175 per month
- Occupancy decreases to average 27.6%
- Daily rates adjust to average $89
Seasonality Insights for Bellavista
- The Airbnb seasonality in Bellavista shows highly seasonal trends requiring careful strategy. While the sections above show seasonal averages, it's also insightful to look at the extremes:
- During the high season, the absolute peak month showcases Bellavista's highest earning potential, with monthly revenues capable of climbing to $2,849, occupancy reaching a high of 39.1%, and ADRs peaking at $120.
- Conversely, the slowest single month of the year, typically falling within the low season, marks the market's lowest point. In this month, revenue might dip to $1,078, occupancy could drop to 12.9%, and ADRs may adjust down to $88.
- Understanding both the seasonal averages and these monthly peaks and troughs in revenue, occupancy, and ADR is crucial for maximizing your Airbnb profit potential in Bellavista.
Seasonal Strategies for Maximizing Profit
- Peak Season: Maximize revenue through premium pricing and potentially longer minimum stays. Ensure high availability.
- Low Season: Offer competitive pricing, special promotions (e.g., extended stay discounts), and flexible cancellation policies. Target off-season travelers like remote workers or budget-conscious guests.
- Shoulder Seasons: Implement dynamic pricing that balances peak and low rates. Target weekend travelers or specific events. Offer slightly more flexible terms than peak season.
- Regularly analyze your own performance against these Bellavista seasonality benchmarks and adjust your pricing and availability strategy accordingly.
Best Areas for Airbnb Investment in Bellavista (2026)
Exploring the top neighborhoods for short-term rentals in Bellavista? This section highlights key areas, outlining why they are attractive for hosts and guests, along with notable local attractions. Consider these locations based on your target guest profile and investment strategy.
| Neighborhood / Area | Why Host Here? (Target Guests & Appeal) | Key Attractions & Landmarks |
|---|---|---|
| Puerto Ayora | The largest town in the Galápagos and the main tourist hub, known for its vibrant atmosphere, oceanfront views, and access to tours of the islands. Perfect for attracting tourists looking for convenience and amenities. | Charles Darwin Research Station, Tortuga Bay, Ferry to nearby islands, Restaurants and shops, Local markets |
| Santa Cruz Island | One of the most populated islands in the Galápagos, offering diverse landscapes from beaches to highlands. It's an ideal area for travelers looking to explore the unique wildlife and natural beauty of the islands. | Los Gemelos (the twins), Garrapatero Beach, El Chato Tortoise Reserve, Highlands of Santa Cruz, Lava tubes |
| Isabela Island | The largest island in the Galápagos, known for its stunning volcanic landscapes and pristine beaches. A great location for eco-tourism and outdoor activities, attracting visitors seeking adventure and nature. | Sierra Negra Volcano, Concha de Perla, Tortoise Breeding Center, Flamingo Lagoon, Wall of Tears |
| San Cristóbal Island | Home to the capital of the Galápagos, it attracts tourists for its rich history and vibrant local culture. Ideal for visitors looking to experience both natural beauty and local attractions. | Interpretation Center, Frigatebird Hill, La Lobería Beach, Puerto Chino Beach, El Junco Lagoon |
| Northeast Coast of Santa Cruz | A quieter area of Santa Cruz that offers beautiful beaches and opportunities to see wildlife. Great for travelers seeking relaxation and nature. | Tortuga Bay, Las Grietas, Blanco Beach, Puerto Ayora nearby, Diving and snorkeling spots |
| Floreana Island | Known for its unique history and marine life, this smaller island offers a more secluded getaway. Ideal for eco-friendly lodging and travelers looking to escape the crowds. | Post Office Bay, Devil's Crown snorkeling, Cerro Alarcon, Black Beach, Asilo de la Paz |
| Rábida Island | Famous for its red sandy beaches and diverse wildlife, this island is perfect for those keen on nature and photography. Attractions include scenic hikes and snorkeling opportunities. | Rábida Beach, Snorkeling spots, Bird-watching, Diverse volcanic landscapes, Unique flora |
| Genovesa Island | Often referred to as 'Bird Island', it's a paradise for bird watchers and nature lovers, making it perfect for Airbnb hosts targeting wildlife enthusiasts. | Darwin Bay, El Barranco, Highly diverse bird species, Snorkeling with marine life, Stunning landscapes |
Understanding Airbnb License Requirements & STR Laws in Bellavista (2026)
While Bellavista, Galápagos, Ecuador currently shows low STR regulations, specific Airbnb license requirements might still exist or change. Always verify the latest short term rental regulations and Airbnb license requirements directly with local government authorities for Bellavista to ensure full compliance before hosting.
(Source: AirROI data, 2026, finding no licensed listings among those analyzed)
Top Performing Airbnb Properties in Bellavista (2026)
Benchmark your potential! Explore examples of top-performing Airbnb properties in Bellavistabased on Trailing Twelve Month (TTM) revenue. Analyze their characteristics, revenue, occupancy rate, and ADR to understand what drives success in this market.

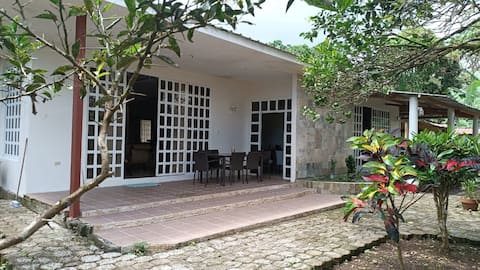
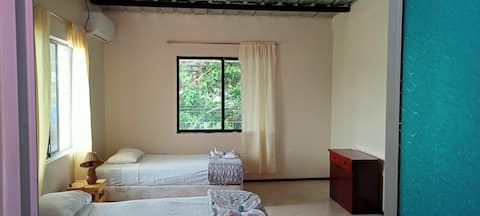
Ocean view retreat in the Galapagos highlands
Entire Place • 2 bedrooms

Hotel Tortuga Bay EC
Private Room • 3 bedrooms
Alojamiento entero Galápagos, Puerto Ayora Ecuador
Entire Place • 4 bedrooms

Hotel Tortuga Bay EC
Private Room • 4 bedrooms

Cozy little villa in Galapagos
Entire Place • 1 bedroom
Departamento en bellavista
Private Room • 2 bedrooms
Note: Performance varies based on location, size, amenities, seasonality, and management quality. Data reflects the past 12 months.
Top Performing Airbnb Hosts in Bellavista (2026)
Learn from the best! This table showcases top-performing Airbnb hosts in Bellavista based on the number of properties managed and estimated total revenue over the past year. Analyze their scale and performance metrics.
| Host Name | Properties | Grossing Revenue | Stay Reviews | Avg Rating |
|---|---|---|---|---|
| Host #458121968 | 2 | $36,540 | 0 | 0.00/5.0 |
| Heinke | 1 | $28,963 | 17 | 5.00/5.0 |
| Host #30814173 | 1 | $14,048 | 0 | 0.00/5.0 |
| Aura | 1 | $6,620 | 16 | 5.00/5.0 |
| Host #239204345 | 1 | $5,680 | 0 | 0.00/5.0 |
| María | 1 | $3,974 | 3 | 5.00/5.0 |
| Host #369068316 | 1 | $3,632 | 0 | 0.00/5.0 |
| Wilson | 3 | $3,626 | 6 | 1.40/5.0 |
| Host #143950205 | 1 | $2,866 | 0 | 0.00/5.0 |
| Host #485775126 | 1 | $2,802 | 0 | 0.00/5.0 |
Analyzing the strategies of top hosts, such as their property selection, pricing, and guest communication, can offer valuable lessons for optimizing your own Airbnb operations in Bellavista.
Dive Deeper: Advanced Bellavista STR Market Data (2026)
Ready to unlock more insights? AirROI provides access to advanced metrics and comprehensive Airbnb data for Bellavista. Explore detailed analytics beyond this report to refine your investment strategy, optimize pricing, and maximize your vacation rental profits.
Explore Advanced MetricsBellavista Short-Term Rental Market Composition (2026): Property & Room Types
Room Type Distribution
Property Type Distribution
Market Composition Insights for Bellavista
- The Bellavista Airbnb market composition is heavily skewed towards Entire Home/Apt listings, which make up 78.9% of the 19 active rentals. This indicates strong guest preference for privacy and space.
- Looking at the property type distribution in Bellavista, House properties are the most common (52.6%), reflecting the local real estate landscape.
- Houses represent a significant 52.6% portion, catering likely to families or larger groups.
- The presence of 15.8% Hotel/Boutique listings indicates integration with traditional hospitality.
Bellavista Airbnb Room Capacity Analysis (2026): Bedroom Distribution
Distribution of Listings by Number of Bedrooms
Room Capacity Insights for Bellavista
- The dominant room capacity in Bellavista is 2 bedrooms listings, making up 42.1% of the market. This suggests a strong demand for properties suitable for couples or solo travelers.
- Together, 2 bedrooms and 1 bedroom properties represent 57.9% of the active Airbnb listings in Bellavista, indicating a high concentration in these sizes.
- A significant 42.1% of listings offer 3+ bedrooms, catering to larger groups and families seeking more space in Bellavista.
Bellavista Vacation Rental Guest Capacity Trends (2026)
Distribution of Listings by Guest Capacity
Guest Capacity Insights for Bellavista
- The most common guest capacity trend in Bellavista vacation rentals is listings accommodating 4 guests (36.8%). This suggests the primary traveler segment is likely small families or groups.
- Properties designed for 4 guests and 6 guests dominate the Bellavista STR market, accounting for 57.9% of listings.
- 47.4% of properties accommodate 6+ guests, serving the market segment for larger families or group travel in Bellavista.
- On average, properties in Bellavista are equipped to host 5.1 guests.
Bellavista Airbnb Booking Patterns (2026): Available vs. Booked Days
Available Days Distribution
Booked Days Distribution
Booking Pattern Insights for Bellavista
- The most common availability pattern in Bellavista falls within the 271-366 days range, representing 78.9% of listings. This suggests many properties have significant open periods on their calendars.
- Approximately 100.0% of listings show high availability (181+ days open annually), indicating potential for increased bookings or specific owner usage patterns.
- For booked days, the 1-30 days range is most frequent in Bellavista (42.1%), reflecting common guest stay durations or potential owner blocking patterns.
Bellavista Airbnb Minimum Stay Requirements Analysis
Distribution of Listings by Minimum Night Requirement
1 Night
12 listings
63.2% of total
2 Nights
3 listings
15.8% of total
3 Nights
3 listings
15.8% of total
30+ Nights
1 listings
5.3% of total
Key Insights
- The most prevalent minimum stay requirement in Bellavista is 1 Night, adopted by 63.2% of listings. This highlights the market's preference for shorter, flexible bookings.
- A strong majority (79.0%) of the Bellavista Airbnb data shows acceptance of very short stays (1-2 nights), indicating a dynamic, high-turnover market.
Recommendations
- Align with the market by considering a 1 Night minimum stay, as 63.2% of Bellavista hosts use this setting.
- Explore offering discounts for stays of 30+ nights to attract the 5.3% of the market seeking extended stays.
- Adjust minimum nights based on seasonality – potentially shorter during low season and longer during peak demand periods in Bellavista.
Bellavista Airbnb Cancellation Policy Trends Analysis (2026)
Flexible
4 listings
40% of total
Moderate
1 listings
10% of total
Firm
2 listings
20% of total
Strict
3 listings
30% of total
Cancellation Policy Insights for Bellavista
- The prevailing Airbnb cancellation policy trend in Bellavista is Flexible, used by 40% of listings.
- There's a relatively balanced mix between guest-friendly (50.0%) and stricter (50.0%) policies, offering choices for different guest needs.
Recommendations for Hosts
- Consider adopting a Flexible policy to align with the 40% market standard in Bellavista.
- Regularly review your cancellation policy against competitors and market demand shifts in Bellavista.
Bellavista STR Booking Lead Time Analysis (2026)
Average Booking Lead Time by Month
Booking Lead Time Insights for Bellavista
- The overall average booking lead time for vacation rentals in Bellavista is 52 days.
- Guests book furthest in advance for stays during June (average 141 days), likely coinciding with peak travel demand or local events.
- The shortest booking windows occur for stays in September (average 16 days), indicating more last-minute travel plans during this time.
- Seasonally, Summer (63 days avg.) sees the longest lead times, while Fall (29 days avg.) has the shortest, reflecting typical travel planning cycles.
Recommendations for Hosts
- Use the overall average lead time (52 days) as a baseline for your pricing and availability strategy in Bellavista.
- For June stays, consider implementing length-of-stay discounts or slightly higher rates for bookings made less than 141 days out to capitalize on advance planning.
- Target marketing efforts for the Summer season well in advance (at least 63 days) to capture early planners.
- Monitor your own booking lead times against these Bellavista averages to identify opportunities for dynamic pricing adjustments.
Popular & Essential Airbnb Amenities in Bellavista (2026)
Amenity Prevalence
Amenity Insights for Bellavista
- Essential amenities in Bellavista that guests expect include: Wifi, Essentials. Lacking these (any) could significantly impact bookings.
- Popular amenities like Kitchen, Hot water, Outdoor dining area are common but not universal. Offering these can provide a competitive edge.
Recommendations for Hosts
- Ensure your listing includes all essential amenities for Bellavista: Wifi, Essentials.
- Consider adding popular differentiators like Kitchen or Hot water to increase appeal.
- Highlight unique or less common amenities you offer (e.g., hot tub, dedicated workspace, EV charger) in your listing description and photos.
- Regularly check competitor amenities in Bellavista to stay competitive.
Bellavista Airbnb Guest Demographics & Profile Analysis (2026)
Guest Profile Summary for Bellavista
- The typical guest profile for Airbnb in Bellavista consists of predominantly international visitors (84%), with top international origins including United States, typically belonging to the Post-2000s (Gen Z/Alpha) group (50%), primarily speaking English or Spanish.
- Domestic travelers account for 16.0% of guests.
- Key international markets include Germany (20%) and United States (20%).
- Top languages spoken are English (50%) followed by Spanish (31.8%).
- A significant demographic segment is the Post-2000s (Gen Z/Alpha) group, representing 50% of guests.
Recommendations for Hosts
- Focus marketing internationally, particularly towards travelers from United States.
- Tailor amenities and listing descriptions to appeal to the dominant Post-2000s (Gen Z/Alpha) demographic (e.g., highlight fast WiFi, smart home features, local guides).
- Highlight unique local experiences or amenities relevant to the primary guest profile.
- Consider seasonal promotions aligned with peak travel times for key origin markets.
Nearby Short-Term Rental Market Comparison
How does the Bellavista Airbnb market stack up against its neighbors? Compare key performance metrics like average monthly revenue, ADR, and occupancy rates in surrounding areas to understand the broader regional STR landscape.
| Market | Active Properties | Monthly Revenue | Daily Rate | Avg. Occupancy |
|---|---|---|---|---|
| Parroquia Bella Vista | 12 | $1,011 | $117.54 | 29% |
| Puerto Ayora | 360 | $860 | $100.07 | 32% |
| Puerto Villamil | 118 | $710 | $88.24 | 29% |
| Parroquia Puerto Baquerizo Moreno | 229 | $694 | $72.12 | 35% |