ADH Dheraa Al Bahri Airbnb Market Analysis 2025: Short Term Rental Data & Vacation Rental Statistics in Alexandria Governorate, Egypt
Is Airbnb profitable in ADH Dheraa Al Bahri in 2025? Explore comprehensive Airbnb analytics for ADH Dheraa Al Bahri, Alexandria Governorate, Egypt to uncover income potential. This 2025 STR market report for ADH Dheraa Al Bahri, based on AirROI data from May 2024 to April 2025, reveals key trends in the niche market of 28 active listings.
Whether you're considering an Airbnb investment in ADH Dheraa Al Bahri, optimizing your existing vacation rental, or exploring rental arbitrage opportunities, understanding the ADH Dheraa Al Bahri Airbnb data is crucial. Leveraging the low regulation environment is key to maximizing your short term rental income potential. Let's dive into the specifics.
Key ADH Dheraa Al Bahri Airbnb Performance Metrics Overview
Monthly Airbnb Revenue Variations & Income Potential in ADH Dheraa Al Bahri (2025)
Understanding the monthly revenue variations for Airbnb listings in ADH Dheraa Al Bahri is key to maximizing your short term rental income potential. Seasonality significantly impacts earnings. Our analysis, based on data from the past 12 months, shows that the peak revenue month for STRs in ADH Dheraa Al Bahri is typically May, while December often presents the lowest earnings, highlighting opportunities for strategic pricing adjustments during shoulder and low seasons. Explore the typical Airbnb income in ADH Dheraa Al Bahri across different performance tiers:
- Best-in-class properties (Top 10%) achieve $1,443+ monthly, often utilizing dynamic pricing and superior guest experiences.
- Strong performing properties (Top 25%) earn $973 or more, indicating effective management and desirable locations/amenities.
- Typical properties (Median) generate around $347 per month, representing the average market performance.
- Entry-level properties (Bottom 25%) see earnings around $184, often with potential for optimization.
Average Monthly Airbnb Earnings Trend in ADH Dheraa Al Bahri
ADH Dheraa Al Bahri Airbnb Occupancy Rate Trends (2025)
Maximize your bookings by understanding the ADH Dheraa Al Bahri STR occupancy trends. Seasonal demand shifts significantly influence how often properties are booked. Typically, Augustsees the highest demand (peak season occupancy), while June experiences the lowest (low season). Effective strategies, like adjusting minimum stays or offering promotions, can boost occupancy during slower periods. Here's how different property tiers perform in ADH Dheraa Al Bahri:
- Best-in-class properties (Top 10%) achieve 41%+ occupancy, indicating high desirability and potentially optimized availability.
- Strong performing properties (Top 25%) maintain 37% or higher occupancy, suggesting good market fit and guest satisfaction.
- Typical properties (Median) have an occupancy rate around 25%.
- Entry-level properties (Bottom 25%) average 16% occupancy, potentially facing higher vacancy.
Average Monthly Occupancy Rate Trend in ADH Dheraa Al Bahri
Average Daily Rate (ADR) Airbnb Trends in ADH Dheraa Al Bahri (2025)
Effective short term rental pricing strategy in ADH Dheraa Al Bahri involves understanding monthly ADR fluctuations. The Average Daily Rate (ADR) for Airbnb in ADH Dheraa Al Bahri typically peaks in July and dips lowest during December. Leveraging Airbnb dynamic pricing tools or strategies based on this seasonality can significantly boost revenue. Here's a look at the typical nightly rates achieved:
- Best-in-class properties (Top 10%) command rates of $142+ per night, often due to premium features or locations.
- Strong performing properties (Top 25%) achieve nightly rates of $72 or more.
- Typical properties (Median) charge around $32 per night.
- Entry-level properties (Bottom 25%) earn around $19 per night.
Average Daily Rate (ADR) Trend by Month in ADH Dheraa Al Bahri
Get Live ADH Dheraa Al Bahri Market Intelligence 👇

Explore Real-time Analytics
Airbnb Seasonality Analysis & Trends in ADH Dheraa Al Bahri (2025)
Peak Season (May, June, January)
- Revenue averages $1,277 per month
- Occupancy rates average 16.6%
- Daily rates average $58
Shoulder Season
- Revenue averages $667 per month
- Occupancy maintains around 32.2%
- Daily rates hold near $55
Low Season (September, October, December)
- Revenue drops to average $180 per month
- Occupancy decreases to average 28.0%
- Daily rates adjust to average $57
Seasonality Insights for ADH Dheraa Al Bahri
- The Airbnb seasonality in ADH Dheraa Al Bahri shows highly seasonal trends requiring careful strategy. While the sections above show seasonal averages, it's also insightful to look at the extremes:
- During the high season, the absolute peak month showcases ADH Dheraa Al Bahri's highest earning potential, with monthly revenues capable of climbing to $1,433, occupancy reaching a high of 41.9%, and ADRs peaking at $66.
- Conversely, the slowest single month of the year, typically falling within the low season, marks the market's lowest point. In this month, revenue might dip to $94, occupancy could drop to 11.1%, and ADRs may adjust down to $44.
- Understanding both the seasonal averages and these monthly peaks and troughs in revenue, occupancy, and ADR is crucial for maximizing your Airbnb profit potential in ADH Dheraa Al Bahri.
Seasonal Strategies for Maximizing Profit
- Peak Season: Maximize revenue through premium pricing and potentially longer minimum stays. Ensure high availability.
- Low Season: Offer competitive pricing, special promotions (e.g., extended stay discounts), and flexible cancellation policies. Target off-season travelers like remote workers or budget-conscious guests.
- Shoulder Seasons: Implement dynamic pricing that balances peak and low rates. Target weekend travelers or specific events. Offer slightly more flexible terms than peak season.
- Regularly analyze your own performance against these ADH Dheraa Al Bahri seasonality benchmarks and adjust your pricing and availability strategy accordingly.
Best Areas for Airbnb Investment in ADH Dheraa Al Bahri (2025)
Exploring the top neighborhoods for short-term rentals in ADH Dheraa Al Bahri? This section highlights key areas, outlining why they are attractive for hosts and guests, along with notable local attractions. Consider these locations based on your target guest profile and investment strategy.
| Neighborhood / Area | Why Host Here? (Target Guests & Appeal) | Key Attractions & Landmarks |
|---|---|---|
| Corniche Road | Popular waterfront area offering stunning views of the Mediterranean Sea. Ideal for tourists looking for relaxing beach experiences and proximity to cafes and restaurants. | Alexandria Library, Stanley Bridge, Qaitbay Citadel, Montazah Palace, Corniche Promenade |
| Downtown Alexandria | Cultural and historical heart of Alexandria, filled with markets, restaurants, and historical sites. Great for tourists interested in exploring local culture and history. | Alexandria National Museum, Pompey's Pillar, Roman Amphitheatre, El-Hakim Mosque, Old Market Square |
| Montazah | Famous for its beautiful parks and the Montazah Palace. A serene area for families and tourists seeking relaxation and natural beauty. | Montazah Palace Gardens, Montazah Beach, Royal Gardens, Kite Beach, Fishing Village |
| Mansheya | A vibrant neighborhood known for its shopping and local cuisine. It attracts tourists looking to experience authentic Egyptian street life. | Mansheya Square, Souk Al-Attarin, Restaurants and Cafes, Street Markets |
| Maamoura | Known for its sandy beaches and resorts, attracting families and beachgoers. Ideal for those looking to enjoy sun and sea activities. | Maamoura Beach, Beach Resorts, Water Sports, Local Seafood Restaurants |
| Roushdy | A residential area with a mix of locals and expats. It offers a quieter experience with access to amenities and local parks. | Roushdy Beach, Public Parks, Nearby Shopping Areas |
| Alexandria Port | A historic and economic hub where tourists can witness the maritime culture of the city. It also offers local eateries and markets. | Port of Alexandria, Fishermen's Wharf, Local Fish Markets |
| El Montazah | Known for its expansive gardens and beaches, popular with visitors seeking recreational activities and picnics. | El Montazah Park, El Montazah Beach, Cafes and Restaurants on the Beach, Scenic Views |
Understanding Airbnb License Requirements & STR Laws in ADH Dheraa Al Bahri (2025)
While ADH Dheraa Al Bahri, Alexandria Governorate, Egypt currently shows low STR regulations, specific Airbnb license requirements might still exist or change. Always verify the latest short term rental regulations and Airbnb license requirements directly with local government authorities for ADH Dheraa Al Bahri to ensure full compliance before hosting.
(Source: AirROI data, 2025, finding no licensed listings among those analyzed)
Top Performing Airbnb Properties in ADH Dheraa Al Bahri (2025)
Benchmark your potential! Explore examples of top-performing Airbnb properties in ADH Dheraa Al Bahribased on Trailing Twelve Month (TTM) revenue. Analyze their characteristics, revenue, occupancy rate, and ADR to understand what drives success in this market.
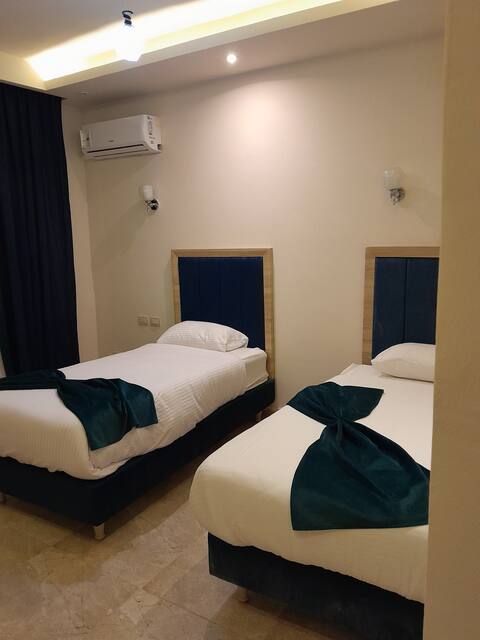
شقة مكيفة SOL HOTEL أمام مراسي
Private Room • 2 bedrooms
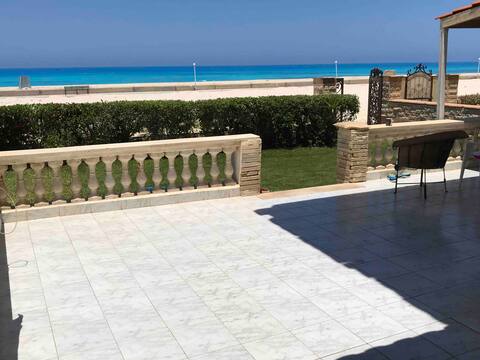
Open Sea View Luxury villa in North Coast/Alex
Entire Place • 3 bedrooms
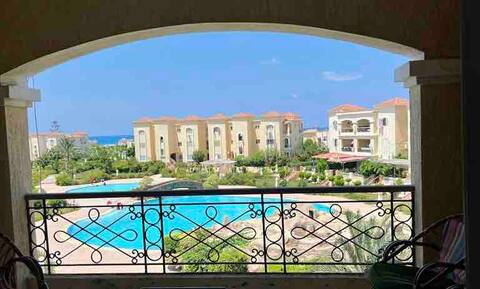
Kreer Gardens 3 bedroom Chalet
Entire Place • 3 bedrooms
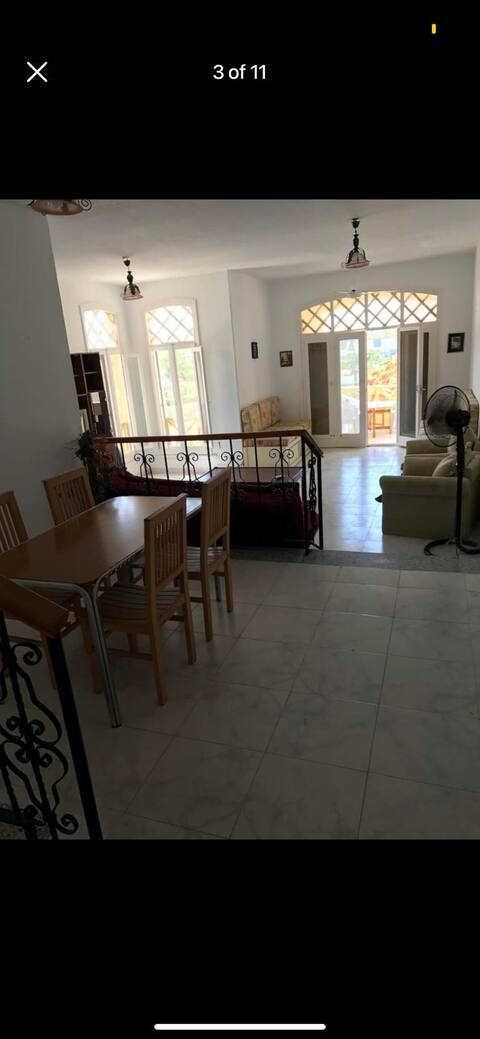
Mena3 NorthCoast- 2 bedroom flat
Entire Place • 2 bedrooms

Flores casas de playa 007
Entire Place • 2 bedrooms
ElShorouq - 3 bedroom Villa, private pool- Makanak
Entire Place • 3 bedrooms
Note: Performance varies based on location, size, amenities, seasonality, and management quality. Data reflects the past 12 months.
Top Performing Airbnb Hosts in ADH Dheraa Al Bahri (2025)
Learn from the best! This table showcases top-performing Airbnb hosts in ADH Dheraa Al Bahri based on the number of properties managed and estimated total revenue over the past year. Analyze their scale and performance metrics.
| Host Name | Properties | Grossing Revenue | Stay Reviews | Avg Rating |
|---|---|---|---|---|
| Host #369273576 | 1 | $17,003 | 0 | 0.00/5.0 |
| Host #485803687 | 1 | $6,487 | 0 | 0.00/5.0 |
| Sarah | 3 | $6,185 | 27 | 2.74/5.0 |
| Mohamed | 2 | $6,112 | 3 | 2.33/5.0 |
| Host #491072389 | 1 | $6,051 | 1 | 0.00/5.0 |
| Host #3470440 | 1 | $6,018 | 0 | 0.00/5.0 |
| Host #39436935 | 1 | $4,638 | 0 | 0.00/5.0 |
| Host #480506673 | 1 | $4,433 | 0 | 0.00/5.0 |
| Host #207361546 | 2 | $3,941 | 0 | 0.00/5.0 |
| Host #498937083 | 3 | $3,754 | 0 | 0.00/5.0 |
Analyzing the strategies of top hosts, such as their property selection, pricing, and guest communication, can offer valuable lessons for optimizing your own Airbnb operations in ADH Dheraa Al Bahri.
Dive Deeper: Advanced ADH Dheraa Al Bahri STR Market Data (2025)
Ready to unlock more insights? AirROI provides access to advanced metrics and comprehensive Airbnb data for ADH Dheraa Al Bahri. Explore detailed analytics beyond this report to refine your investment strategy, optimize pricing, and maximize your vacation rental profits.
Explore Advanced MetricsADH Dheraa Al Bahri Short-Term Rental Market Composition (2025): Property & Room Types
Room Type Distribution
Property Type Distribution
Market Composition Insights for ADH Dheraa Al Bahri
- The ADH Dheraa Al Bahri Airbnb market composition is heavily skewed towards Entire Home/Apt listings, which make up 78.6% of the 28 active rentals. This indicates strong guest preference for privacy and space.
- Looking at the property type distribution in ADH Dheraa Al Bahri, Apartment/Condo properties are the most common (85.7%), reflecting the local real estate landscape.
- The presence of 7.1% Hotel/Boutique listings indicates integration with traditional hospitality.
ADH Dheraa Al Bahri Airbnb Room Capacity Analysis (2025): Bedroom Distribution
Distribution of Listings by Number of Bedrooms
Room Capacity Insights for ADH Dheraa Al Bahri
- The dominant room capacity in ADH Dheraa Al Bahri is 2 bedrooms listings, making up 60.7% of the market. This suggests a strong demand for properties suitable for couples or solo travelers.
- Together, 2 bedrooms and 1 bedroom properties represent 82.1% of the active Airbnb listings in ADH Dheraa Al Bahri, indicating a high concentration in these sizes.
ADH Dheraa Al Bahri Vacation Rental Guest Capacity Trends (2025)
Distribution of Listings by Guest Capacity
Guest Capacity Insights for ADH Dheraa Al Bahri
- The most common guest capacity trend in ADH Dheraa Al Bahri vacation rentals is listings accommodating 5 guests (28.6%). This suggests the primary traveler segment is likely larger groups.
- Properties designed for 5 guests and 4 guests dominate the ADH Dheraa Al Bahri STR market, accounting for 50.0% of listings.
- 21.4% of properties accommodate 6+ guests, serving the market segment for larger families or group travel in ADH Dheraa Al Bahri.
- On average, properties in ADH Dheraa Al Bahri are equipped to host 4.4 guests.
ADH Dheraa Al Bahri Airbnb Booking Patterns (2025): Available vs. Booked Days
Available Days Distribution
Booked Days Distribution
Booking Pattern Insights for ADH Dheraa Al Bahri
- The most common availability pattern in ADH Dheraa Al Bahri falls within the 271-366 days range, representing 96.4% of listings. This suggests many properties have significant open periods on their calendars.
- Approximately 96.4% of listings show high availability (181+ days open annually), indicating potential for increased bookings or specific owner usage patterns.
- For booked days, the 31-90 days range is most frequent in ADH Dheraa Al Bahri (85.7%), reflecting common guest stay durations or potential owner blocking patterns.
- A notable 3.6% of properties secure long booking periods (181+ days booked per year), highlighting successful long-term rental strategies or significant owner usage.
ADH Dheraa Al Bahri Airbnb Minimum Stay Requirements Analysis
Distribution of Listings by Minimum Night Requirement
1 Night
17 listings
73.9% of total
2 Nights
2 listings
8.7% of total
3 Nights
4 listings
17.4% of total
Key Insights
- The most prevalent minimum stay requirement in ADH Dheraa Al Bahri is 1 Night, adopted by 73.9% of listings. This highlights the market's preference for shorter, flexible bookings.
- A strong majority (82.6%) of the ADH Dheraa Al Bahri Airbnb data shows acceptance of very short stays (1-2 nights), indicating a dynamic, high-turnover market.
Recommendations
- Align with the market by considering a 1 Night minimum stay, as 73.9% of ADH Dheraa Al Bahri hosts use this setting.
- Adjust minimum nights based on seasonality – potentially shorter during low season and longer during peak demand periods in ADH Dheraa Al Bahri.
ADH Dheraa Al Bahri Airbnb Cancellation Policy Trends Analysis (2025)
Moderate
3 listings
75% of total
Firm
1 listings
25% of total
Cancellation Policy Insights for ADH Dheraa Al Bahri
- The prevailing Airbnb cancellation policy trend in ADH Dheraa Al Bahri is Moderate, used by 75% of listings.
- The market strongly favors guest-friendly terms, with 75.0% of listings offering Flexible or Moderate policies. This suggests guests in ADH Dheraa Al Bahri may expect booking flexibility.
Recommendations for Hosts
- Consider adopting a Moderate policy to align with the 75% market standard in ADH Dheraa Al Bahri.
- Regularly review your cancellation policy against competitors and market demand shifts in ADH Dheraa Al Bahri.
ADH Dheraa Al Bahri STR Booking Lead Time Analysis (2025)
Average Booking Lead Time by Month
Booking Lead Time Insights for ADH Dheraa Al Bahri
- The overall average booking lead time for vacation rentals in ADH Dheraa Al Bahri is 9 days.
- Guests book furthest in advance for stays during February (average 18 days), likely coinciding with peak travel demand or local events.
- The shortest booking windows occur for stays in November (average 4 days), indicating more last-minute travel plans during this time.
- Seasonally, Summer (12 days avg.) sees the longest lead times, while Fall (5 days avg.) has the shortest, reflecting typical travel planning cycles.
Recommendations for Hosts
- Use the overall average lead time (9 days) as a baseline for your pricing and availability strategy in ADH Dheraa Al Bahri.
- Target marketing efforts for the Summer season well in advance (at least 12 days) to capture early planners.
- Monitor your own booking lead times against these ADH Dheraa Al Bahri averages to identify opportunities for dynamic pricing adjustments.
Popular & Essential Airbnb Amenities in ADH Dheraa Al Bahri (2025)
Amenity Prevalence
Amenity Insights for ADH Dheraa Al Bahri
- Essential amenities in ADH Dheraa Al Bahri that guests expect include: Hot water, Washer, Kitchen, TV, Wifi, Essentials. Lacking these (any) could significantly impact bookings.
- Popular amenities like Heating, Air conditioning, Smoke alarm are common but not universal. Offering these can provide a competitive edge.
Recommendations for Hosts
- Ensure your listing includes all essential amenities for ADH Dheraa Al Bahri: Hot water, Washer, Kitchen, TV, Wifi, Essentials.
- Prioritize adding missing essentials: Essentials.
- Consider adding popular differentiators like Heating or Air conditioning to increase appeal.
- Highlight unique or less common amenities you offer (e.g., hot tub, dedicated workspace, EV charger) in your listing description and photos.
- Regularly check competitor amenities in ADH Dheraa Al Bahri to stay competitive.
ADH Dheraa Al Bahri Airbnb Guest Demographics & Profile Analysis (2025)
Guest Profile Summary for ADH Dheraa Al Bahri
- The typical guest profile for Airbnb in ADH Dheraa Al Bahri consists of predominantly international visitors (100%), with top international origins including Germany, primarily speaking English or Arabic.
- Domestic travelers account for 0.0% of guests.
- Key international markets include Saudi Arabia (20%) and Germany (20%).
- Top languages spoken are English (42.9%) followed by Arabic (14.3%).
Recommendations for Hosts
- Focus marketing internationally, particularly towards travelers from Germany.
- Highlight unique local experiences or amenities relevant to the primary guest profile.
- Consider seasonal promotions aligned with peak travel times for key origin markets.
Nearby Short-Term Rental Market Comparison
How does the ADH Dheraa Al Bahri Airbnb market stack up against its neighbors? Compare key performance metrics like average monthly revenue, ADR, and occupancy rates in surrounding areas to understand the broader regional STR landscape.
| Market | Active Properties | Monthly Revenue | Daily Rate | Avg. Occupancy |
|---|---|---|---|---|
| Swan Lake North Coast | 10 | $2,762 | $369.75 | 44% |
| مراسي | 316 | $2,738 | $424.94 | 31% |
| La Hacienda Bay - Sidi AbdelRahman | 39 | $2,559 | $405.64 | 27% |
| Al Daba‘ a | 12 | $2,348 | $349.64 | 28% |
| Seashell | 23 | $2,306 | $345.05 | 29% |
| Orchidia | 11 | $2,097 | $306.53 | 32% |
| Ad Daba‘a | 17 | $2,024 | $292.15 | 29% |
| La Vista | 10 | $1,864 | $243.79 | 30% |
| North Coast | 26 | $1,702 | $289.17 | 20% |
| Mountainview Ras El Hekma | 23 | $1,676 | $277.42 | 35% |