West of Suhail Airbnb Market Analysis 2026: Short Term Rental Data & Vacation Rental Statistics in Aswan, Egypt
Is Airbnb profitable in West of Suhail in 2026? Explore comprehensive Airbnb analytics for West of Suhail, Aswan, Egypt to uncover income potential. This 2026 STR market report for West of Suhail, based on AirROI data from February 2025 to January 2026, reveals key trends in the niche market of 28 active listings.
Whether you're considering an Airbnb investment in West of Suhail, optimizing your existing vacation rental, or exploring rental arbitrage opportunities, understanding the West of Suhail Airbnb data is crucial. Leveraging the low regulation environment is key to maximizing your short term rental income potential. Let's dive into the specifics.
Key West of Suhail Airbnb Performance Metrics Overview
Monthly Airbnb Revenue Variations & Income Potential in West of Suhail (2026)
Understanding the monthly revenue variations for Airbnb listings in West of Suhail is key to maximizing your short term rental income potential. Seasonality significantly impacts earnings. Our analysis, based on data from the past 12 months, shows that the peak revenue month for STRs in West of Suhail is typically January, while July often presents the lowest earnings, highlighting opportunities for strategic pricing adjustments during shoulder and low seasons. Explore the typical Airbnb income in West of Suhail across different performance tiers:
- Best-in-class properties (Top 10%) achieve $601+ monthly, often utilizing dynamic pricing and superior guest experiences.
- Strong performing properties (Top 25%) earn $306 or more, indicating effective management and desirable locations/amenities.
- Typical properties (Median) generate around $193 per month, representing the average market performance.
- Entry-level properties (Bottom 25%) see earnings around $99, often with potential for optimization.
Average Monthly Airbnb Earnings Trend in West of Suhail
West of Suhail Airbnb Occupancy Rate Trends (2026)
Maximize your bookings by understanding the West of Suhail STR occupancy trends. Seasonal demand shifts significantly influence how often properties are booked. Typically, Januarysees the highest demand (peak season occupancy), while June experiences the lowest (low season). Effective strategies, like adjusting minimum stays or offering promotions, can boost occupancy during slower periods. Here's how different property tiers perform in West of Suhail:
- Best-in-class properties (Top 10%) achieve 44%+ occupancy, indicating high desirability and potentially optimized availability.
- Strong performing properties (Top 25%) maintain 24% or higher occupancy, suggesting good market fit and guest satisfaction.
- Typical properties (Median) have an occupancy rate around 15%.
- Entry-level properties (Bottom 25%) average 9% occupancy, potentially facing higher vacancy.
Average Monthly Occupancy Rate Trend in West of Suhail
Average Daily Rate (ADR) Airbnb Trends in West of Suhail (2026)
Effective short term rental pricing strategy in West of Suhail involves understanding monthly ADR fluctuations. The Average Daily Rate (ADR) for Airbnb in West of Suhail typically peaks in February and dips lowest during October. Leveraging Airbnb dynamic pricing tools or strategies based on this seasonality can significantly boost revenue. Here's a look at the typical nightly rates achieved:
- Best-in-class properties (Top 10%) command rates of $99+ per night, often due to premium features or locations.
- Strong performing properties (Top 25%) achieve nightly rates of $65 or more.
- Typical properties (Median) charge around $37 per night.
- Entry-level properties (Bottom 25%) earn around $28 per night.
Average Daily Rate (ADR) Trend by Month in West of Suhail
Get Live West of Suhail Market Intelligence 👇

Explore Real-time Analytics
Airbnb Seasonality Analysis & Trends in West of Suhail (2026)
Peak Season (January, December, April)
- Revenue averages $397 per month
- Occupancy rates average 25.6%
- Daily rates average $52
Shoulder Season
- Revenue averages $229 per month
- Occupancy maintains around 16.8%
- Daily rates hold near $53
Low Season (July, September, November)
- Revenue drops to average $164 per month
- Occupancy decreases to average 16.5%
- Daily rates adjust to average $52
Seasonality Insights for West of Suhail
- The Airbnb seasonality in West of Suhail shows highly seasonal trends requiring careful strategy. While the sections above show seasonal averages, it's also insightful to look at the extremes:
- During the high season, the absolute peak month showcases West of Suhail's highest earning potential, with monthly revenues capable of climbing to $423, occupancy reaching a high of 30.5%, and ADRs peaking at $53.
- Conversely, the slowest single month of the year, typically falling within the low season, marks the market's lowest point. In this month, revenue might dip to $149, occupancy could drop to 11.8%, and ADRs may adjust down to $51.
- Understanding both the seasonal averages and these monthly peaks and troughs in revenue, occupancy, and ADR is crucial for maximizing your Airbnb profit potential in West of Suhail.
Seasonal Strategies for Maximizing Profit
- Peak Season: Maximize revenue through premium pricing and potentially longer minimum stays. Ensure high availability.
- Low Season: Offer competitive pricing, special promotions (e.g., extended stay discounts), and flexible cancellation policies. Target off-season travelers like remote workers or budget-conscious guests.
- Shoulder Seasons: Implement dynamic pricing that balances peak and low rates. Target weekend travelers or specific events. Offer slightly more flexible terms than peak season.
- Regularly analyze your own performance against these West of Suhail seasonality benchmarks and adjust your pricing and availability strategy accordingly.
Best Areas for Airbnb Investment in West of Suhail (2026)
Exploring the top neighborhoods for short-term rentals in West of Suhail? This section highlights key areas, outlining why they are attractive for hosts and guests, along with notable local attractions. Consider these locations based on your target guest profile and investment strategy.
| Neighborhood / Area | Why Host Here? (Target Guests & Appeal) | Key Attractions & Landmarks |
|---|---|---|
| Aswan City Center | The heart of Aswan, known for its historical significance and vibrant local culture. Easily accessible by tourists, making it a prime location for short-term rentals. | Aswan High Dam, Philae Temple, Nubian Museum, Aswan Botanical Garden, Kitchener's Island |
| Nubian Village | A unique cultural experience that showcases the traditional Nubian way of life. Tourists are drawn to its colorful houses and rich heritage, offering a different perspective of Egypt. | Nubian Museum, Philae Temple, Local handicrafts and markets, Traditional Nubian meals, Boat rides on the Nile |
| Kom Ombo | Famous for its temple dedicated to Sobek and Horus, this area attracts historical tourism. A good spot for those looking to host travelers interested in ancient Egypt. | Kom Ombo Temple, Nile River views, Local markets, River cruises, Bird watching spots |
| Elephantine Island | Known for its archaeological sites and beautiful landscapes, this tranquil island is perfect for those wanting a peaceful retreat while still being close to attractions. | Ancient ruins, The Nilometer, Art galleries, Local eateries, Scenic walks by the Nile |
| Philae Island | Home to the stunning Philae Temple, this area is a major tourist destination and a great spot for vacation rentals that capitalize on the influx of visitors. | Philae Temple, Nile River Buggy rides, Scenic ferry rides, Local Nubian culture, Stunning sunsets |
| Corniche Road | The scenic waterfront path along the Nile River, this area is popular for evening strolls and dining, attracting both tourists and locals alike. | Strolling along the Nile, Waterfront cafes and restaurants, View of the High Dam, Nile cruises, Public parks |
| West Bank of the Nile | Rich in history, with sites such as the Tombs of the Nobles and the Valley of the Kings located nearby, making it attractive to history buffs and culturally interested travelers. | Valley of the Kings, Tombs of the Nobles, Colossi of Memnon, Cultural experiences, Desert excursions |
| Aswan Market | The bustling local market is an attraction in itself, offering various items from local artisans, foods, and souvenirs, perfect for those wanting an authentic experience. | Local crafts and souvenirs, Street food, Cultural immersion, People watching, Nearby historical sites |
Understanding Airbnb License Requirements & STR Laws in West of Suhail (2026)
While West of Suhail, Aswan, Egypt currently shows low STR regulations, specific Airbnb license requirements might still exist or change. Always verify the latest short term rental regulations and Airbnb license requirements directly with local government authorities for West of Suhail to ensure full compliance before hosting.
(Source: AirROI data, 2026, finding no licensed listings among those analyzed)
Top Performing Airbnb Properties in West of Suhail (2026)
Benchmark your potential! Explore examples of top-performing Airbnb properties in West of Suhailbased on Trailing Twelve Month (TTM) revenue. Analyze their characteristics, revenue, occupancy rate, and ADR to understand what drives success in this market.

DoroKa Nubian Superior Nile View Room
Private Room • 1 bedroom

Kato Dool Wellness Resort
Private Room • 1 bedroom
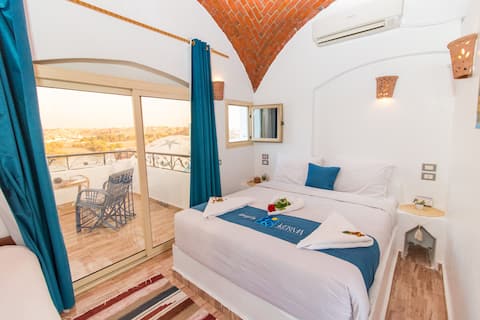
Casa Nile view rooms- Deluxe room with balcony
Private Room • 1 bedroom

Casa Nile View Rooms-Panoramic Nile view room
Private Room • N/A
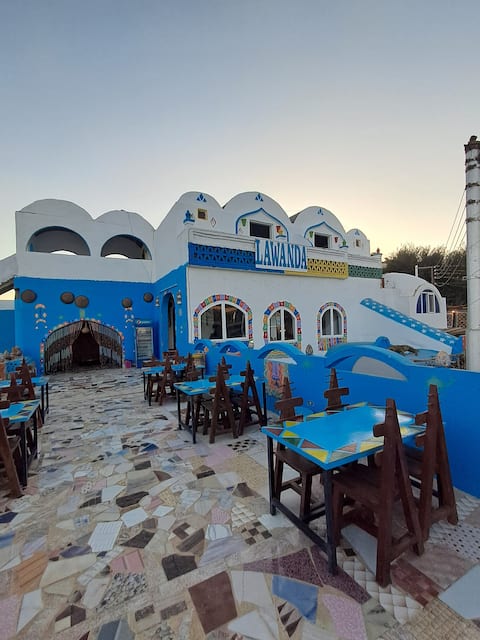
Lawanda Nubian B&B (3)
Private Room • N/A

Deluxe Nile View
Private Room • 1 bedroom
Note: Performance varies based on location, size, amenities, seasonality, and management quality. Data reflects the past 12 months.
Top Performing Airbnb Hosts in West of Suhail (2026)
Learn from the best! This table showcases top-performing Airbnb hosts in West of Suhail based on the number of properties managed and estimated total revenue over the past year. Analyze their scale and performance metrics.
| Host Name | Properties | Grossing Revenue | Stay Reviews | Avg Rating |
|---|---|---|---|---|
| Sameh | 8 | $15,858 | 133 | 4.93/5.0 |
| Sherif | 4 | $6,616 | 13 | 4.92/5.0 |
| DoroKa | 1 | $5,688 | 7 | 4.71/5.0 |
| Fenti Nubian | 4 | $5,522 | 49 | 4.60/5.0 |
| Mohamed | 1 | $5,236 | 9 | 5.00/5.0 |
| Ahmed | 1 | $3,004 | 43 | 4.88/5.0 |
| Ayaat | 2 | $1,206 | 11 | 4.89/5.0 |
| Ahmed | 1 | $886 | 1 | Not Rated |
| Adam | 3 | $675 | 11 | 4.44/5.0 |
| Aya | 1 | $343 | 7 | 4.43/5.0 |
Analyzing the strategies of top hosts, such as their property selection, pricing, and guest communication, can offer valuable lessons for optimizing your own Airbnb operations in West of Suhail.
Dive Deeper: Advanced West of Suhail STR Market Data (2026)
Ready to unlock more insights? AirROI provides access to advanced metrics and comprehensive Airbnb data for West of Suhail. Explore detailed analytics beyond this report to refine your investment strategy, optimize pricing, and maximize your vacation rental profits.
Explore Advanced MetricsWest of Suhail Short-Term Rental Market Composition (2026): Property & Room Types
Room Type Distribution
Property Type Distribution
Market Composition Insights for West of Suhail
- The West of Suhail Airbnb market composition is heavily skewed towards Private Room listings, which make up 96.4% of the 28 active rentals. This indicates strong guest preference for privacy and space.
- Looking at the property type distribution in West of Suhail, Hotel/Boutique properties are the most common (85.7%), reflecting the local real estate landscape.
- The presence of 85.7% Hotel/Boutique listings indicates integration with traditional hospitality.
West of Suhail Airbnb Room Capacity Analysis (2026): Bedroom Distribution
Distribution of Listings by Number of Bedrooms
Room Capacity Insights for West of Suhail
- The dominant room capacity in West of Suhail is 1 bedroom listings, making up 60.7% of the market. This suggests a strong demand for properties suitable for couples or solo travelers.
- Together, 1 bedroom and 5+ bedrooms properties represent 82.1% of the active Airbnb listings in West of Suhail, indicating a high concentration in these sizes.
- With over half the market (60.7%) consisting of studios or 1-bedroom units, West of Suhail is particularly well-suited for individuals or couples.
- A significant 21.4% of listings offer 3+ bedrooms, catering to larger groups and families seeking more space in West of Suhail.
West of Suhail Vacation Rental Guest Capacity Trends (2026)
Distribution of Listings by Guest Capacity
Guest Capacity Insights for West of Suhail
- The most common guest capacity trend in West of Suhail vacation rentals is listings accommodating 2 guests (46.4%). This suggests the primary traveler segment is likely couples or solo travelers.
- Properties designed for 2 guests and 3 guests dominate the West of Suhail STR market, accounting for 64.3% of listings.
- A significant 50.0% of listings cater specifically to 1-2 guests, highlighting strong demand from couples and solo travelers in West of Suhail.
- On average, properties in West of Suhail are equipped to host 2.4 guests.
West of Suhail Airbnb Booking Patterns (2026): Available vs. Booked Days
Available Days Distribution
Booked Days Distribution
Booking Pattern Insights for West of Suhail
- The most common availability pattern in West of Suhail falls within the 271-366 days range, representing 92.9% of listings. This suggests many properties have significant open periods on their calendars.
- Approximately 100.0% of listings show high availability (181+ days open annually), indicating potential for increased bookings or specific owner usage patterns.
- For booked days, the 1-30 days range is most frequent in West of Suhail (67.9%), reflecting common guest stay durations or potential owner blocking patterns.
West of Suhail Airbnb Minimum Stay Requirements Analysis
Distribution of Listings by Minimum Night Requirement
1 Night
27 listings
96.4% of total
30+ Nights
1 listings
3.6% of total
Key Insights
- The most prevalent minimum stay requirement in West of Suhail is 1 Night, adopted by 96.4% of listings. This highlights the market's preference for shorter, flexible bookings.
- A strong majority (96.4%) of the West of Suhail Airbnb data shows acceptance of very short stays (1-2 nights), indicating a dynamic, high-turnover market.
Recommendations
- Align with the market by considering a 1 Night minimum stay, as 96.4% of West of Suhail hosts use this setting.
- Adjust minimum nights based on seasonality – potentially shorter during low season and longer during peak demand periods in West of Suhail.
West of Suhail Airbnb Cancellation Policy Trends Analysis (2026)
Limited
4 listings
14.3% of total
Flexible
19 listings
67.9% of total
Moderate
2 listings
7.1% of total
Firm
3 listings
10.7% of total
Cancellation Policy Insights for West of Suhail
- The prevailing Airbnb cancellation policy trend in West of Suhail is Flexible, used by 67.9% of listings.
- The market strongly favors guest-friendly terms, with 75.0% of listings offering Flexible or Moderate policies. This suggests guests in West of Suhail may expect booking flexibility.
Recommendations for Hosts
- Consider adopting a Flexible policy to align with the 67.9% market standard in West of Suhail.
- Given the high prevalence of Flexible policies (67.9%), offering this can enhance booking appeal, especially during shoulder seasons.
- Regularly review your cancellation policy against competitors and market demand shifts in West of Suhail.
West of Suhail STR Booking Lead Time Analysis (2026)
Average Booking Lead Time by Month
Booking Lead Time Insights for West of Suhail
- The overall average booking lead time for vacation rentals in West of Suhail is 38 days.
- Guests book furthest in advance for stays during January (average 73 days), likely coinciding with peak travel demand or local events.
- The shortest booking windows occur for stays in June (average 26 days), indicating more last-minute travel plans during this time.
- Seasonally, Fall (48 days avg.) sees the longest lead times, while Summer (35 days avg.) has the shortest, reflecting typical travel planning cycles.
Recommendations for Hosts
- Use the overall average lead time (38 days) as a baseline for your pricing and availability strategy in West of Suhail.
- For January stays, consider implementing length-of-stay discounts or slightly higher rates for bookings made less than 73 days out to capitalize on advance planning.
- Target marketing efforts for the Fall season well in advance (at least 48 days) to capture early planners.
- Monitor your own booking lead times against these West of Suhail averages to identify opportunities for dynamic pricing adjustments.
Popular & Essential Airbnb Amenities in West of Suhail (2026)
Amenity Prevalence
Amenity Insights for West of Suhail
- Popular amenities like Free parking on premises, Air conditioning, Wifi are common but not universal. Offering these can provide a competitive edge.
- Warning: Wifi is not universally provided but is considered essential globally. Ensure reliable Wifi is offered.
Recommendations for Hosts
- Consider adding popular differentiators like Free parking on premises or Air conditioning to increase appeal.
- Highlight unique or less common amenities you offer (e.g., hot tub, dedicated workspace, EV charger) in your listing description and photos.
- Regularly check competitor amenities in West of Suhail to stay competitive.
West of Suhail Airbnb Guest Demographics & Profile Analysis (2026)
Guest Profile Summary for West of Suhail
- The typical guest profile for Airbnb in West of Suhail consists of predominantly international visitors (98%), with top international origins including France, typically belonging to the Post-2000s (Gen Z/Alpha) group (50%), primarily speaking English or Spanish.
- Domestic travelers account for 1.6% of guests.
- Key international markets include United States (24.2%) and France (24.2%).
- Top languages spoken are English (41.1%) followed by Spanish (18.9%).
- A significant demographic segment is the Post-2000s (Gen Z/Alpha) group, representing 50% of guests.
Recommendations for Hosts
- Focus marketing internationally, particularly towards travelers from France.
- Tailor amenities and listing descriptions to appeal to the dominant Post-2000s (Gen Z/Alpha) demographic (e.g., highlight fast WiFi, smart home features, local guides).
- Highlight unique local experiences or amenities relevant to the primary guest profile.
- Consider seasonal promotions aligned with peak travel times for key origin markets.
Nearby Short-Term Rental Market Comparison
How does the West of Suhail Airbnb market stack up against its neighbors? Compare key performance metrics like average monthly revenue, ADR, and occupancy rates in surrounding areas to understand the broader regional STR landscape.
| Market | Active Properties | Monthly Revenue | Daily Rate | Avg. Occupancy |
|---|---|---|---|---|
| Saleh Gahin | 10 | $522 | $59.70 | 30% |
| Aswan | 20 | $409 | $84.44 | 25% |
| Al Baairat Village | 259 | $392 | $48.27 | 32% |
| Jazirat al Awamiya | 14 | $269 | $41.92 | 29% |
| Nagaa Al Mahata | 15 | $231 | $52.06 | 25% |
| New Al Qarnh City | 21 | $221 | $54.86 | 21% |
| Taqouk Mountain | 24 | $185 | $38.62 | 22% |
| Al Bairat | 11 | $174 | $45.79 | 30% |
| Abd Al Aazim Hassn | 31 | $165 | $42.74 | 22% |
| Luxor | 38 | $141 | $47.42 | 22% |