Nazlet El-Semman, Giza Governorate Airbnb Market Data 2026: STR Report & Statistics
How much can you earn on Airbnb in Nazlet El-Semman, Giza Governorate? Based on AirROI's 2026 dataset (April 2025 – March 2026), the short answer is $5,286 per year — at a $57 nightly rate, 31.3% occupancy, and a $19 RevPAR that reflects a wider gap between nightly rates and realized revenue that rewards occupancy-focused strategies.
With just 47 active listings, Nazlet El-Semman is a micro-market where selective demand that rewards strong listing quality and pricing strategy.
Regulation is low with minimal registration requirements, pointing to an operator-friendly environment. In a market this size, differentiated listings with strong reviews can capture outsized returns relative to the competition.
Table of Contents [hide] [show]
What Are the Key Airbnb Metrics in Nazlet El-Semman?
In Nazlet El-Semman, the headline Airbnb metrics are $5,286 in average annual revenue,31.3% occupancy, $57 ADR, and $19 in RevPAR, and guests book about 26 days in advance.
How Much Do Airbnb Hosts Earn Monthly in Nazlet El-Semman?
Understanding the monthly revenue variations for Airbnb listings in Nazlet El-Semman is key to maximizing your short term rental income potential. Seasonality significantly impacts earnings. Our analysis, based on data from the past 12 months, shows that the peak revenue month for STRs in Nazlet El-Semman is typically December, while May often presents the lowest earnings, highlighting opportunities for strategic pricing adjustments during shoulder and low seasons. Explore the typical Airbnb income in Nazlet El-Semman across different performance tiers:
- Best-in-class properties (Top 10%) achieve $1,421+ monthly, often utilizing dynamic pricing and superior guest experiences.
- Strong performing properties (Top 25%) earn $854 or more, indicating effective management and desirable locations/amenities.
- Typical properties (Median) generate around $486 per month, representing the average market performance.
- Entry-level properties (Bottom 25%) see earnings around $220, often with potential for optimization.
Average Monthly Airbnb Earnings Trend in Nazlet El-Semman
What Is the Monthly Airbnb Occupancy Rate in Nazlet El-Semman?
Maximize your bookings by understanding the Nazlet El-Semman STR occupancy trends. Seasonal demand shifts significantly influence how often properties are booked. Typically, Januarysees the highest demand (peak season occupancy), while May experiences the lowest (low season). Effective strategies, like adjusting minimum stays or offering promotions, can boost occupancy during slower periods. Here's how different property tiers perform in Nazlet El-Semman:
- Best-in-class properties (Top 10%) achieve 65%+ occupancy, indicating high desirability and potentially optimized availability.
- Strong performing properties (Top 25%) maintain 52% or higher occupancy, suggesting good market fit and guest satisfaction.
- Typical properties (Median) have an occupancy rate around 33%.
- Entry-level properties (Bottom 25%) average 15% occupancy, potentially facing higher vacancy.
Average Monthly Occupancy Rate Trend in Nazlet El-Semman
What Is the Average Airbnb Nightly Rate in Nazlet El-Semman?
Effective short term rental pricing strategy in Nazlet El-Semman involves understanding monthly ADR fluctuations. The Average Daily Rate (ADR) for Airbnb in Nazlet El-Semman typically peaks in March and dips lowest during August. Leveraging Airbnb dynamic pricing tools or strategies based on this seasonality can significantly boost revenue. Here's a look at the typical nightly rates achieved:
- Best-in-class properties (Top 10%) command rates of $95+ per night, often due to premium features or locations.
- Strong performing properties (Top 25%) achieve nightly rates of $70 or more.
- Typical properties (Median) charge around $47 per night.
- Entry-level properties (Bottom 25%) earn around $35 per night.
Average Daily Rate (ADR) Trend by Month in Nazlet El-Semman
What Is the RevPAR for Airbnb in Nazlet El-Semman?
RevPAR in Nazlet El-Semman is currently $19. Because RevPAR combines nightly rates with realized occupancy, it is one of the cleanest ways to compare how efficiently listings turn demand into revenue across the market.
- Entry-level properties (Bottom 25%) see $7 RevPAR.
- Typical properties (Median) generate $14 RevPAR.
- Strong performers (Top 25%) earn $24 RevPAR.
- Best-in-class (Top 10%) achieve $38 RevPAR.
Average Monthly RevPAR Trend in Nazlet El-Semman
RevPAR Insights for Nazlet El-Semman
- The average RevPAR in Nazlet El-Semman is $19. This metric combines nightly rates with realized occupancy, making it one of the best single-number indicators of market efficiency.
- The gap between the top 10% ($38) and bottom 25% ($7) is $31, suggesting a relatively compressed market where operational differences yield moderate returns.
- RevPAR peaks in Dec and bottoms out in Apr, mirroring the broader seasonal demand pattern and suggesting opportunities for dynamic pricing.
Recommendations for Hosts
- Track your own RevPAR monthly against these Nazlet El-Semman benchmarks. If your RevPAR falls below the median of $14, examine whether low occupancy or low ADR is the primary drag.
- Top-quartile listings achieve $24+ RevPAR through a combination of competitive pricing, strong reviews, and strategic amenities. Target this tier through incremental improvements.
- Use RevPAR rather than revenue alone when comparing properties of different sizes — it normalizes for available nights and gives a more accurate picture of performance.
Get Live Nazlet El-Semman Market Intelligence 👇
Explore Real-time Analytics
When Is the Peak Season for Airbnb in Nazlet El-Semman?
Nazlet El-Semman's peak Airbnb season falls in December, January, November, while the softest stretch is April, May, August. Overall, the market shows highly seasonal trends requiring careful strategy, which should guide pricing, minimum stays, and cash-flow planning.
Peak Season (December, January, November)
- Revenue averages $988 per month
- Occupancy rates average 44.7%
- Daily rates average $63
Shoulder Season
- Revenue averages $666 per month
- Occupancy maintains around 35.3%
- Daily rates hold near $56
Low Season (April, May, August)
- Revenue drops to average $215 per month
- Occupancy decreases to average 13.1%
- Daily rates adjust to average $53
Seasonality Insights for Nazlet El-Semman
- Airbnb seasonality in Nazlet El-Semman is pronounced. Revenue swings sharply between peak and low months, which means pricing strategy, minimum-stay settings, and cash reserves all need to account for extended slower periods.
- During the high season, the absolute peak month showcases Nazlet El-Semman's highest earning potential, with monthly revenues climbing to $1,054, occupancy reaching 46.6%, and ADRs peaking at $64.
- Conversely, the slowest single month marks the market's lowest point — revenue may dip to $0, occupancy could drop to 0.0%, and ADRs may adjust to $50.
- Lower occupancy paired with meaningful seasonality means hosts in Nazlet El-Semman need to maximize every peak-season booking and seriously consider whether off-season pricing adjustments or minimum-stay changes can capture incremental revenue.
Seasonal Strategies for Maximizing Profit
- Peak Season: Maximize revenue through premium pricing and potentially longer minimum stays. Ensure high availability and consider tightening cancellation policies to reduce last-minute gaps.
- Low Season: Offer competitive pricing, extended-stay discounts, and flexible cancellation policies. Target off-season travelers like remote workers, budget-conscious guests, and travelers with flexible schedules.
- Shoulder Seasons: Implement dynamic pricing that bridges peak and low rates. Target weekend travelers, local events, and business visitors. Slightly more flexible terms than peak season can help maintain occupancy without deep discounting.
- In a highly seasonal market like Nazlet El-Semman, building a cash reserve during the top months is essential for covering fixed costs during the slow period. Automated pricing tools can help capture demand shifts in real time.
Do You Need a License for Airbnb in Nazlet El-Semman?
Low regulation and minimal registration activity in Nazlet El-Semman, Giza Governorate, Egypt point to an operator-friendly environment. That said, even low-regulation markets may have tax collection requirements, safety standards, or HOA rules that affect short-term rental operations. Always verify the latest short-term rental regulations and Airbnb license requirements directly with local government authorities for Nazlet El-Semman to ensure full compliance before hosting.
(Source: AirROI data, 2026, finding no licensed listings among those analyzed)
What Are the Best Neighborhoods for Airbnb in Nazlet El-Semman?
With a compact short-term rental market, Nazlet El-Semman gives early-mover hosts an advantage in the right neighborhoods. The areas listed below are where guest demand and local attractions converge — a useful lens for investors evaluating whether to enter this market and where to position their listing.
| Neighborhood / Area | Why Host Here? (Target Guests & Appeal) | Key Attractions & Landmarks |
|---|---|---|
| Pyramids View | Offers stunning views of the Great Pyramids of Giza, making it a prime location for tourists and travelers seeking to experience one of the Seven Wonders of the World. | Great Pyramid of Giza, Sphinx of Giza, Pirâmide de Quéops, Giza Plateau |
| Sakkara | Close to the ancient necropolis of Saqqara, featuring impressive step pyramids and historical significance. Great for history buffs and tourists looking for unique cultural experiences. | Step Pyramid of Djoser, Sakkara Imhotep Museum, Tombs of the Nobles |
| Nile viewing area | Located along the Nile River, this area offers beautiful views and a serene atmosphere, attracting guests who enjoy nature and relaxation. | Nile River cruises, Felucca rides, Nile corniche |
| Cairo Opera House | Though a bit further in central Cairo, this area is popular among tourists attending cultural events and performances, making it a vibrant hub for arts and entertainment. | Cairo Opera House, Cairo Planetarium, Cairo Museum of Modern Art |
| El-Mariouteya | A quieter area near the outskirts of Giza, ideal for families and those looking for a less touristy experience while still being close to major attractions. | Local markets, Authentic Egyptian dining, Parks and gardens |
| El-Haram Street | A main thoroughfare close to the pyramids with numerous shops, restaurants, and hotels catering to visitors, making it a busy and vibrant area. | Local bazaars, Restaurants, Shisha cafes |
| Giza Zoo | Located within the Giza district, the zoo provides family-friendly activities and is great for visitors traveling with children. | Giza Zoo, Botanical Gardens, Children's activities |
| Cultural Center of Egypt | A hub for cultural events and festivals, attracting visitors interested in Egyptian culture and art, providing a different flavor of experiences. | Galleria Casino, Art galleries, Performance venues |
With 8 distinct neighborhoods showing meaningful short-term rental activity, Nazlet El-Semman offers diversification within a single market. Investors can tailor their strategy — from high-turnover tourist zones to quieter residential areas that attract longer stays and remote workers.
What Types of Properties Are on Airbnb in Nazlet El-Semman?
Room Type Distribution
Property Type Distribution
Market Composition Insights for Nazlet El-Semman
- The Nazlet El-Semman Airbnb market composition is heavily skewed towards Private Room listings, which make up 61.7% of the 47 active rentals. This indicates strong guest preference for privacy and space.
- Looking at the property type distribution in Nazlet El-Semman, Apartment/Condo properties are the most common (40.4%), reflecting the local real estate landscape.
- The presence of 31.9% Hotel/Boutique listings indicates integration with traditional hospitality.
- Smaller segments like house, unique stays (combined 4.2%) offer potential for unique stay experiences.
Nazlet El-Semman Airbnb Room Capacity Analysis (2026): Bedroom Distribution
Distribution of Listings by Number of Bedrooms
Room Capacity Insights for Nazlet El-Semman
- The dominant room capacity in Nazlet El-Semman is 1 bedroom listings, making up 31.9% of the market. This suggests a strong demand for properties suitable for couples or solo travelers.
- Together, 1 bedroom and 3 bedrooms properties represent 42.5% of the active Airbnb listings in Nazlet El-Semman, indicating a high concentration in these sizes.
Nazlet El-Semman Vacation Rental Guest Capacity Trends (2026)
Distribution of Listings by Guest Capacity
Guest Capacity Insights for Nazlet El-Semman
- The most common guest capacity trend in Nazlet El-Semman vacation rentals is listings accommodating 2 guests (21.3%). This suggests the primary traveler segment is likely couples or solo travelers.
- Properties designed for 2 guests and 3 guests dominate the Nazlet El-Semman STR market, accounting for 34.1% of listings.
- 12.8% of properties accommodate 6+ guests, serving the market segment for larger families or group travel in Nazlet El-Semman.
- On average, properties in Nazlet El-Semman are equipped to host 1.9 guests.
How Do Listings in Nazlet El-Semman Compare on Quality?
Listing quality in Nazlet El-Semman can be approximated through presentation depth, bedroom count, and how often hosts disclose exact locations. These signals show how professionally the local supply base is merchandised.
Listing Quality Insights for Nazlet El-Semman
- At 35.8 photos per listing on average, Nazlet El-Semman hosts invest well in visual presentation. Listings with 20+ photos consistently outperform in search ranking and conversion.
- 29.8% of listings show their exact location. Lower disclosure rates can increase booking hesitation — guests want to know exactly where they are staying.
Recommendations for Hosts
- Enable exact location if possible — it removes a common source of guest uncertainty and can improve your listing's position in map-based searches.
- Use these quality indicators as a self-audit checklist. Listings that exceed the Nazlet El-Semman averages across all three metrics are better positioned for premium pricing.
What Amenities Do Airbnb Guests Expect in Nazlet El-Semman?
Amenity Prevalence
Amenity Insights for Nazlet El-Semman
- Popular amenities like Air conditioning, Hot water, Iron are common but not universal. Offering these can provide a competitive edge.
- Warning: Wifi is not universally provided but is considered essential globally. Ensure reliable Wifi is offered.
Recommendations for Hosts
- Consider adding popular differentiators like Air conditioning or Hot water to increase appeal.
- Highlight unique or less common amenities you offer (e.g., hot tub, dedicated workspace, EV charger) in your listing description and photos.
- Regularly check competitor amenities in Nazlet El-Semman to stay competitive.
Which Airbnb Amenities Boost Revenue in Nazlet El-Semman?
Not every amenity matters equally. This table focuses on the amenities most associated with higher revenue in Nazlet El-Semman, which makes it more useful for prioritizing upgrades than a simple popularity list alone.
| Amenity | Prevalence | Revenue With | Revenue Without | Revenue Uplift |
|---|---|---|---|---|
Cooking basics | 55.3% | $7,249 | $2,856 | 153.8% |
Stove | 14.9% | $10,831 | $4,316 | 151.0% |
Microwave | 57.4% | $6,956 | $3,031 | 129.5% |
Freezer | 46.8% | $7,542 | $3,301 | 128.4% |
Hair dryer | 80.9% | $5,920 | $2,611 | 126.8% |
Dryer | 14.9% | $9,155 | $4,609 | 98.6% |
Wine glasses | 57.4% | $6,622 | $3,483 | 90.1% |
Toaster | 19.1% | $8,454 | $4,536 | 86.4% |
Dishwasher | 12.8% | $8,041 | $4,883 | 64.7% |
Patio or balcony | 31.9% | $7,113 | $4,429 | 60.6% |
Revenue Impact Insights for Nazlet El-Semman
- Cooking basics tops the revenue impact list with a 153.8% uplift — listings with this amenity earn $7,249 vs. $2,856 without it.
- Hair dryer — while widespread — still correlate with meaningful revenue gains, making it table stakes rather than true differentiators.
Recommendations for Hosts
- Focus your upgrade budget on amenities in the top half of this table. Below-median amenities may improve guest experience but contribute less to revenue growth.
- Highlight revenue-impacting amenities prominently in your listing title, photos, and description — guests can't value what they don't notice.
Dive Deeper: Advanced Nazlet El-Semman STR Market Data (2026)
Ready to unlock more insights? AirROI provides access to advanced metrics and comprehensive Airbnb data for Nazlet El-Semman. Explore detailed analytics beyond this report to refine your investment strategy, optimize pricing, and maximize your vacation rental profits.
Explore Advanced MetricsNazlet El-Semman Airbnb Guest Demographics & Profile Analysis (2026)
Guest Profile Summary for Nazlet El-Semman
- The typical guest profile for Airbnb in Nazlet El-Semman consists of predominantly international visitors (99%), with top international origins including United States, typically belonging to the Post-2000s (Gen Z/Alpha) group (50%), primarily speaking English or Spanish.
- Domestic travelers account for 0.6% of guests.
- Key international markets include France (18%) and United States (16.6%).
- Top languages spoken are English (39.3%) followed by Spanish (13.7%).
- A significant demographic segment is the Post-2000s (Gen Z/Alpha) group, representing 50% of guests.
Recommendations for Hosts
- Focus marketing internationally, particularly towards travelers from United States.
- Tailor amenities and listing descriptions to appeal to the dominant Post-2000s (Gen Z/Alpha) demographic (e.g., highlight fast WiFi, smart home features, local guides).
- Highlight unique local experiences or amenities relevant to the primary guest profile.
- Consider seasonal promotions aligned with peak travel times for key origin markets.
What Are Airbnb Guest Ratings in Nazlet El-Semman?
Listings in Nazlet El-Semman average 4.75 out of 5 overall, with about 27 reviews per active listing and 34.0% of listings carrying the Guest Favorite badge.
Rating Breakdown by Category
Guest Rating Insights for Nazlet El-Semman
- An average rating of 4.75 places Nazlet El-Semman in solid territory. Most guests leave satisfied, though there is room for hosts to push toward the top tier.
- The strongest subcategory is Communication (4.81), while Location (4.63) trails behind — a useful signal for hosts looking to prioritize upgrades.
- 34.0% of listings carry the Guest Favorite badge, a strong trust signal that can meaningfully lift click-through and booking rates.
Recommendations for Hosts
- Focus improvement efforts on Location — even small gains in the weakest subcategory can lift overall ratings and search ranking.
- Encourage guests to leave reviews after checkout. Listings with more reviews rank higher in search results and convert browsers into bookers more effectively.
Nazlet El-Semman Airbnb Booking Patterns (2026): Available vs. Booked Days
Available Days Distribution
Booked Days Distribution
Booking Pattern Insights for Nazlet El-Semman
- The most common availability pattern in Nazlet El-Semman falls within the 271-366 days range, representing 61.7% of listings. This suggests many properties have significant open periods on their calendars.
- Approximately 89.4% of listings show high availability (181+ days open annually), indicating potential for increased bookings or specific owner usage patterns.
- For booked days, the 31-90 days range is most frequent in Nazlet El-Semman (34%), reflecting common guest stay durations or potential owner blocking patterns.
- A notable 10.6% of properties secure long booking periods (181+ days booked per year), highlighting successful long-term rental strategies or significant owner usage.
How Far in Advance Do Guests Book Airbnb in Nazlet El-Semman?
Average Booking Lead Time by Month
Booking Lead Time Insights for Nazlet El-Semman
- The overall average booking lead time for vacation rentals in Nazlet El-Semman is 26 days.
- Guests book furthest in advance for stays during December (average 43 days), likely coinciding with peak travel demand or local events.
- The shortest booking windows occur for stays in April (average 0 days), indicating more last-minute travel plans during this time.
- Seasonally, Winter (38 days avg.) sees the longest lead times, while Spring (12 days avg.) has the shortest, reflecting typical travel planning cycles.
Recommendations for Hosts
- Use the overall average lead time (26 days) as a baseline for your pricing and availability strategy in Nazlet El-Semman.
- For December stays, consider implementing length-of-stay discounts or slightly higher rates for bookings made less than 43 days out to capitalize on advance planning.
- During April, focus on last-minute booking availability and promotions, as guests book with very short notice (0 days avg.).
- Target marketing efforts for the Winter season well in advance (at least 38 days) to capture early planners.
- Monitor your own booking lead times against these Nazlet El-Semman averages to identify opportunities for dynamic pricing adjustments.
What Is the Average Length of Stay for Airbnb in Nazlet El-Semman?
Guests in Nazlet El-Semman stay about 3.2 nights on average, generating roughly 999 reservations and 21.3 bookings per listing in the latest AirROI dataset. The most common check-in time is 2:00 PM and check-out is 11:00 AM.
Monthly Length of Stay in Nazlet El-Semman
Check-in Time Distribution
Check-out Time Distribution
Stay Pattern Insights for Nazlet El-Semman
- A mid-range stay length points to leisure-driven demand — weekend getaways and short vacations. Hosts should optimize for quick turnover efficiency while keeping the guest experience smooth.
- At 21.3 bookings per listing, the turnover rate is high. Hosts with streamlined operations (self-check-in, automated messaging, reliable cleaners) have a structural advantage.
- Stay lengths peak in May (3.5 nights) and shorten in Mar (2.1 nights). Adjust minimum-night requirements seasonally to match.
Recommendations for Hosts
- With shorter average stays, focus on streamlining turnover. Self-check-in, reliable cleaning crews, and pre-staged amenities can reduce per-booking operational costs.
- Set your check-in time to match or beat the market standard of 2:00 PM. Offering early check-in flexibility can be a low-cost differentiator.
- Monitor length-of-stay seasonality to adjust minimum-night requirements — longer minimums during peak periods maximize revenue while shorter minimums fill gaps in shoulder seasons.
Nazlet El-Semman Airbnb Minimum Stay Requirements Analysis
Distribution of Listings by Minimum Night Requirement
1 Night
44 listings
93.6% of total
30+ Nights
3 listings
6.4% of total
Key Insights
- The most prevalent minimum stay requirement in Nazlet El-Semman is 1 Night, adopted by 93.6% of listings. This highlights the market's preference for shorter, flexible bookings.
- A strong majority (93.6%) of the Nazlet El-Semman Airbnb data shows acceptance of very short stays (1-2 nights), indicating a dynamic, high-turnover market.
Recommendations
- Align with the market by considering a 1 Night minimum stay, as 93.6% of Nazlet El-Semman hosts use this setting.
- Explore offering discounts for stays of 30+ nights to attract the 6.4% of the market seeking extended stays.
- Adjust minimum nights based on seasonality – potentially shorter during low season and longer during peak demand periods in Nazlet El-Semman.
Nazlet El-Semman Airbnb Cancellation Policy Trends Analysis (2026)
Flexible
24 listings
51.1% of total
Moderate
6 listings
12.8% of total
Firm
16 listings
34% of total
Strict
1 listings
2.1% of total
Cancellation Policy Insights for Nazlet El-Semman
- The prevailing Airbnb cancellation policy trend in Nazlet El-Semman is Flexible, used by 51.1% of listings.
- There's a relatively balanced mix between guest-friendly (63.9%) and stricter (36.1%) policies, offering choices for different guest needs.
- Strict cancellation policies are quite rare (2.1%), potentially making listings with this policy less competitive unless justified by high demand or property type.
Recommendations for Hosts
- Consider adopting a Flexible policy to align with the 51.1% market standard in Nazlet El-Semman.
- Given the high prevalence of Flexible policies (51.1%), offering this can enhance booking appeal, especially during shoulder seasons.
- Using a Strict policy might deter some guests, as only 2.1% of listings use it. Evaluate if potential revenue protection outweighs possible lower booking rates.
- Regularly review your cancellation policy against competitors and market demand shifts in Nazlet El-Semman.
How Much Are Airbnb Cleaning Fees in Nazlet El-Semman?
Cleaning fees in Nazlet El-Semman are meaningful operating levers, not just pass-through charges. What matters most is how often hosts charge them, how high they run relative to market norms, and how large a share of gross revenue they consume.
Cleaning Fee Insights for Nazlet El-Semman
- About 51.1% of Nazlet El-Semman listings charge a cleaning fee — a mixed market where some hosts absorb the cost into nightly rates while others break it out.
- The average cleaning fee of $10 is close to the median ($5), suggesting a relatively consistent fee structure across the market.
- Cleaning fees represent 4.1% of gross revenue on average — a modest component of the overall booking price.
Recommendations for Hosts
- Price your cleaning fee competitively against the Nazlet El-Semman median of $5. Fees significantly above market norms can deter bookings, especially for shorter stays.
- Monitor competitor cleaning fees regularly. Airbnb's search algorithm factors in total price, so a well-calibrated cleaning fee can improve your listing's ranking.
What Do the Top Airbnb Listings in Nazlet El-Semman Look Like?
Benchmark your potential! Explore examples of top-performing Airbnb properties in Nazlet El-Semmanbased on Trailing Twelve Month (TTM) revenue. Analyze their characteristics, revenue, occupancy rate, and ADR to understand what drives success in this market.
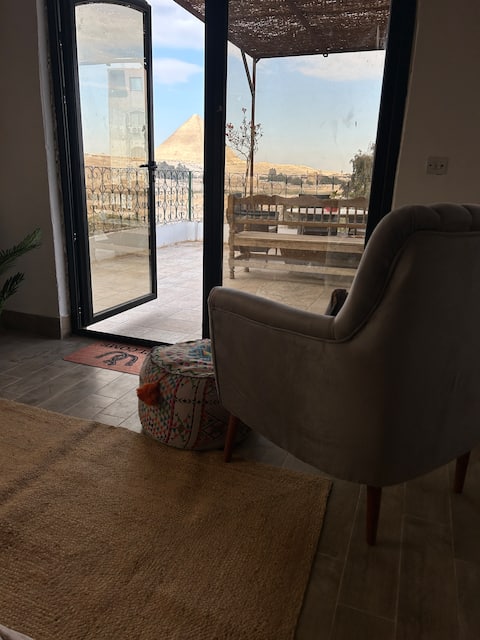
4 Rooms with VIEW+ large private terrace sleeps 9
Private Room • 4 bedrooms

FANY Pyramids View
Entire Place • 1 bedroom

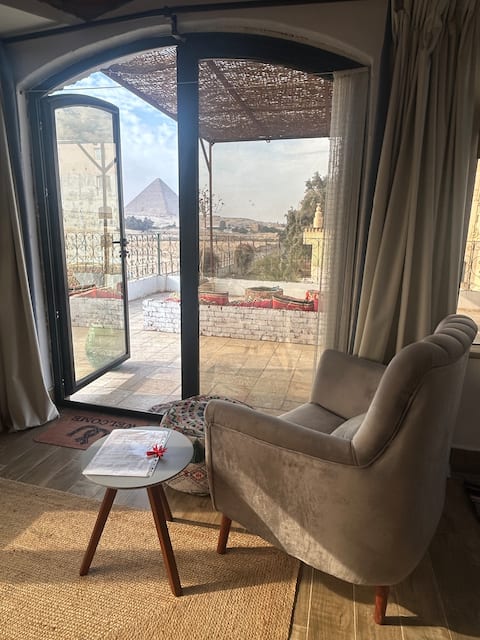
GITILounge Pyramids View Hot Tub
Entire Place • 3 bedrooms
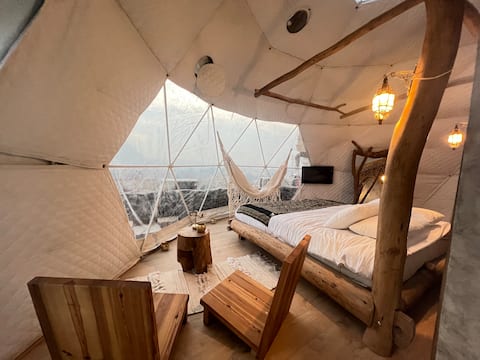
Esfera Celeste. Unique Luxury Dome w/pyramids view
Entire Place • N/A

Ancient Pyramids View Retreat with Jacuzzi 806
Entire Place • N/A
Horserider's home - with view of pyramids+terrace
Private Room • N/A
Note: Performance varies based on location, size, amenities, seasonality, and management quality. Data reflects the past 12 months.
Who Are the Top Airbnb Hosts in Nazlet El-Semman?
Learn from the best! This table showcases top-performing Airbnb hosts in Nazlet El-Semman based on the number of properties managed and estimated total revenue over the past year. Analyze their scale and performance metrics.
| Host Name | Properties | Grossing Revenue | Stay Reviews | Avg Rating |
|---|---|---|---|---|
| Malika | 11 | $73,907 | 414 | 4.95/5.0 |
| Moe | 2 | $46,297 | 162 | 4.95/5.0 |
| Yasser | 2 | $26,072 | 80 | 4.67/5.0 |
| Elhamy | 6 | $25,102 | 121 | 4.41/5.0 |
| Muhammed | 5 | $23,680 | 222 | 4.79/5.0 |
| Eslam | 2 | $14,930 | 147 | 4.83/5.0 |
| Mo Jimmy | 1 | $8,213 | 15 | 4.40/5.0 |
| Andreea | 4 | $7,062 | 16 | 4.84/5.0 |
| Mohamed | 2 | $5,429 | 5 | 5.00/5.0 |
| Mohamed | 1 | $4,593 | 16 | 4.81/5.0 |
Analyzing the strategies of top hosts, such as their property selection, pricing, and guest communication, can offer valuable lessons for optimizing your own Airbnb operations in Nazlet El-Semman.
Who Are the Airbnb Hosts in Nazlet El-Semman?
Nazlet El-Semman is a quality-focused market, with a high Superhost share and fairly mature operating standards.
Host Profile Insights for Nazlet El-Semman
- With 53.2% Superhosts, Nazlet El-Semman has an experienced host base that sets high guest expectations. New entrants should plan for competitive quality standards.
- 10.6% of listings have Instant Book enabled. Lower Instant Book adoption means many guests must request approval, which can slow conversions.
- 83.0% of listings use Airbnb's simplified pricing (host-only fee), where the host pays the entire platform service fee and the guest sees one all-in price with no separate Airbnb service charge. High adoption signals a professional, PMS-connected host base — Airbnb mandates simplified pricing for software-connected listings.
Recommendations for Hosts
- Consider enabling Instant Book — it reduces booking friction and Airbnb's algorithm tends to favor Instant Book listings in search results.
- With 27.7% cohosted listings, there may be a growing local market for property management services.
- Benchmark your host metrics against these Nazlet El-Semman averages regularly and adjust your hosting strategy based on what top performers do differently.
How Does Nazlet El-Semman's Airbnb Market Compare to Nearby Cities?
How does the Nazlet El-Semman Airbnb market stack up against its neighbors? Compare key performance metrics like average monthly revenue, ADR, and occupancy rates in surrounding areas to understand the broader regional STR landscape.
Compared with Nasr City, Nazlet El-Semman has 12 percentage points lower occupancy and about $24 lower ADR. That helps frame whether this market is winning more on demand, pricing, or both.
| Market | Active Properties | Monthly Revenue | Daily Rate | Avg. Occupancy |
|---|---|---|---|---|
| Al Gabalayah | 43 | $1,319 | $102.26 | 39% |
| Omar Al Khayam | 36 | $1,055 | $110.40 | 40% |
| Abu Al Feda | 183 | $987 | $110.21 | 39% |
| Mohammed Mazhar | 174 | $930 | $98.27 | 36% |
| October Hills | 31 | $844 | $109.99 | 36% |
| Nasr City | 20 | $814 | $80.92 | 43% |
| New Cairo 1 | 143 | $755 | $95.47 | 38% |
| Maadi | 22 | $724 | $90.09 | 41% |
| Zamalek | 111 | $624 | $93.21 | 33% |
| First New Cairo Qism | 42 | $619 | $103.55 | 41% |
Frequently Asked Questions About Airbnb in Nazlet El-Semman
These quick answers summarize the most common investor and operator questions using AirROI's latest market data for Nazlet El-Semman.
How much do Airbnb hosts make in Nazlet El-Semman?
Nazlet El-Semman hosts earn about $5,286 per year on average, with an average nightly rate of $57 and RevPAR of $19. Those figures describe the typical revenue environment for active listings in Nazlet El-Semman, Giza Governorate, not the ceiling for the best operators. Source: AirROI 2026 data, Nazlet El-Semman market, April 2025 to March 2026.
What is the average Airbnb occupancy rate in Nazlet El-Semman?
The average Airbnb occupancy rate in Nazlet El-Semman is 31.3%. December is the strongest month and May is the softest, so hosts should expect demand to move meaningfully throughout the year rather than stay flat.
What is the average Airbnb daily rate in Nazlet El-Semman?
Listings in Nazlet El-Semman average $57 per night. The broader pricing spread also matters: lower-performing listings cluster closer to the lower quartiles, while premium homes can price materially above the city average when demand spikes or listing quality stands out.
How many Airbnb listings are active in Nazlet El-Semman?
Nazlet El-Semman currently has about 47 active Airbnb listings in AirROI's market dataset. That supply count helps explain how competitive the market is, how much depth there is for benchmarking, and whether the market behaves like a niche destination or a scaled urban market.
How strict are short-term rental regulations in Nazlet El-Semman?
AirROI currently classifies the short-term rental regulation level in Nazlet El-Semman as Low. The dataset also shows about 0.0% of listings with registration evidence. That is a market signal, not legal advice, so hosts should still confirm current licensing and compliance rules locally before listing.
What is the RevPAR for Airbnb in Nazlet El-Semman?
RevPAR in Nazlet El-Semman is about $19. That metric combines pricing and occupancy into one efficiency number, so it is often a better quick benchmark than ADR alone when investors want to compare how well listings convert nightly rates into realized revenue.
Is Airbnb profitable in Nazlet El-Semman?
Occupancy of 31.3% means Nazlet El-Semman is a more selective market. Profitability is achievable but requires careful cost management, premium positioning, or targeting longer stays to reduce turnover. Average annual revenue is $5,286, but individual returns depend on property type, location within the city, and the host's operating efficiency.
How far in advance do guests book Airbnb in Nazlet El-Semman?
The average booking lead time in Nazlet El-Semman is about 26 days — a moderate lead time that gives hosts planning visibility while still benefiting from last-minute bookings. Hosts who understand their market's booking cadence can adjust minimum stays and pricing windows accordingly.
What are the best neighborhoods for Airbnb in Nazlet El-Semman?
Based on AirROI's analysis, some of the top neighborhoods for short-term rentals in Nazlet El-Semman include Pyramids View, Sakkara, Nile viewing area. Each area attracts different guest profiles — from business travelers to leisure visitors — so the best location depends on the property type and target audience a host is aiming for. See the full neighborhood breakdown above.
What type of property performs best on Airbnb in Nazlet El-Semman?
private_room listings make up 61.7% of the active supply in Nazlet El-Semman. The most common configuration does not always mean the most profitable — operators who identify underserved property types or bedroom counts can sometimes outperform the market average by filling a gap in local supply.
How does Nazlet El-Semman compare to nearby Airbnb markets?
Among neighboring markets, Al Gabalayah posts $15,826 in average annual revenue with 39.3% occupancy, compared to Nazlet El-Semman's $5,286 and 31.3%. Comparing nearby markets helps investors understand whether a destination's performance reflects local demand or broader regional trends.
What is the average length of stay in Nazlet El-Semman?
The average Airbnb stay length in Nazlet El-Semman is about 3.2 nights. That matters for turnover, cleaning operations, and pricing strategy because shorter stays increase changeovers while longer stays can smooth occupancy and reduce operational friction.
What is the average Airbnb guest rating in Nazlet El-Semman?
Airbnb listings in Nazlet El-Semman average 4.75 out of 5 overall. About 34.0% of listings carry the guest favorite badge, which suggests a meaningful share of inventory is competing on review quality rather than price alone.
Which amenities boost Airbnb revenue in Nazlet El-Semman?
Cooking basics and Stove are among the strongest revenue-linked amenities in Nazlet El-Semman. In AirROI's latest dataset, listings with these amenities outperform those without on average revenue, which makes amenities analysis useful for prioritizing investment and listing upgrades.
Do Airbnb hosts charge cleaning fees in Nazlet El-Semman?
Yes. About 51.1% of active Airbnb listings in Nazlet El-Semman charge a cleaning fee, and the average fee is $10. The more important operating benchmark is how much of gross revenue that fee consumes, not just the absolute dollar amount.
What percentage of Airbnb hosts are Superhosts in Nazlet El-Semman?
A 53.2% Superhost rate signals a highly competitive market where review quality and responsiveness are table stakes, not differentiators.
About AirROI Market Data
AirROI tracks over 20 million properties across 190+ countries and maintains 15+ years of historical performance data, making it one of the deepest Airbnb and STR intelligence platforms available. The analytics pipeline aggregates listing-level data monthly — revenue, occupancy, nightly rates, RevPAR, guest demographics, booking patterns, and competitive supply — so investors and operators can benchmark any market against its own history and against neighboring destinations.
Real estate investors, property managers, financial institutions, hedge funds, tourism boards, hospitality consultants, tech platforms, and academic researchers rely on AirROI data to underwrite acquisitions, optimize pricing, model macro trends, and conduct peer-reviewed research. Data is available through in-depth market reports like this one and the Airbnb API with 22 endpoints and an Airbnb MCP Server for AI agents.
AirROI proprietary analytics as of 2026-03-31. Metrics reflect trailing twelve-month aggregates from active listings. Revenue figures are market averages, not projections. Neighborhood descriptions are AI-generated and reviewed for accuracy. For full methodology, see the data methodology page.