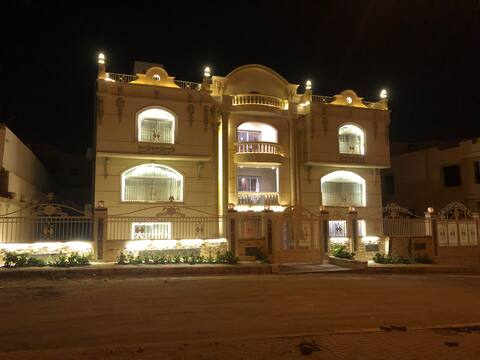
Sheikh Zayed Airbnb Market Analysis 2026: Short Term Rental Data & Vacation Rental Statistics in Giza, Egypt
Is Airbnb profitable in Sheikh Zayed in 2026? Explore comprehensive Airbnb analytics for Sheikh Zayed, Giza, Egypt to uncover income potential. This 2026 STR market report for Sheikh Zayed, based on AirROI data from February 2025 to January 2026, reveals key trends in the niche market of 28 active listings.
Whether you're considering an Airbnb investment in Sheikh Zayed, optimizing your existing vacation rental, or exploring rental arbitrage opportunities, understanding the Sheikh Zayed Airbnb data is crucial. Leveraging the low regulation environment is key to maximizing your short term rental income potential. Let's dive into the specifics.
Key Sheikh Zayed Airbnb Performance Metrics Overview
Monthly Airbnb Revenue Variations & Income Potential in Sheikh Zayed (2026)
Understanding the monthly revenue variations for Airbnb listings in Sheikh Zayed is key to maximizing your short term rental income potential. Seasonality significantly impacts earnings. Our analysis, based on data from the past 12 months, shows that the peak revenue month for STRs in Sheikh Zayed is typically May, while January often presents the lowest earnings, highlighting opportunities for strategic pricing adjustments during shoulder and low seasons. Explore the typical Airbnb income in Sheikh Zayed across different performance tiers:
- Best-in-class properties (Top 10%) achieve $2,067+ monthly, often utilizing dynamic pricing and superior guest experiences.
- Strong performing properties (Top 25%) earn $1,247 or more, indicating effective management and desirable locations/amenities.
- Typical properties (Median) generate around $615 per month, representing the average market performance.
- Entry-level properties (Bottom 25%) see earnings around $307, often with potential for optimization.
Average Monthly Airbnb Earnings Trend in Sheikh Zayed
Sheikh Zayed Airbnb Occupancy Rate Trends (2026)
Maximize your bookings by understanding the Sheikh Zayed STR occupancy trends. Seasonal demand shifts significantly influence how often properties are booked. Typically, Julysees the highest demand (peak season occupancy), while December experiences the lowest (low season). Effective strategies, like adjusting minimum stays or offering promotions, can boost occupancy during slower periods. Here's how different property tiers perform in Sheikh Zayed:
- Best-in-class properties (Top 10%) achieve 66%+ occupancy, indicating high desirability and potentially optimized availability.
- Strong performing properties (Top 25%) maintain 45% or higher occupancy, suggesting good market fit and guest satisfaction.
- Typical properties (Median) have an occupancy rate around 26%.
- Entry-level properties (Bottom 25%) average 11% occupancy, potentially facing higher vacancy.
Average Monthly Occupancy Rate Trend in Sheikh Zayed
Average Daily Rate (ADR) Airbnb Trends in Sheikh Zayed (2026)
Effective short term rental pricing strategy in Sheikh Zayed involves understanding monthly ADR fluctuations. The Average Daily Rate (ADR) for Airbnb in Sheikh Zayed typically peaks in November and dips lowest during March. Leveraging Airbnb dynamic pricing tools or strategies based on this seasonality can significantly boost revenue. Here's a look at the typical nightly rates achieved:
- Best-in-class properties (Top 10%) command rates of $158+ per night, often due to premium features or locations.
- Strong performing properties (Top 25%) achieve nightly rates of $94 or more.
- Typical properties (Median) charge around $68 per night.
- Entry-level properties (Bottom 25%) earn around $48 per night.
Average Daily Rate (ADR) Trend by Month in Sheikh Zayed
Get Live Sheikh Zayed Market Intelligence 👇

Explore Real-time Analytics
Airbnb Seasonality Analysis & Trends in Sheikh Zayed (2026)
Peak Season (May, June, August)
- Revenue averages $1,323 per month
- Occupancy rates average 31.5%
- Daily rates average $114
Shoulder Season
- Revenue averages $840 per month
- Occupancy maintains around 33.8%
- Daily rates hold near $112
Low Season (January, March, November)
- Revenue drops to average $521 per month
- Occupancy decreases to average 25.5%
- Daily rates adjust to average $113
Seasonality Insights for Sheikh Zayed
- The Airbnb seasonality in Sheikh Zayed shows highly seasonal trends requiring careful strategy. While the sections above show seasonal averages, it's also insightful to look at the extremes:
- During the high season, the absolute peak month showcases Sheikh Zayed's highest earning potential, with monthly revenues capable of climbing to $1,673, occupancy reaching a high of 42.9%, and ADRs peaking at $117.
- Conversely, the slowest single month of the year, typically falling within the low season, marks the market's lowest point. In this month, revenue might dip to $427, occupancy could drop to 21.2%, and ADRs may adjust down to $108.
- Understanding both the seasonal averages and these monthly peaks and troughs in revenue, occupancy, and ADR is crucial for maximizing your Airbnb profit potential in Sheikh Zayed.
Seasonal Strategies for Maximizing Profit
- Peak Season: Maximize revenue through premium pricing and potentially longer minimum stays. Ensure high availability.
- Low Season: Offer competitive pricing, special promotions (e.g., extended stay discounts), and flexible cancellation policies. Target off-season travelers like remote workers or budget-conscious guests.
- Shoulder Seasons: Implement dynamic pricing that balances peak and low rates. Target weekend travelers or specific events. Offer slightly more flexible terms than peak season.
- Regularly analyze your own performance against these Sheikh Zayed seasonality benchmarks and adjust your pricing and availability strategy accordingly.
Best Areas for Airbnb Investment in Sheikh Zayed (2026)
Exploring the top neighborhoods for short-term rentals in Sheikh Zayed? This section highlights key areas, outlining why they are attractive for hosts and guests, along with notable local attractions. Consider these locations based on your target guest profile and investment strategy.
| Neighborhood / Area | Why Host Here? (Target Guests & Appeal) | Key Attractions & Landmarks |
|---|---|---|
| Zamalek | Zamalek is a leafy, upscale district known for its cultural and artistic vibe. It's popular among expatriates and offers a variety of attractions, making it appealing for tourists. | Cairo Opera House, Zamalek Art Galleries, Seventh Heaven Shopping Mall, Al-Ahly Sporting Club, Gezira Island |
| Maadi | Known for its spacious streets and greenery, Maadi is a favored area for families and expats. It has a suburban feel while being close to the city center. | Maadi Grand Mall, American International School, Al-Maadi's Parks, Cairo Felucca Ride, Cairo Metro |
| Downtown Cairo | The heart of Cairo, Downtown offers a mix of modern shopping and historical sites. It's an ideal location for tourists who want to experience the city's rich history. | Tahrir Square, Egyptian Museum, Abdeen Palace, Cairo Opera House, Shopping on Mohamed Mahmoud Street |
| New Cairo | A modern and expanding area with many new developments and shopping centers, it attracts both locals and international visitors looking for contemporary accommodations. | The American University in Cairo, Cairo Festival City Mall, New Cairo Sports Club, Green Square, The Waterway |
| Heliopolis | A vibrant district known for its historical architecture, shopping centers, and restaurants. It attracts a variety of visitors looking for cultural experiences. | Baron Empain Palace, City Stars Mall, Jardins du Roy, Al-Ahram Gardens, Meriland Park |
| 6th of October City | A planned city with modern amenities and close proximity to various tourist attractions such as pyramids, making it suitable for short-term renting. | Dream Park, October Gardens, Mall of Arabia, Arabic Culture Centre, Egyptian Pyramids |
| Sheikh Zayed City | A rapidly developing urban area with modern shopping and residential options, appealing to young professionals and expatriates. | Zed Park, Arkan Plaza, The British International School, Sheikh Zayed Cricket Club, Cairo Egyptian Museum |
| Giza | Famous for the Giza Plateau and the pyramids, this area draws countless tourists seeking accommodation close to these iconic landmarks. | The Great Pyramid of Giza, The Sphinx, Solar Boat Museum, Giza Plateau, Tantalizing Egyptian Cuisine |
Understanding Airbnb License Requirements & STR Laws in Sheikh Zayed (2026)
While Sheikh Zayed, Giza, Egypt currently shows low STR regulations, specific Airbnb license requirements might still exist or change. Always verify the latest short term rental regulations and Airbnb license requirements directly with local government authorities for Sheikh Zayed to ensure full compliance before hosting.
(Source: AirROI data, 2026, based on 7% licensed listings)
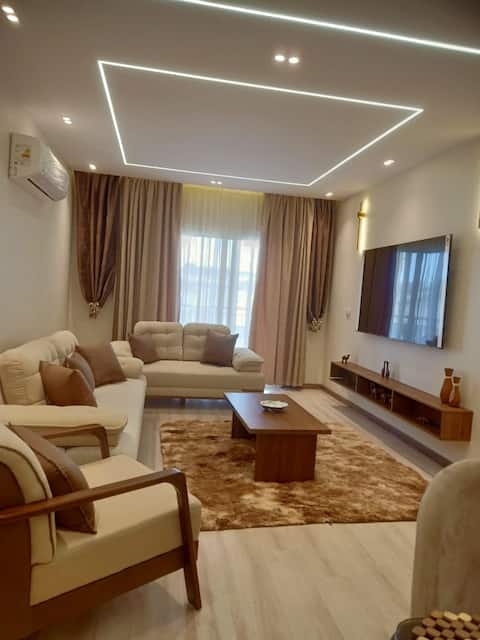
Top Performing Airbnb Properties in Sheikh Zayed (2026)
Benchmark your potential! Explore examples of top-performing Airbnb properties in Sheikh Zayedbased on Trailing Twelve Month (TTM) revenue. Analyze their characteristics, revenue, occupancy rate, and ADR to understand what drives success in this market.

Sheikh Zayed | New Giza | Near GEM & MOA
Entire Place • 3 bedrooms
Villa in shekh zayed city
Entire Place • 8 bedrooms

Dreamland Stylish 2BD with a garden & pool access
Entire Place • 2 bedrooms

Cozy ground 1 BD apt in New Giza
Entire Place • 1 bedroom
Luxurious 2-bedroom apartment in Dreamland
Entire Place • 2 bedrooms

Alsawah | Luxe 7BR All Ensuite @Palm Hills Golf Ex
Entire Place • 7 bedrooms
Note: Performance varies based on location, size, amenities, seasonality, and management quality. Data reflects the past 12 months.
Top Performing Airbnb Hosts in Sheikh Zayed (2026)
Learn from the best! This table showcases top-performing Airbnb hosts in Sheikh Zayed based on the number of properties managed and estimated total revenue over the past year. Analyze their scale and performance metrics.
| Host Name | Properties | Grossing Revenue | Stay Reviews | Avg Rating |
|---|---|---|---|---|
| Kennah | 1 | $20,467 | 12 | 5.00/5.0 |
| Berry | 1 | $15,866 | 1 | Not Rated |
| Al Sawah | 2 | $11,306 | 3 | Not Rated |
| Nasir | 5 | $10,035 | 22 | 4.88/5.0 |
| Aliaa | 1 | $9,996 | 24 | 4.88/5.0 |
| Reham | 1 | $9,473 | 6 | 4.50/5.0 |
| Bassem | 1 | $8,344 | 18 | 5.00/5.0 |
| Mahmoud Malek | 1 | $5,697 | 17 | 4.88/5.0 |
| Jre | 1 | $3,598 | 19 | 4.32/5.0 |
| My Villa Hotel | 2 | $2,733 | 2 | Not Rated |
Analyzing the strategies of top hosts, such as their property selection, pricing, and guest communication, can offer valuable lessons for optimizing your own Airbnb operations in Sheikh Zayed.
Dive Deeper: Advanced Sheikh Zayed STR Market Data (2026)
Ready to unlock more insights? AirROI provides access to advanced metrics and comprehensive Airbnb data for Sheikh Zayed. Explore detailed analytics beyond this report to refine your investment strategy, optimize pricing, and maximize your vacation rental profits.
Explore Advanced MetricsSheikh Zayed Short-Term Rental Market Composition (2026): Property & Room Types
Room Type Distribution
Property Type Distribution
Market Composition Insights for Sheikh Zayed
- The Sheikh Zayed Airbnb market composition is heavily skewed towards Entire Home/Apt listings, which make up 92.9% of the 28 active rentals. This indicates strong guest preference for privacy and space.
- Looking at the property type distribution in Sheikh Zayed, Apartment/Condo properties are the most common (85.7%), reflecting the local real estate landscape.
Sheikh Zayed Airbnb Room Capacity Analysis (2026): Bedroom Distribution
Distribution of Listings by Number of Bedrooms
Room Capacity Insights for Sheikh Zayed
- The dominant room capacity in Sheikh Zayed is 2 bedrooms listings, making up 32.1% of the market. This suggests a strong demand for properties suitable for couples or solo travelers.
- Together, 2 bedrooms and 3 bedrooms properties represent 64.2% of the active Airbnb listings in Sheikh Zayed, indicating a high concentration in these sizes.
- A significant 46.4% of listings offer 3+ bedrooms, catering to larger groups and families seeking more space in Sheikh Zayed.
Sheikh Zayed Vacation Rental Guest Capacity Trends (2026)
Distribution of Listings by Guest Capacity
Guest Capacity Insights for Sheikh Zayed
- The most common guest capacity trend in Sheikh Zayed vacation rentals is listings accommodating 6 guests (28.6%). This suggests the primary traveler segment is likely larger groups.
- Properties designed for 6 guests and 4 guests dominate the Sheikh Zayed STR market, accounting for 46.5% of listings.
- 42.9% of properties accommodate 6+ guests, serving the market segment for larger families or group travel in Sheikh Zayed.
- On average, properties in Sheikh Zayed are equipped to host 4.9 guests.
Sheikh Zayed Airbnb Booking Patterns (2026): Available vs. Booked Days
Available Days Distribution
Booked Days Distribution
Booking Pattern Insights for Sheikh Zayed
- The most common availability pattern in Sheikh Zayed falls within the 271-366 days range, representing 85.7% of listings. This suggests many properties have significant open periods on their calendars.
- Approximately 96.4% of listings show high availability (181+ days open annually), indicating potential for increased bookings or specific owner usage patterns.
- For booked days, the 1-30 days range is most frequent in Sheikh Zayed (50%), reflecting common guest stay durations or potential owner blocking patterns.
- A notable 3.6% of properties secure long booking periods (181+ days booked per year), highlighting successful long-term rental strategies or significant owner usage.
Sheikh Zayed Airbnb Minimum Stay Requirements Analysis
Distribution of Listings by Minimum Night Requirement
1 Night
17 listings
60.7% of total
2 Nights
6 listings
21.4% of total
3 Nights
1 listings
3.6% of total
4-6 Nights
1 listings
3.6% of total
7-29 Nights
2 listings
7.1% of total
30+ Nights
1 listings
3.6% of total
Key Insights
- The most prevalent minimum stay requirement in Sheikh Zayed is 1 Night, adopted by 60.7% of listings. This highlights the market's preference for shorter, flexible bookings.
- A strong majority (82.1%) of the Sheikh Zayed Airbnb data shows acceptance of very short stays (1-2 nights), indicating a dynamic, high-turnover market.
Recommendations
- Align with the market by considering a 1 Night minimum stay, as 60.7% of Sheikh Zayed hosts use this setting.
- Adjust minimum nights based on seasonality – potentially shorter during low season and longer during peak demand periods in Sheikh Zayed.
Sheikh Zayed Airbnb Cancellation Policy Trends Analysis (2026)
Flexible
15 listings
53.6% of total
Moderate
7 listings
25% of total
Firm
4 listings
14.3% of total
Strict
2 listings
7.1% of total
Cancellation Policy Insights for Sheikh Zayed
- The prevailing Airbnb cancellation policy trend in Sheikh Zayed is Flexible, used by 53.6% of listings.
- The market strongly favors guest-friendly terms, with 78.6% of listings offering Flexible or Moderate policies. This suggests guests in Sheikh Zayed may expect booking flexibility.
- Strict cancellation policies are quite rare (7.1%), potentially making listings with this policy less competitive unless justified by high demand or property type.
Recommendations for Hosts
- Consider adopting a Flexible policy to align with the 53.6% market standard in Sheikh Zayed.
- Given the high prevalence of Flexible policies (53.6%), offering this can enhance booking appeal, especially during shoulder seasons.
- Using a Strict policy might deter some guests, as only 7.1% of listings use it. Evaluate if potential revenue protection outweighs possible lower booking rates.
- Regularly review your cancellation policy against competitors and market demand shifts in Sheikh Zayed.
Sheikh Zayed STR Booking Lead Time Analysis (2026)
Average Booking Lead Time by Month
Booking Lead Time Insights for Sheikh Zayed
- The overall average booking lead time for vacation rentals in Sheikh Zayed is 20 days.
- Guests book furthest in advance for stays during December (average 35 days), likely coinciding with peak travel demand or local events.
- The shortest booking windows occur for stays in May (average 5 days), indicating more last-minute travel plans during this time.
- Seasonally, Winter (19 days avg.) sees the longest lead times, while Spring (10 days avg.) has the shortest, reflecting typical travel planning cycles.
Recommendations for Hosts
- Use the overall average lead time (20 days) as a baseline for your pricing and availability strategy in Sheikh Zayed.
- For December stays, consider implementing length-of-stay discounts or slightly higher rates for bookings made less than 35 days out to capitalize on advance planning.
- During May, focus on last-minute booking availability and promotions, as guests book with very short notice (5 days avg.).
- Target marketing efforts for the Winter season well in advance (at least 19 days) to capture early planners.
- Monitor your own booking lead times against these Sheikh Zayed averages to identify opportunities for dynamic pricing adjustments.
Popular & Essential Airbnb Amenities in Sheikh Zayed (2026)
Amenity Prevalence
Amenity Insights for Sheikh Zayed
- Essential amenities in Sheikh Zayed that guests expect include: Kitchen, Wifi, Air conditioning, TV. Lacking these (any) could significantly impact bookings.
- Popular amenities like Free parking on premises, Washer, Cooking basics are common but not universal. Offering these can provide a competitive edge.
Recommendations for Hosts
- Ensure your listing includes all essential amenities for Sheikh Zayed: Kitchen, Wifi, Air conditioning, TV.
- Prioritize adding missing essentials: Air conditioning, TV.
- Consider adding popular differentiators like Free parking on premises or Washer to increase appeal.
- Highlight unique or less common amenities you offer (e.g., hot tub, dedicated workspace, EV charger) in your listing description and photos.
- Regularly check competitor amenities in Sheikh Zayed to stay competitive.
Sheikh Zayed Airbnb Guest Demographics & Profile Analysis (2026)
Guest Profile Summary for Sheikh Zayed
- The typical guest profile for Airbnb in Sheikh Zayed consists of predominantly international visitors (77%), with top international origins including Egypt, primarily speaking English or Arabic.
- Domestic travelers account for 23.1% of guests.
- Key international markets include United Arab Emirates (30.8%) and Egypt (23.1%).
- Top languages spoken are English (38.1%) followed by Arabic (23.8%).
Recommendations for Hosts
- Focus marketing internationally, particularly towards travelers from Egypt.
- Highlight unique local experiences or amenities relevant to the primary guest profile.
- Consider seasonal promotions aligned with peak travel times for key origin markets.
Nearby Short-Term Rental Market Comparison
How does the Sheikh Zayed Airbnb market stack up against its neighbors? Compare key performance metrics like average monthly revenue, ADR, and occupancy rates in surrounding areas to understand the broader regional STR landscape.
| Market | Active Properties | Monthly Revenue | Daily Rate | Avg. Occupancy |
|---|---|---|---|---|
| Al Gabalayah | 44 | $1,311 | $99.00 | 40% |
| Omar Al Khayam | 39 | $1,005 | $104.88 | 42% |
| Abu Al Feda | 188 | $963 | $106.33 | 39% |
| Mohammed Mazhar | 179 | $939 | $95.46 | 37% |
| October Hills | 31 | $875 | $108.02 | 35% |
| Nasr City | 20 | $714 | $80.15 | 44% |
| New Cairo 1 | 141 | $652 | $93.73 | 39% |
| Zamalek | 115 | $625 | $92.15 | 35% |
| Remaya Square | 116 | $607 | $73.22 | 37% |
| Maadi | 21 | $605 | $81.91 | 43% |