Luxor Airbnb Market Analysis 2026: Short Term Rental Data & Vacation Rental Statistics in Luxor Governorate, Egypt
Is Airbnb profitable in Luxor in 2026? Explore comprehensive Airbnb analytics for Luxor, Luxor Governorate, Egypt to uncover income potential. This 2026 STR market report for Luxor, based on AirROI data from February 2025 to January 2026, reveals key trends in the niche market of 38 active listings.
Whether you're considering an Airbnb investment in Luxor, optimizing your existing vacation rental, or exploring rental arbitrage opportunities, understanding the Luxor Airbnb data is crucial. Leveraging the low regulation environment is key to maximizing your short term rental income potential. Let's dive into the specifics.
Key Luxor Airbnb Performance Metrics Overview
Monthly Airbnb Revenue Variations & Income Potential in Luxor (2026)
Understanding the monthly revenue variations for Airbnb listings in Luxor is key to maximizing your short term rental income potential. Seasonality significantly impacts earnings. Our analysis, based on data from the past 12 months, shows that the peak revenue month for STRs in Luxor is typically April, while June often presents the lowest earnings, highlighting opportunities for strategic pricing adjustments during shoulder and low seasons. Explore the typical Airbnb income in Luxor across different performance tiers:
- Best-in-class properties (Top 10%) achieve $814+ monthly, often utilizing dynamic pricing and superior guest experiences.
- Strong performing properties (Top 25%) earn $387 or more, indicating effective management and desirable locations/amenities.
- Typical properties (Median) generate around $163 per month, representing the average market performance.
- Entry-level properties (Bottom 25%) see earnings around $91, often with potential for optimization.
Average Monthly Airbnb Earnings Trend in Luxor
Luxor Airbnb Occupancy Rate Trends (2026)
Maximize your bookings by understanding the Luxor STR occupancy trends. Seasonal demand shifts significantly influence how often properties are booked. Typically, Januarysees the highest demand (peak season occupancy), while July experiences the lowest (low season). Effective strategies, like adjusting minimum stays or offering promotions, can boost occupancy during slower periods. Here's how different property tiers perform in Luxor:
- Best-in-class properties (Top 10%) achieve 51%+ occupancy, indicating high desirability and potentially optimized availability.
- Strong performing properties (Top 25%) maintain 29% or higher occupancy, suggesting good market fit and guest satisfaction.
- Typical properties (Median) have an occupancy rate around 16%.
- Entry-level properties (Bottom 25%) average 10% occupancy, potentially facing higher vacancy.
Average Monthly Occupancy Rate Trend in Luxor
Average Daily Rate (ADR) Airbnb Trends in Luxor (2026)
Effective short term rental pricing strategy in Luxor involves understanding monthly ADR fluctuations. The Average Daily Rate (ADR) for Airbnb in Luxor typically peaks in June and dips lowest during December. Leveraging Airbnb dynamic pricing tools or strategies based on this seasonality can significantly boost revenue. Here's a look at the typical nightly rates achieved:
- Best-in-class properties (Top 10%) command rates of $78+ per night, often due to premium features or locations.
- Strong performing properties (Top 25%) achieve nightly rates of $53 or more.
- Typical properties (Median) charge around $37 per night.
- Entry-level properties (Bottom 25%) earn around $25 per night.
Average Daily Rate (ADR) Trend by Month in Luxor
Get Live Luxor Market Intelligence 👇
Explore Real-time Analytics
Airbnb Seasonality Analysis & Trends in Luxor (2026)
Peak Season (April, March, May)
- Revenue averages $705 per month
- Occupancy rates average 21.0%
- Daily rates average $50
Shoulder Season
- Revenue averages $418 per month
- Occupancy maintains around 27.0%
- Daily rates hold near $45
Low Season (June, July, August)
- Revenue drops to average $180 per month
- Occupancy decreases to average 14.7%
- Daily rates adjust to average $50
Seasonality Insights for Luxor
- The Airbnb seasonality in Luxor shows highly seasonal trends requiring careful strategy. While the sections above show seasonal averages, it's also insightful to look at the extremes:
- During the high season, the absolute peak month showcases Luxor's highest earning potential, with monthly revenues capable of climbing to $744, occupancy reaching a high of 36.1%, and ADRs peaking at $52.
- Conversely, the slowest single month of the year, typically falling within the low season, marks the market's lowest point. In this month, revenue might dip to $136, occupancy could drop to 11.2%, and ADRs may adjust down to $44.
- Understanding both the seasonal averages and these monthly peaks and troughs in revenue, occupancy, and ADR is crucial for maximizing your Airbnb profit potential in Luxor.
Seasonal Strategies for Maximizing Profit
- Peak Season: Maximize revenue through premium pricing and potentially longer minimum stays. Ensure high availability.
- Low Season: Offer competitive pricing, special promotions (e.g., extended stay discounts), and flexible cancellation policies. Target off-season travelers like remote workers or budget-conscious guests.
- Shoulder Seasons: Implement dynamic pricing that balances peak and low rates. Target weekend travelers or specific events. Offer slightly more flexible terms than peak season.
- Regularly analyze your own performance against these Luxor seasonality benchmarks and adjust your pricing and availability strategy accordingly.
Best Areas for Airbnb Investment in Luxor (2026)
Exploring the top neighborhoods for short-term rentals in Luxor? This section highlights key areas, outlining why they are attractive for hosts and guests, along with notable local attractions. Consider these locations based on your target guest profile and investment strategy.
| Neighborhood / Area | Why Host Here? (Target Guests & Appeal) | Key Attractions & Landmarks |
|---|---|---|
| East Bank | The East Bank is home to many of Luxor's most famous temples and sites, making it a prime location for visitors interested in Ancient Egyptian history. | Karnak Temple, Luxor Temple, The Avenue of Sphinxes, Valley of the Kings, Mummification Museum |
| West Bank | Famous for its archaeological sites and quieter atmosphere, the West Bank appeals to travelers looking for a more relaxed environment while still being close to attractions. | Valley of the Queens, Hatshepsut Temple, Colossi of Memnon, Tomb of Tutankhamun, Mortuary Temple of Hatshepsut |
| Downtown Luxor | The vibrant hub of Luxor with shops, restaurants, and a lively atmosphere, ideal for those seeking urban experiences combined with historical context. | Luxor Market, Local eateries, Luxor Temple at night, Nile Corniche |
| Nile River Corniche | Offers stunning views of the Nile River and is a popular area for evening strolls, dining, and enjoying the sunset, appealing to both tourists and locals. | Felucca rides, Nile views, Sunset cafes, Luxor Temple nearby |
| Colossi of Memnon area | A less touristy area that provides a serene setting away from the crowds, perfect for guests seeking tranquility yet close to archaeological wonders. | Colossi of Memnon, Sunset views of the mountains, Local farms and fields |
| Luxor Museum area | Home to the impressive Luxor Museum and other cultural sites, this area attracts visitors who are interested in art and history. | Luxor Museum, Artifacts from Ancient Egypt, Cultural exhibitions |
| Desert Road to Valley of the Kings | Scenic drives leading to major archaeological sites provide stunning landscapes, making it appealing for those who want to explore the surrounding nature. | Scenic desert views, Access to Valley of the Kings, Local Bedouin culture |
| Karnak area | Proximity to the Karnak Temple complex ensures a steady stream of visitors looking to explore one of Egypt's largest temple complexes. | Karnak Temple, Sound and Light Show at Karnak, Ancient Obelisks |
Understanding Airbnb License Requirements & STR Laws in Luxor (2026)
While Luxor, Luxor Governorate, Egypt currently shows low STR regulations, specific Airbnb license requirements might still exist or change. Always verify the latest short term rental regulations and Airbnb license requirements directly with local government authorities for Luxor to ensure full compliance before hosting.
(Source: AirROI data, 2026, finding no licensed listings among those analyzed)
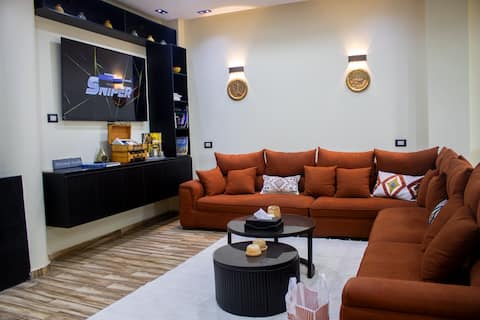
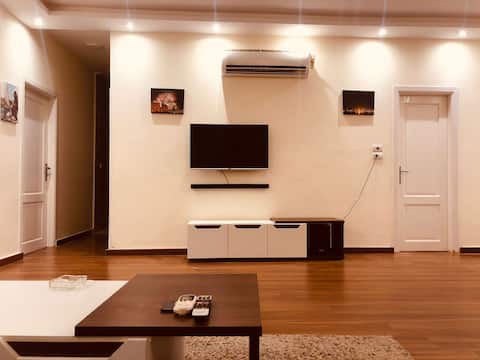
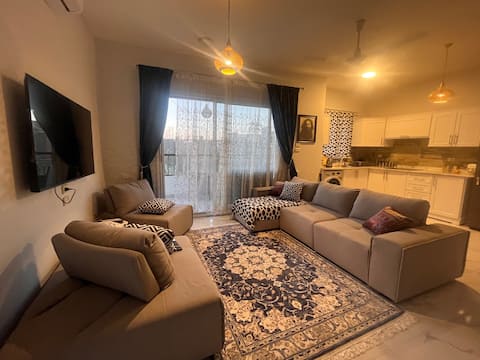
Top Performing Airbnb Properties in Luxor (2026)
Benchmark your potential! Explore examples of top-performing Airbnb properties in Luxorbased on Trailing Twelve Month (TTM) revenue. Analyze their characteristics, revenue, occupancy rate, and ADR to understand what drives success in this market.
Luxor apartment and rooftop with Nile views
Entire Place • 4 bedrooms

Villa Sahara - Horus Room 3
Private Room • N/A
Sphinx Luxor Apartment
Entire Place • 2 bedrooms
Isis Throne at Amenti Villa
Private Room • 2 bedrooms

L’Aziza oasis by the Nile
Entire Place • 3 bedrooms
Charming 3BR in Serenity House
Entire Place • 3 bedrooms
Note: Performance varies based on location, size, amenities, seasonality, and management quality. Data reflects the past 12 months.
Top Performing Airbnb Hosts in Luxor (2026)
Learn from the best! This table showcases top-performing Airbnb hosts in Luxor based on the number of properties managed and estimated total revenue over the past year. Analyze their scale and performance metrics.
| Host Name | Properties | Grossing Revenue | Stay Reviews | Avg Rating |
|---|---|---|---|---|
| Magda | 5 | $8,778 | 106 | 4.95/5.0 |
| Sophia And Louisa | 2 | $7,055 | 14 | 5.00/5.0 |
| Sophie | 1 | $6,286 | 2 | Not Rated |
| Linda | 2 | $5,418 | 121 | 4.92/5.0 |
| Khaled | 1 | $3,843 | 21 | 4.76/5.0 |
| Hassan | 1 | $3,704 | 3 | 5.00/5.0 |
| Natacha | 1 | $3,391 | 2 | Not Rated |
| Ali | 1 | $3,307 | 4 | 5.00/5.0 |
| Susan And Ramzy | 3 | $3,123 | 115 | 4.90/5.0 |
| Lucia | 1 | $2,781 | 13 | 4.15/5.0 |
Analyzing the strategies of top hosts, such as their property selection, pricing, and guest communication, can offer valuable lessons for optimizing your own Airbnb operations in Luxor.
Dive Deeper: Advanced Luxor STR Market Data (2026)
Ready to unlock more insights? AirROI provides access to advanced metrics and comprehensive Airbnb data for Luxor. Explore detailed analytics beyond this report to refine your investment strategy, optimize pricing, and maximize your vacation rental profits.
Explore Advanced MetricsLuxor Short-Term Rental Market Composition (2026): Property & Room Types
Room Type Distribution
Property Type Distribution
Market Composition Insights for Luxor
- The Luxor Airbnb market composition is heavily skewed towards Entire Home/Apt listings, which make up 71.1% of the 38 active rentals. This indicates strong guest preference for privacy and space.
- Looking at the property type distribution in Luxor, Apartment/Condo properties are the most common (68.4%), reflecting the local real estate landscape.
- Houses represent a significant 15.8% portion, catering likely to families or larger groups.
- The presence of 13.2% Hotel/Boutique listings indicates integration with traditional hospitality.
- Smaller segments like unique stays (combined 2.6%) offer potential for unique stay experiences.
Luxor Airbnb Room Capacity Analysis (2026): Bedroom Distribution
Distribution of Listings by Number of Bedrooms
Room Capacity Insights for Luxor
- The dominant room capacity in Luxor is 2 bedrooms listings, making up 34.2% of the market. This suggests a strong demand for properties suitable for couples or solo travelers.
- Together, 2 bedrooms and 1 bedroom properties represent 55.3% of the active Airbnb listings in Luxor, indicating a high concentration in these sizes.
- A significant 34.2% of listings offer 3+ bedrooms, catering to larger groups and families seeking more space in Luxor.
Luxor Vacation Rental Guest Capacity Trends (2026)
Distribution of Listings by Guest Capacity
Guest Capacity Insights for Luxor
- The most common guest capacity trend in Luxor vacation rentals is listings accommodating 4 guests (26.3%). This suggests the primary traveler segment is likely small families or groups.
- Properties designed for 4 guests and 2 guests dominate the Luxor STR market, accounting for 42.1% of listings.
- 29.0% of properties accommodate 6+ guests, serving the market segment for larger families or group travel in Luxor.
- On average, properties in Luxor are equipped to host 3.8 guests.
Luxor Airbnb Booking Patterns (2026): Available vs. Booked Days
Available Days Distribution
Booked Days Distribution
Booking Pattern Insights for Luxor
- The most common availability pattern in Luxor falls within the 271-366 days range, representing 100% of listings. This suggests many properties have significant open periods on their calendars.
- Approximately 100.0% of listings show high availability (181+ days open annually), indicating potential for increased bookings or specific owner usage patterns.
- For booked days, the 31-90 days range is most frequent in Luxor (60.5%), reflecting common guest stay durations or potential owner blocking patterns.
Luxor Airbnb Minimum Stay Requirements Analysis
Distribution of Listings by Minimum Night Requirement
1 Night
33 listings
86.8% of total
2 Nights
4 listings
10.5% of total
30+ Nights
1 listings
2.6% of total
Key Insights
- The most prevalent minimum stay requirement in Luxor is 1 Night, adopted by 86.8% of listings. This highlights the market's preference for shorter, flexible bookings.
- A strong majority (97.3%) of the Luxor Airbnb data shows acceptance of very short stays (1-2 nights), indicating a dynamic, high-turnover market.
- Dedicated monthly rentals (30+ nights) represent a small niche (2.6%), possibly an untapped area for hosts.
Recommendations
- Align with the market by considering a 1 Night minimum stay, as 86.8% of Luxor hosts use this setting.
- Adjust minimum nights based on seasonality – potentially shorter during low season and longer during peak demand periods in Luxor.
Luxor Airbnb Cancellation Policy Trends Analysis (2026)
Flexible
24 listings
63.2% of total
Moderate
10 listings
26.3% of total
Firm
3 listings
7.9% of total
Strict
1 listings
2.6% of total
Cancellation Policy Insights for Luxor
- The prevailing Airbnb cancellation policy trend in Luxor is Flexible, used by 63.2% of listings.
- The market strongly favors guest-friendly terms, with 89.5% of listings offering Flexible or Moderate policies. This suggests guests in Luxor may expect booking flexibility.
- Strict cancellation policies are quite rare (2.6%), potentially making listings with this policy less competitive unless justified by high demand or property type.
Recommendations for Hosts
- Consider adopting a Flexible policy to align with the 63.2% market standard in Luxor.
- Given the high prevalence of Flexible policies (63.2%), offering this can enhance booking appeal, especially during shoulder seasons.
- Using a Strict policy might deter some guests, as only 2.6% of listings use it. Evaluate if potential revenue protection outweighs possible lower booking rates.
- Regularly review your cancellation policy against competitors and market demand shifts in Luxor.
Luxor STR Booking Lead Time Analysis (2026)
Average Booking Lead Time by Month
Booking Lead Time Insights for Luxor
- The overall average booking lead time for vacation rentals in Luxor is 40 days.
- Guests book furthest in advance for stays during August (average 63 days), likely coinciding with peak travel demand or local events.
- The shortest booking windows occur for stays in June (average 4 days), indicating more last-minute travel plans during this time.
- Seasonally, Fall (49 days avg.) sees the longest lead times, while Winter (27 days avg.) has the shortest, reflecting typical travel planning cycles.
Recommendations for Hosts
- Use the overall average lead time (40 days) as a baseline for your pricing and availability strategy in Luxor.
- For August stays, consider implementing length-of-stay discounts or slightly higher rates for bookings made less than 63 days out to capitalize on advance planning.
- During June, focus on last-minute booking availability and promotions, as guests book with very short notice (4 days avg.).
- Target marketing efforts for the Fall season well in advance (at least 49 days) to capture early planners.
- Monitor your own booking lead times against these Luxor averages to identify opportunities for dynamic pricing adjustments.
Popular & Essential Airbnb Amenities in Luxor (2026)
Amenity Prevalence
Amenity Insights for Luxor
- Popular amenities like Air conditioning, Washer, Wifi are common but not universal. Offering these can provide a competitive edge.
- Warning: Wifi is not universally provided but is considered essential globally. Ensure reliable Wifi is offered.
Recommendations for Hosts
- Consider adding popular differentiators like Air conditioning or Washer to increase appeal.
- Highlight unique or less common amenities you offer (e.g., hot tub, dedicated workspace, EV charger) in your listing description and photos.
- Regularly check competitor amenities in Luxor to stay competitive.
Luxor Airbnb Guest Demographics & Profile Analysis (2026)
Guest Profile Summary for Luxor
- The typical guest profile for Airbnb in Luxor consists of predominantly international visitors (99%), with top international origins including China, typically belonging to the Post-2000s (Gen Z/Alpha) group (50%), primarily speaking English or Spanish.
- Domestic travelers account for 0.9% of guests.
- Key international markets include United Kingdom (14%) and China (13.2%).
- Top languages spoken are English (44.5%) followed by Spanish (12.9%).
- A significant demographic segment is the Post-2000s (Gen Z/Alpha) group, representing 50% of guests.
Recommendations for Hosts
- Focus marketing internationally, particularly towards travelers from China.
- Tailor amenities and listing descriptions to appeal to the dominant Post-2000s (Gen Z/Alpha) demographic (e.g., highlight fast WiFi, smart home features, local guides).
- Highlight unique local experiences or amenities relevant to the primary guest profile.
- Consider seasonal promotions aligned with peak travel times for key origin markets.
Nearby Short-Term Rental Market Comparison
How does the Luxor Airbnb market stack up against its neighbors? Compare key performance metrics like average monthly revenue, ADR, and occupancy rates in surrounding areas to understand the broader regional STR landscape.
| Market | Active Properties | Monthly Revenue | Daily Rate | Avg. Occupancy |
|---|---|---|---|---|
| Ras Abu Soma | 54 | $884 | $160.33 | 30% |
| Safaga | 48 | $545 | $92.33 | 32% |
| Saleh Gahin | 10 | $522 | $59.70 | 30% |
| Aswan | 20 | $409 | $84.44 | 25% |
| Al Baairat Village | 259 | $392 | $48.27 | 32% |
| Jazirat al Awamiya | 14 | $269 | $41.92 | 29% |
| Red Sea Governorate | 10 | $233 | $72.88 | 23% |
| Nagaa Al Mahata | 15 | $231 | $52.06 | 25% |
| New Al Qarnh City | 21 | $221 | $54.86 | 21% |
| Taqouk Mountain | 24 | $185 | $38.62 | 22% |