Hurghada 2 Airbnb Market Analysis 2026: Short Term Rental Data & Vacation Rental Statistics in Red Sea Governorate, Egypt
Is Airbnb profitable in Hurghada 2 in 2026? Explore comprehensive Airbnb analytics for Hurghada 2, Red Sea Governorate, Egypt to uncover income potential. This 2026 STR market report for Hurghada 2, based on AirROI data from February 2025 to January 2026, reveals key trends in the niche market of 107 active listings.
Whether you're considering an Airbnb investment in Hurghada 2, optimizing your existing vacation rental, or exploring rental arbitrage opportunities, understanding the Hurghada 2 Airbnb data is crucial. Leveraging the low regulation environment is key to maximizing your short term rental income potential. Let's dive into the specifics.
Key Hurghada 2 Airbnb Performance Metrics Overview
Monthly Airbnb Revenue Variations & Income Potential in Hurghada 2 (2026)
Understanding the monthly revenue variations for Airbnb listings in Hurghada 2 is key to maximizing your short term rental income potential. Seasonality significantly impacts earnings. Our analysis, based on data from the past 12 months, shows that the peak revenue month for STRs in Hurghada 2 is typically October, while February often presents the lowest earnings, highlighting opportunities for strategic pricing adjustments during shoulder and low seasons. Explore the typical Airbnb income in Hurghada 2 across different performance tiers:
- Best-in-class properties (Top 10%) achieve $3,273+ monthly, often utilizing dynamic pricing and superior guest experiences.
- Strong performing properties (Top 25%) earn $1,568 or more, indicating effective management and desirable locations/amenities.
- Typical properties (Median) generate around $812 per month, representing the average market performance.
- Entry-level properties (Bottom 25%) see earnings around $340, often with potential for optimization.
Average Monthly Airbnb Earnings Trend in Hurghada 2
Hurghada 2 Airbnb Occupancy Rate Trends (2026)
Maximize your bookings by understanding the Hurghada 2 STR occupancy trends. Seasonal demand shifts significantly influence how often properties are booked. Typically, Octobersees the highest demand (peak season occupancy), while May experiences the lowest (low season). Effective strategies, like adjusting minimum stays or offering promotions, can boost occupancy during slower periods. Here's how different property tiers perform in Hurghada 2:
- Best-in-class properties (Top 10%) achieve 63%+ occupancy, indicating high desirability and potentially optimized availability.
- Strong performing properties (Top 25%) maintain 50% or higher occupancy, suggesting good market fit and guest satisfaction.
- Typical properties (Median) have an occupancy rate around 25%.
- Entry-level properties (Bottom 25%) average 13% occupancy, potentially facing higher vacancy.
Average Monthly Occupancy Rate Trend in Hurghada 2
Average Daily Rate (ADR) Airbnb Trends in Hurghada 2 (2026)
Effective short term rental pricing strategy in Hurghada 2 involves understanding monthly ADR fluctuations. The Average Daily Rate (ADR) for Airbnb in Hurghada 2 typically peaks in October and dips lowest during July. Leveraging Airbnb dynamic pricing tools or strategies based on this seasonality can significantly boost revenue. Here's a look at the typical nightly rates achieved:
- Best-in-class properties (Top 10%) command rates of $282+ per night, often due to premium features or locations.
- Strong performing properties (Top 25%) achieve nightly rates of $173 or more.
- Typical properties (Median) charge around $91 per night.
- Entry-level properties (Bottom 25%) earn around $60 per night.
Average Daily Rate (ADR) Trend by Month in Hurghada 2
Get Live Hurghada 2 Market Intelligence 👇
Explore Real-time Analytics
Airbnb Seasonality Analysis & Trends in Hurghada 2 (2026)
Peak Season (October, August, December)
- Revenue averages $2,175 per month
- Occupancy rates average 38.7%
- Daily rates average $159
Shoulder Season
- Revenue averages $1,405 per month
- Occupancy maintains around 32.7%
- Daily rates hold near $144
Low Season (February, March, May)
- Revenue drops to average $409 per month
- Occupancy decreases to average 21.2%
- Daily rates adjust to average $143
Seasonality Insights for Hurghada 2
- The Airbnb seasonality in Hurghada 2 shows highly seasonal trends requiring careful strategy. While the sections above show seasonal averages, it's also insightful to look at the extremes:
- During the high season, the absolute peak month showcases Hurghada 2's highest earning potential, with monthly revenues capable of climbing to $2,687, occupancy reaching a high of 44.6%, and ADRs peaking at $174.
- Conversely, the slowest single month of the year, typically falling within the low season, marks the market's lowest point. In this month, revenue might dip to $144, occupancy could drop to 11.8%, and ADRs may adjust down to $131.
- Understanding both the seasonal averages and these monthly peaks and troughs in revenue, occupancy, and ADR is crucial for maximizing your Airbnb profit potential in Hurghada 2.
Seasonal Strategies for Maximizing Profit
- Peak Season: Maximize revenue through premium pricing and potentially longer minimum stays. Ensure high availability.
- Low Season: Offer competitive pricing, special promotions (e.g., extended stay discounts), and flexible cancellation policies. Target off-season travelers like remote workers or budget-conscious guests.
- Shoulder Seasons: Implement dynamic pricing that balances peak and low rates. Target weekend travelers or specific events. Offer slightly more flexible terms than peak season.
- Regularly analyze your own performance against these Hurghada 2 seasonality benchmarks and adjust your pricing and availability strategy accordingly.
Best Areas for Airbnb Investment in Hurghada 2 (2026)
Exploring the top neighborhoods for short-term rentals in Hurghada 2? This section highlights key areas, outlining why they are attractive for hosts and guests, along with notable local attractions. Consider these locations based on your target guest profile and investment strategy.
| Neighborhood / Area | Why Host Here? (Target Guests & Appeal) | Key Attractions & Landmarks |
|---|---|---|
| Sakkala | The heart of Hurghada, bustling with shops, restaurants, and nightlife. It's a favorite among tourists for its accessibility and vibrant atmosphere. | Hurghada Marina, Giftun Island, New Marina, Coriander Restaurant, Hussein's House |
| Dahar | Known for its local culture and markets, Dahar offers a more authentic Egyptian experience. It's great for travelers looking to enjoy the city's traditional lifestyle. | Dahar Market, El Mina Mosque, Desert Rose Resort, Senzo Mall, Local bazaars |
| Al Mamsha El Seyahi | A scenic promenade featuring luxury hotels, beach clubs, and restaurants. Popular among tourists seeking relaxation with direct access to beautiful beaches. | Mamsha Promenade, Holiday Inn Beach, Titanic Aqua Park, Beach Clubs, Water sports activities |
| Makadi Bay | Famous for its stunning beaches and water activities, Makadi Bay is a family-friendly destination that attracts tourists seeking relaxation and adventure. | Makadi Water World, Jungle Aqua Park, Glorious beaches, Golf courses, Underwater diving spots |
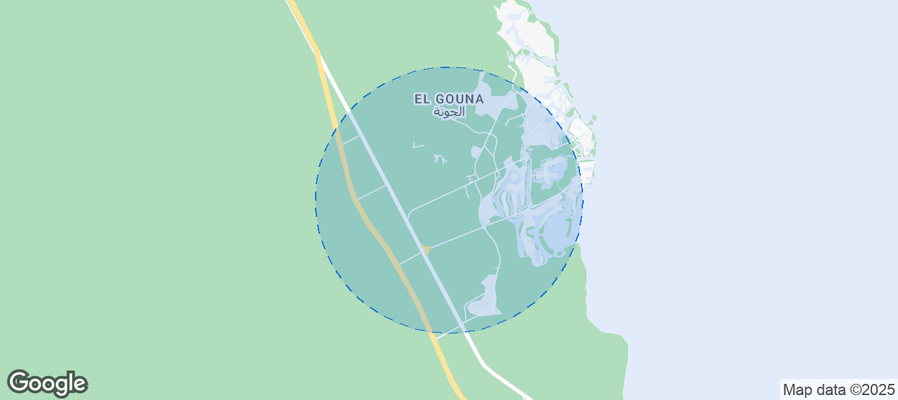
| El Gouna | A charming developed town known for its canals and lagoons. It's a favorite for upscale tourists looking for a unique experience with a variety of activities. | El Gouna Marina, Mausoleum of Hussein, Snorkeling and diving spots, El Gouna Golf Club, Kitesurfing |
| Hurghada Hills | A peaceful area that offers stunning views and luxurious properties. It's perfect for those seeking a more tranquil place away from the busy tourist areas. | Scenic viewpoints, Private villas, Eco-tourism activities, Hiking trails, Local wildlife |
| Sharm El Naga | A scenic bay area offering some of the best snorkeling. It's a great spot for tourists who want to experience marine life in vibrant coral reefs. | Snorkeling and diving spots, Private beaches, Seaside resorts, Marine excursions, Coral reefs |
| Hurghada Marina Boulevard | A lively area filled with restaurants, bars, and shops, making it an attractive spot for tourists looking for nightlife and dining options by the sea. | Marina shops, Dining restaurants, Nightlife spots, Seaside cafes, Live music venues |
Understanding Airbnb License Requirements & STR Laws in Hurghada 2 (2026)
While Hurghada 2, Red Sea Governorate, Egypt currently shows low STR regulations, specific Airbnb license requirements might still exist or change. Always verify the latest short term rental regulations and Airbnb license requirements directly with local government authorities for Hurghada 2 to ensure full compliance before hosting.
(Source: AirROI data, 2026, finding no licensed listings among those analyzed)
Top Performing Airbnb Properties in Hurghada 2 (2026)
Benchmark your potential! Explore examples of top-performing Airbnb properties in Hurghada 2based on Trailing Twelve Month (TTM) revenue. Analyze their characteristics, revenue, occupancy rate, and ADR to understand what drives success in this market.
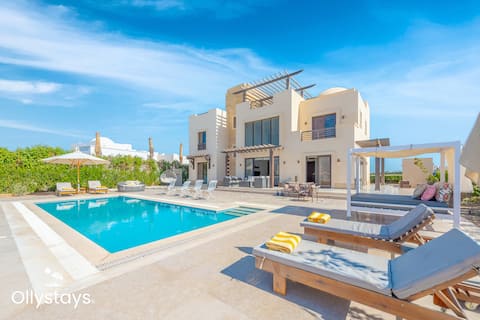
Ancient Sands 4BR Villa Heated pool + nanny room
Entire Place • 4 bedrooms
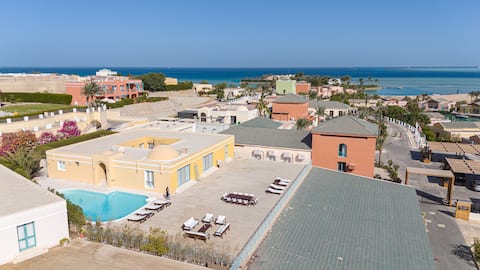
Massive 5BR Hilltop Villa • Luxury Stay
Entire Place • 6 bedrooms

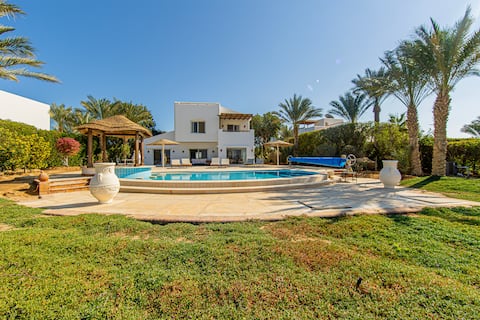
Joubal Seaview Villa Heated Pool & GYM El Gouna
Entire Place • 3 bedrooms
Stunning villa with private heatable pool
Entire Place • 4 bedrooms
Joubal Lagoon 4 BR Villa Heated Pool
Entire Place • 4 bedrooms
Villa Ancient Siena
Entire Place • 6 bedrooms
Note: Performance varies based on location, size, amenities, seasonality, and management quality. Data reflects the past 12 months.
Top Performing Airbnb Hosts in Hurghada 2 (2026)
Learn from the best! This table showcases top-performing Airbnb hosts in Hurghada 2 based on the number of properties managed and estimated total revenue over the past year. Analyze their scale and performance metrics.
| Host Name | Properties | Grossing Revenue | Stay Reviews | Avg Rating |
|---|---|---|---|---|
| Ollystays | 4 | $224,114 | 76 | 4.94/5.0 |
| El Gouna Plus | 10 | $145,284 | 30 | 4.21/5.0 |
| Holidayhome | 2 | $76,159 | 20 | 4.58/5.0 |
| KIKO Real Estate | 3 | $64,163 | 23 | 4.50/5.0 |
| David | 2 | $43,964 | 19 | 4.29/5.0 |
| Birdnest | 5 | $41,182 | 15 | 4.04/5.0 |
| Cozy Stay | 2 | $39,760 | 2 | Not Rated |
| Diana | 1 | $38,977 | 20 | 5.00/5.0 |
| Clémence | 3 | $33,919 | 39 | 4.98/5.0 |
| Sherif | 2 | $30,017 | 18 | 5.00/5.0 |
Analyzing the strategies of top hosts, such as their property selection, pricing, and guest communication, can offer valuable lessons for optimizing your own Airbnb operations in Hurghada 2.
Dive Deeper: Advanced Hurghada 2 STR Market Data (2026)
Ready to unlock more insights? AirROI provides access to advanced metrics and comprehensive Airbnb data for Hurghada 2. Explore detailed analytics beyond this report to refine your investment strategy, optimize pricing, and maximize your vacation rental profits.
Explore Advanced MetricsHurghada 2 Short-Term Rental Market Composition (2026): Property & Room Types
Room Type Distribution
Property Type Distribution
Market Composition Insights for Hurghada 2
- The Hurghada 2 Airbnb market composition is heavily skewed towards Entire Home/Apt listings, which make up 97.2% of the 107 active rentals. This indicates strong guest preference for privacy and space.
- Looking at the property type distribution in Hurghada 2, Apartment/Condo properties are the most common (72%), reflecting the local real estate landscape.
- Houses represent a significant 28% portion, catering likely to families or larger groups.
Hurghada 2 Airbnb Room Capacity Analysis (2026): Bedroom Distribution
Distribution of Listings by Number of Bedrooms
Room Capacity Insights for Hurghada 2
- The dominant room capacity in Hurghada 2 is 2 bedrooms listings, making up 34.6% of the market. This suggests a strong demand for properties suitable for couples or solo travelers.
- Together, 2 bedrooms and 1 bedroom properties represent 67.3% of the active Airbnb listings in Hurghada 2, indicating a high concentration in these sizes.
- A significant 27.1% of listings offer 3+ bedrooms, catering to larger groups and families seeking more space in Hurghada 2.
Hurghada 2 Vacation Rental Guest Capacity Trends (2026)
Distribution of Listings by Guest Capacity
Guest Capacity Insights for Hurghada 2
- The most common guest capacity trend in Hurghada 2 vacation rentals is listings accommodating 4 guests (25.2%). This suggests the primary traveler segment is likely small families or groups.
- Properties designed for 4 guests and 2 guests dominate the Hurghada 2 STR market, accounting for 44.8% of listings.
- 31.8% of properties accommodate 6+ guests, serving the market segment for larger families or group travel in Hurghada 2.
- On average, properties in Hurghada 2 are equipped to host 4.4 guests.
Hurghada 2 Airbnb Booking Patterns (2026): Available vs. Booked Days
Available Days Distribution
Booked Days Distribution
Booking Pattern Insights for Hurghada 2
- The most common availability pattern in Hurghada 2 falls within the 271-366 days range, representing 75.7% of listings. This suggests many properties have significant open periods on their calendars.
- Approximately 96.3% of listings show high availability (181+ days open annually), indicating potential for increased bookings or specific owner usage patterns.
- For booked days, the 31-90 days range is most frequent in Hurghada 2 (44.9%), reflecting common guest stay durations or potential owner blocking patterns.
- A notable 6.5% of properties secure long booking periods (181+ days booked per year), highlighting successful long-term rental strategies or significant owner usage.
Hurghada 2 Airbnb Minimum Stay Requirements Analysis
Distribution of Listings by Minimum Night Requirement
1 Night
15 listings
14% of total
2 Nights
11 listings
10.3% of total
3 Nights
34 listings
31.8% of total
4-6 Nights
5 listings
4.7% of total
7-29 Nights
2 listings
1.9% of total
30+ Nights
40 listings
37.4% of total
Key Insights
- The most prevalent minimum stay requirement in Hurghada 2 is 30+ Nights, adopted by 37.4% of listings. This highlights the market's preference for longer commitments.
- A significant segment (37.4%) caters to monthly stays (30+ nights) in Hurghada 2, pointing to opportunities in the extended-stay market.
Recommendations
- Align with the market by considering a 30+ Nights minimum stay, as 37.4% of Hurghada 2 hosts use this setting.
- If feasible, allowing 1-night stays, especially midweek or during low season, could capture last-minute bookings, as only 14% currently do.
- Explore offering discounts for stays of 30+ nights to attract the 37.4% of the market seeking extended stays.
- Adjust minimum nights based on seasonality – potentially shorter during low season and longer during peak demand periods in Hurghada 2.
Hurghada 2 Airbnb Cancellation Policy Trends Analysis (2026)
Super Strict 30 Days
8 listings
7.5% of total
Limited
1 listings
0.9% of total
Super Strict 60 Days
1 listings
0.9% of total
Flexible
26 listings
24.3% of total
Moderate
24 listings
22.4% of total
Firm
39 listings
36.4% of total
Strict
8 listings
7.5% of total
Cancellation Policy Insights for Hurghada 2
- The prevailing Airbnb cancellation policy trend in Hurghada 2 is Firm, used by 36.4% of listings.
- There's a relatively balanced mix between guest-friendly (46.7%) and stricter (43.9%) policies, offering choices for different guest needs.
- Strict cancellation policies are quite rare (7.5%), potentially making listings with this policy less competitive unless justified by high demand or property type.
Recommendations for Hosts
- Consider adopting a Firm policy to align with the 36.4% market standard in Hurghada 2.
- Using a Strict policy might deter some guests, as only 7.5% of listings use it. Evaluate if potential revenue protection outweighs possible lower booking rates.
- Regularly review your cancellation policy against competitors and market demand shifts in Hurghada 2.
Hurghada 2 STR Booking Lead Time Analysis (2026)
Average Booking Lead Time by Month
Booking Lead Time Insights for Hurghada 2
- The overall average booking lead time for vacation rentals in Hurghada 2 is 20 days.
- Guests book furthest in advance for stays during March (average 38 days), likely coinciding with peak travel demand or local events.
- The shortest booking windows occur for stays in May (average 2 days), indicating more last-minute travel plans during this time.
- Seasonally, Fall (26 days avg.) sees the longest lead times, while Summer (14 days avg.) has the shortest, reflecting typical travel planning cycles.
Recommendations for Hosts
- Use the overall average lead time (20 days) as a baseline for your pricing and availability strategy in Hurghada 2.
- For March stays, consider implementing length-of-stay discounts or slightly higher rates for bookings made less than 38 days out to capitalize on advance planning.
- During May, focus on last-minute booking availability and promotions, as guests book with very short notice (2 days avg.).
- Target marketing efforts for the Fall season well in advance (at least 26 days) to capture early planners.
- Monitor your own booking lead times against these Hurghada 2 averages to identify opportunities for dynamic pricing adjustments.
Popular & Essential Airbnb Amenities in Hurghada 2 (2026)
Amenity Prevalence
Amenity Insights for Hurghada 2
- Essential amenities in Hurghada 2 that guests expect include: Air conditioning, Kitchen, TV. Lacking these (any) could significantly impact bookings.
- Popular amenities like Free parking on premises, Wifi, Washer are common but not universal. Offering these can provide a competitive edge.
- A pool is a highly desired but not standard amenity, making it a key feature for attracting guests seeking leisure in Hurghada 2.
- Warning: Wifi is not universally provided but is considered essential globally. Ensure reliable Wifi is offered.
Recommendations for Hosts
- Ensure your listing includes all essential amenities for Hurghada 2: Air conditioning, Kitchen, TV.
- Prioritize adding missing essentials: Air conditioning, Kitchen, TV.
- Consider adding popular differentiators like Free parking on premises or Wifi to increase appeal.
- Highlight unique or less common amenities you offer (e.g., hot tub, dedicated workspace, EV charger) in your listing description and photos.
- Regularly check competitor amenities in Hurghada 2 to stay competitive.
Hurghada 2 Airbnb Guest Demographics & Profile Analysis (2026)
Guest Profile Summary for Hurghada 2
- The typical guest profile for Airbnb in Hurghada 2 consists of a mix of domestic (41%) and international guests, with top international origins including Germany, typically belonging to the Post-2000s (Gen Z/Alpha) group (50%), primarily speaking English or Arabic.
- Domestic travelers account for 41.0% of guests.
- Key international markets include Egypt (41%) and Germany (10.7%).
- Top languages spoken are English (40.5%) followed by Arabic (24.7%).
- A significant demographic segment is the Post-2000s (Gen Z/Alpha) group, representing 50% of guests.
Recommendations for Hosts
- Balance marketing efforts between domestic and international channels based on the guest mix.
- Tailor amenities and listing descriptions to appeal to the dominant Post-2000s (Gen Z/Alpha) demographic (e.g., highlight fast WiFi, smart home features, local guides).
- Highlight unique local experiences or amenities relevant to the primary guest profile.
- Consider seasonal promotions aligned with peak travel times for key origin markets.
Nearby Short-Term Rental Market Comparison
How does the Hurghada 2 Airbnb market stack up against its neighbors? Compare key performance metrics like average monthly revenue, ADR, and occupancy rates in surrounding areas to understand the broader regional STR landscape.
| Market | Active Properties | Monthly Revenue | Daily Rate | Avg. Occupancy |
|---|---|---|---|---|
| El Gouna | 15 | $2,195 | $224.55 | 47% |
| Gamsha | 1,138 | $1,209 | $144.47 | 35% |
| Ras Abu Soma | 54 | $884 | $160.33 | 30% |
| Sharm Ash Sheikh | 261 | $628 | $82.14 | 37% |
| Safaga | 48 | $545 | $92.33 | 32% |
| Sharm Al Shiekh | 15 | $545 | $72.35 | 41% |
| الغردقة | 21 | $506 | $67.93 | 34% |
| Sharm El Sheikh | 78 | $431 | $70.75 | 37% |
| Touristic Villages | 22 | $419 | $45.29 | 40% |
| Hurghada | 692 | $380 | $58.85 | 35% |