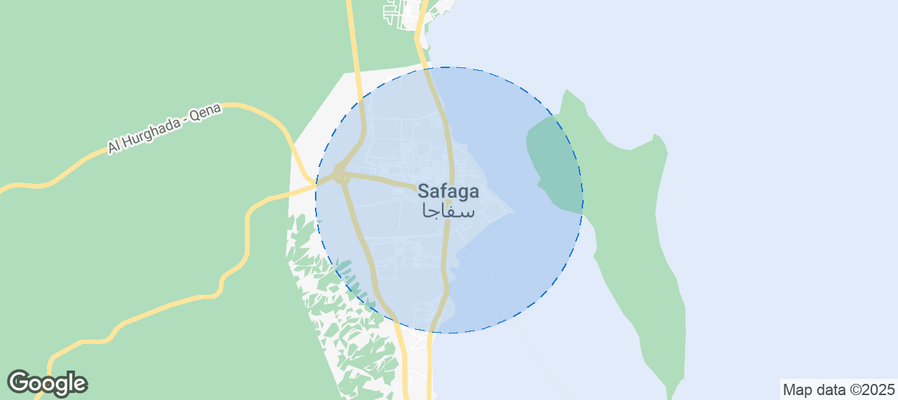
Safaga Airbnb Market Analysis 2026: Short Term Rental Data & Vacation Rental Statistics in Red Sea Governorate, Egypt
Is Airbnb profitable in Safaga in 2026? Explore comprehensive Airbnb analytics for Safaga, Red Sea Governorate, Egypt to uncover income potential. This 2026 STR market report for Safaga, based on AirROI data from February 2025 to January 2026, reveals key trends in the niche market of 48 active listings.
Whether you're considering an Airbnb investment in Safaga, optimizing your existing vacation rental, or exploring rental arbitrage opportunities, understanding the Safaga Airbnb data is crucial. Leveraging the low regulation environment is key to maximizing your short term rental income potential. Let's dive into the specifics.
Key Safaga Airbnb Performance Metrics Overview
Monthly Airbnb Revenue Variations & Income Potential in Safaga (2026)
Understanding the monthly revenue variations for Airbnb listings in Safaga is key to maximizing your short term rental income potential. Seasonality significantly impacts earnings. Our analysis, based on data from the past 12 months, shows that the peak revenue month for STRs in Safaga is typically December, while February often presents the lowest earnings, highlighting opportunities for strategic pricing adjustments during shoulder and low seasons. Explore the typical Airbnb income in Safaga across different performance tiers:
- Best-in-class properties (Top 10%) achieve $2,435+ monthly, often utilizing dynamic pricing and superior guest experiences.
- Strong performing properties (Top 25%) earn $1,656 or more, indicating effective management and desirable locations/amenities.
- Typical properties (Median) generate around $828 per month, representing the average market performance.
- Entry-level properties (Bottom 25%) see earnings around $325, often with potential for optimization.
Average Monthly Airbnb Earnings Trend in Safaga
Safaga Airbnb Occupancy Rate Trends (2026)
Maximize your bookings by understanding the Safaga STR occupancy trends. Seasonal demand shifts significantly influence how often properties are booked. Typically, Novembersees the highest demand (peak season occupancy), while May experiences the lowest (low season). Effective strategies, like adjusting minimum stays or offering promotions, can boost occupancy during slower periods. Here's how different property tiers perform in Safaga:
- Best-in-class properties (Top 10%) achieve 72%+ occupancy, indicating high desirability and potentially optimized availability.
- Strong performing properties (Top 25%) maintain 54% or higher occupancy, suggesting good market fit and guest satisfaction.
- Typical properties (Median) have an occupancy rate around 32%.
- Entry-level properties (Bottom 25%) average 16% occupancy, potentially facing higher vacancy.
Average Monthly Occupancy Rate Trend in Safaga
Average Daily Rate (ADR) Airbnb Trends in Safaga (2026)
Effective short term rental pricing strategy in Safaga involves understanding monthly ADR fluctuations. The Average Daily Rate (ADR) for Airbnb in Safaga typically peaks in December and dips lowest during February. Leveraging Airbnb dynamic pricing tools or strategies based on this seasonality can significantly boost revenue. Here's a look at the typical nightly rates achieved:
- Best-in-class properties (Top 10%) command rates of $181+ per night, often due to premium features or locations.
- Strong performing properties (Top 25%) achieve nightly rates of $124 or more.
- Typical properties (Median) charge around $68 per night.
- Entry-level properties (Bottom 25%) earn around $33 per night.
Average Daily Rate (ADR) Trend by Month in Safaga
Get Live Safaga Market Intelligence 👇
Explore Real-time Analytics
Airbnb Seasonality Analysis & Trends in Safaga (2026)
Peak Season (December, September, October)
- Revenue averages $1,398 per month
- Occupancy rates average 40.8%
- Daily rates average $102
Shoulder Season
- Revenue averages $1,134 per month
- Occupancy maintains around 36.4%
- Daily rates hold near $90
Low Season (February, March, May)
- Revenue drops to average $720 per month
- Occupancy decreases to average 32.7%
- Daily rates adjust to average $84
Seasonality Insights for Safaga
- The Airbnb seasonality in Safaga shows highly seasonal trends requiring careful strategy. While the sections above show seasonal averages, it's also insightful to look at the extremes:
- During the high season, the absolute peak month showcases Safaga's highest earning potential, with monthly revenues capable of climbing to $1,418, occupancy reaching a high of 51.2%, and ADRs peaking at $107.
- Conversely, the slowest single month of the year, typically falling within the low season, marks the market's lowest point. In this month, revenue might dip to $541, occupancy could drop to 25.1%, and ADRs may adjust down to $82.
- Understanding both the seasonal averages and these monthly peaks and troughs in revenue, occupancy, and ADR is crucial for maximizing your Airbnb profit potential in Safaga.
Seasonal Strategies for Maximizing Profit
- Peak Season: Maximize revenue through premium pricing and potentially longer minimum stays. Ensure high availability.
- Low Season: Offer competitive pricing, special promotions (e.g., extended stay discounts), and flexible cancellation policies. Target off-season travelers like remote workers or budget-conscious guests.
- Shoulder Seasons: Implement dynamic pricing that balances peak and low rates. Target weekend travelers or specific events. Offer slightly more flexible terms than peak season.
- Regularly analyze your own performance against these Safaga seasonality benchmarks and adjust your pricing and availability strategy accordingly.
Best Areas for Airbnb Investment in Safaga (2026)
Exploring the top neighborhoods for short-term rentals in Safaga? This section highlights key areas, outlining why they are attractive for hosts and guests, along with notable local attractions. Consider these locations based on your target guest profile and investment strategy.
| Neighborhood / Area | Why Host Here? (Target Guests & Appeal) | Key Attractions & Landmarks |
|---|---|---|
| Safaga North Beach | A beautiful stretch of sandy beach attracting tourists for relaxation and water sports. Ideal for guests looking for a beachfront experience close to amenities. | North Beach, Safaga Marina, Diving and snorkeling spots, Local restaurants, Water sports activities |
| Safaga Town Center | The heart of Safaga with local markets, shops, and restaurants. Great for travelers wanting to experience local culture and cuisine. | Local markets, Traditional Egyptian restaurants, Cultural sites, Craft shops |
| Megawish Beach | Known for its clear waters and vibrant coral reefs, this area is perfect for divers and beach lovers. Offers a laid-back atmosphere with several accommodation options. | Megawish Beach, Diving and snorkeling, Water sports rentals, Lounge bars |
| Hurghada-Safaga Road | A bustling area with numerous hotels and resorts, ideal for easy access between Safaga and Hurghada’s attractions and nightlife. | Resort hotels, Beach clubs, Access to Hurghada's nightlife |
| Al-Quseir | A nearby coastal town with historical significance and beautiful beaches, offering a quieter alternative for guests looking to escape the crowds. | Al-Quseir Fort, Diving spots, Relaxed beach atmosphere |
| Tuna Bay | A charming bay area known for its scenic views and tranquility. A good spot for family vacations and those wishing to unwind. | Tuna Bay, Family-friendly beaches, Natural scenery |
| Diving Centers | Home to various diving centers catering to divers of all levels, making it attractive for adventure seekers. | Diving courses, Guided diving trips, Marine life exploration |
| Local Cultural Sites | An area that showcases Egyptian culture and history, appealing to guests interested in heritage tourism. | Ancient ruins, Cultural performances, Local art exhibitions |
Understanding Airbnb License Requirements & STR Laws in Safaga (2026)
While Safaga, Red Sea Governorate, Egypt currently shows low STR regulations, specific Airbnb license requirements might still exist or change. Always verify the latest short term rental regulations and Airbnb license requirements directly with local government authorities for Safaga to ensure full compliance before hosting.
(Source: AirROI data, 2026, finding no licensed listings among those analyzed)
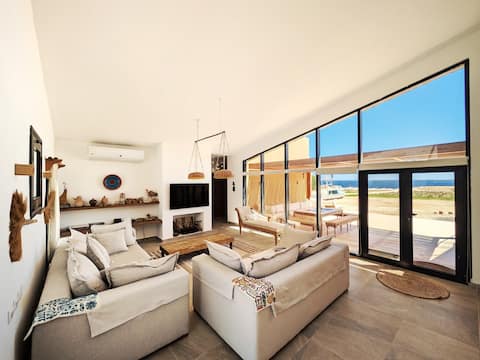
Top Performing Airbnb Properties in Safaga (2026)
Benchmark your potential! Explore examples of top-performing Airbnb properties in Safagabased on Trailing Twelve Month (TTM) revenue. Analyze their characteristics, revenue, occupancy rate, and ADR to understand what drives success in this market.

2 BR Cozy Beach View loft in Mesca Somabay
Entire Place • 2 bedrooms
Sea front 3BR Soma Bay Villa With Exquisite Views
Entire Place • 3 bedrooms
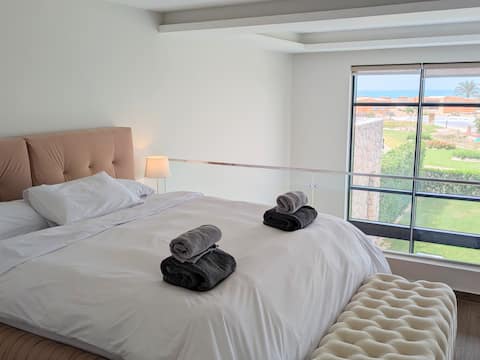
Beachfront 1BR Spacious Somabay Loft w Beach, Pool
Entire Place • 1 bedroom

Somabay Seaview 1BR Loft 2 Mins to Beach & Pool
Entire Place • 1 bedroom

Mesca Beach Cabin, Somabay
Entire Place • 1 bedroom

Front Row Soma bay Cabana Near Sandy Beach & Pool
Entire Place • 1 bedroom
Note: Performance varies based on location, size, amenities, seasonality, and management quality. Data reflects the past 12 months.
Top Performing Airbnb Hosts in Safaga (2026)
Learn from the best! This table showcases top-performing Airbnb hosts in Safaga based on the number of properties managed and estimated total revenue over the past year. Analyze their scale and performance metrics.
| Host Name | Properties | Grossing Revenue | Stay Reviews | Avg Rating |
|---|---|---|---|---|
| Seascape Stays | 10 | $150,878 | 156 | 4.92/5.0 |
| Nour | 1 | $32,451 | 24 | 4.88/5.0 |
| Ahmed | 4 | $17,714 | 123 | 4.80/5.0 |
| Seifeldin | 1 | $17,331 | 7 | 4.86/5.0 |
| Vesta | 1 | $16,894 | 8 | 4.75/5.0 |
| Eric | 1 | $16,085 | 11 | 5.00/5.0 |
| Stayr Somabay | 5 | $13,491 | 6 | Not Rated |
| Mostafa | 1 | $11,870 | 6 | 5.00/5.0 |
| Ahmed | 1 | $6,833 | 1 | Not Rated |
| Alaa | 1 | $5,866 | 1 | Not Rated |
Analyzing the strategies of top hosts, such as their property selection, pricing, and guest communication, can offer valuable lessons for optimizing your own Airbnb operations in Safaga.
Dive Deeper: Advanced Safaga STR Market Data (2026)
Ready to unlock more insights? AirROI provides access to advanced metrics and comprehensive Airbnb data for Safaga. Explore detailed analytics beyond this report to refine your investment strategy, optimize pricing, and maximize your vacation rental profits.
Explore Advanced MetricsSafaga Short-Term Rental Market Composition (2026): Property & Room Types
Room Type Distribution
Property Type Distribution
Market Composition Insights for Safaga
- The Safaga Airbnb market composition is heavily skewed towards Entire Home/Apt listings, which make up 97.9% of the 48 active rentals. This indicates strong guest preference for privacy and space.
- Looking at the property type distribution in Safaga, House properties are the most common (41.7%), reflecting the local real estate landscape.
- Houses represent a significant 41.7% portion, catering likely to families or larger groups.
- Smaller segments like hotel/boutique, unique stays (combined 4.2%) offer potential for unique stay experiences.
Safaga Airbnb Room Capacity Analysis (2026): Bedroom Distribution
Distribution of Listings by Number of Bedrooms
Room Capacity Insights for Safaga
- The dominant room capacity in Safaga is 1 bedroom listings, making up 47.9% of the market. This suggests a strong demand for properties suitable for couples or solo travelers.
- Together, 1 bedroom and 2 bedrooms properties represent 79.2% of the active Airbnb listings in Safaga, indicating a high concentration in these sizes.
Safaga Vacation Rental Guest Capacity Trends (2026)
Distribution of Listings by Guest Capacity
Guest Capacity Insights for Safaga
- The most common guest capacity trend in Safaga vacation rentals is listings accommodating 2 guests (35.4%). This suggests the primary traveler segment is likely couples or solo travelers.
- Properties designed for 2 guests and 4 guests dominate the Safaga STR market, accounting for 62.5% of listings.
- 12.6% of properties accommodate 6+ guests, serving the market segment for larger families or group travel in Safaga.
- On average, properties in Safaga are equipped to host 3.5 guests.
Safaga Airbnb Booking Patterns (2026): Available vs. Booked Days
Available Days Distribution
Booked Days Distribution
Booking Pattern Insights for Safaga
- The most common availability pattern in Safaga falls within the 271-366 days range, representing 70.8% of listings. This suggests many properties have significant open periods on their calendars.
- Approximately 91.6% of listings show high availability (181+ days open annually), indicating potential for increased bookings or specific owner usage patterns.
- For booked days, the 1-30 days range is most frequent in Safaga (43.8%), reflecting common guest stay durations or potential owner blocking patterns.
- A notable 8.3% of properties secure long booking periods (181+ days booked per year), highlighting successful long-term rental strategies or significant owner usage.
Safaga Airbnb Minimum Stay Requirements Analysis
Distribution of Listings by Minimum Night Requirement
1 Night
20 listings
41.7% of total
2 Nights
6 listings
12.5% of total
3 Nights
2 listings
4.2% of total
4-6 Nights
2 listings
4.2% of total
7-29 Nights
1 listings
2.1% of total
30+ Nights
17 listings
35.4% of total
Key Insights
- The most prevalent minimum stay requirement in Safaga is 1 Night, adopted by 41.7% of listings. This highlights the market's preference for shorter, flexible bookings.
- A significant segment (35.4%) caters to monthly stays (30+ nights) in Safaga, pointing to opportunities in the extended-stay market.
Recommendations
- Align with the market by considering a 1 Night minimum stay, as 41.7% of Safaga hosts use this setting.
- Explore offering discounts for stays of 30+ nights to attract the 35.4% of the market seeking extended stays.
- Adjust minimum nights based on seasonality – potentially shorter during low season and longer during peak demand periods in Safaga.
Safaga Airbnb Cancellation Policy Trends Analysis (2026)
Flexible
17 listings
35.4% of total
Moderate
22 listings
45.8% of total
Firm
7 listings
14.6% of total
Strict
2 listings
4.2% of total
Cancellation Policy Insights for Safaga
- The prevailing Airbnb cancellation policy trend in Safaga is Moderate, used by 45.8% of listings.
- The market strongly favors guest-friendly terms, with 81.2% of listings offering Flexible or Moderate policies. This suggests guests in Safaga may expect booking flexibility.
- Strict cancellation policies are quite rare (4.2%), potentially making listings with this policy less competitive unless justified by high demand or property type.
Recommendations for Hosts
- Consider adopting a Moderate policy to align with the 45.8% market standard in Safaga.
- Using a Strict policy might deter some guests, as only 4.2% of listings use it. Evaluate if potential revenue protection outweighs possible lower booking rates.
- Regularly review your cancellation policy against competitors and market demand shifts in Safaga.
Safaga STR Booking Lead Time Analysis (2026)
Average Booking Lead Time by Month
Booking Lead Time Insights for Safaga
- The overall average booking lead time for vacation rentals in Safaga is 30 days.
- Guests book furthest in advance for stays during October (average 39 days), likely coinciding with peak travel demand or local events.
- The shortest booking windows occur for stays in June (average 9 days), indicating more last-minute travel plans during this time.
- Seasonally, Spring (32 days avg.) sees the longest lead times, while Summer (21 days avg.) has the shortest, reflecting typical travel planning cycles.
Recommendations for Hosts
- Use the overall average lead time (30 days) as a baseline for your pricing and availability strategy in Safaga.
- During June, focus on last-minute booking availability and promotions, as guests book with very short notice (9 days avg.).
- Target marketing efforts for the Spring season well in advance (at least 32 days) to capture early planners.
- Monitor your own booking lead times against these Safaga averages to identify opportunities for dynamic pricing adjustments.
Popular & Essential Airbnb Amenities in Safaga (2026)
Amenity Prevalence
Amenity Insights for Safaga
- Essential amenities in Safaga that guests expect include: Kitchen, TV, Air conditioning, Free parking on premises. Lacking these (any) could significantly impact bookings.
- Popular amenities like Wifi, Washer, Beach access are common but not universal. Offering these can provide a competitive edge.
- Warning: Wifi is not universally provided but is considered essential globally. Ensure reliable Wifi is offered.
Recommendations for Hosts
- Ensure your listing includes all essential amenities for Safaga: Kitchen, TV, Air conditioning, Free parking on premises.
- Prioritize adding missing essentials: Air conditioning, Free parking on premises.
- Consider adding popular differentiators like Wifi or Washer to increase appeal.
- Highlight unique or less common amenities you offer (e.g., hot tub, dedicated workspace, EV charger) in your listing description and photos.
- Regularly check competitor amenities in Safaga to stay competitive.
Safaga Airbnb Guest Demographics & Profile Analysis (2026)
Guest Profile Summary for Safaga
- The typical guest profile for Airbnb in Safaga consists of predominantly international visitors (68%), with top international origins including Germany, typically belonging to the Post-2000s (Gen Z/Alpha) group (50%), primarily speaking English or Arabic.
- Domestic travelers account for 31.7% of guests.
- Key international markets include Egypt (31.7%) and Germany (14.2%).
- Top languages spoken are English (43.6%) followed by Arabic (16.1%).
- A significant demographic segment is the Post-2000s (Gen Z/Alpha) group, representing 50% of guests.
Recommendations for Hosts
- Focus marketing internationally, particularly towards travelers from Germany.
- Tailor amenities and listing descriptions to appeal to the dominant Post-2000s (Gen Z/Alpha) demographic (e.g., highlight fast WiFi, smart home features, local guides).
- Highlight unique local experiences or amenities relevant to the primary guest profile.
- Consider seasonal promotions aligned with peak travel times for key origin markets.
Nearby Short-Term Rental Market Comparison
How does the Safaga Airbnb market stack up against its neighbors? Compare key performance metrics like average monthly revenue, ADR, and occupancy rates in surrounding areas to understand the broader regional STR landscape.
| Market | Active Properties | Monthly Revenue | Daily Rate | Avg. Occupancy |
|---|---|---|---|---|
| El Gouna | 15 | $2,195 | $224.55 | 47% |
| Gamsha | 1,138 | $1,209 | $144.47 | 35% |
| Ras Abu Soma | 54 | $884 | $160.33 | 30% |
| Hurghada 2 | 107 | $841 | $148.22 | 32% |
| Sharm Ash Sheikh | 261 | $628 | $82.14 | 37% |
| Sharm Al Shiekh | 15 | $545 | $72.35 | 41% |
| الغردقة | 21 | $506 | $67.93 | 34% |
| Sharm El Sheikh | 78 | $431 | $70.75 | 37% |
| Touristic Villages | 22 | $419 | $45.29 | 40% |
| Al Baairat Village | 259 | $392 | $48.27 | 32% |