Hämeenlinna Airbnb Market Analysis 2026: Short Term Rental Data & Vacation Rental Statistics in Mainland Finland, Finland
Is Airbnb profitable in Hämeenlinna in 2026? Explore comprehensive Airbnb analytics for Hämeenlinna, Mainland Finland, Finland to uncover income potential. This 2026 STR market report for Hämeenlinna, based on AirROI data from February 2025 to January 2026, reveals key trends in the niche market of 120 active listings.
Whether you're considering an Airbnb investment in Hämeenlinna, optimizing your existing vacation rental, or exploring rental arbitrage opportunities, understanding the Hämeenlinna Airbnb data is crucial. Leveraging the low regulation environment is key to maximizing your short term rental income potential. Let's dive into the specifics.
Key Hämeenlinna Airbnb Performance Metrics Overview
Monthly Airbnb Revenue Variations & Income Potential in Hämeenlinna (2026)
Understanding the monthly revenue variations for Airbnb listings in Hämeenlinna is key to maximizing your short term rental income potential. Seasonality significantly impacts earnings. Our analysis, based on data from the past 12 months, shows that the peak revenue month for STRs in Hämeenlinna is typically July, while January often presents the lowest earnings, highlighting opportunities for strategic pricing adjustments during shoulder and low seasons. Explore the typical Airbnb income in Hämeenlinna across different performance tiers:
- Best-in-class properties (Top 10%) achieve $3,534+ monthly, often utilizing dynamic pricing and superior guest experiences.
- Strong performing properties (Top 25%) earn $2,086 or more, indicating effective management and desirable locations/amenities.
- Typical properties (Median) generate around $1,348 per month, representing the average market performance.
- Entry-level properties (Bottom 25%) see earnings around $737, often with potential for optimization.
Average Monthly Airbnb Earnings Trend in Hämeenlinna
Hämeenlinna Airbnb Occupancy Rate Trends (2026)
Maximize your bookings by understanding the Hämeenlinna STR occupancy trends. Seasonal demand shifts significantly influence how often properties are booked. Typically, Augustsees the highest demand (peak season occupancy), while January experiences the lowest (low season). Effective strategies, like adjusting minimum stays or offering promotions, can boost occupancy during slower periods. Here's how different property tiers perform in Hämeenlinna:
- Best-in-class properties (Top 10%) achieve 81%+ occupancy, indicating high desirability and potentially optimized availability.
- Strong performing properties (Top 25%) maintain 63% or higher occupancy, suggesting good market fit and guest satisfaction.
- Typical properties (Median) have an occupancy rate around 40%.
- Entry-level properties (Bottom 25%) average 21% occupancy, potentially facing higher vacancy.
Average Monthly Occupancy Rate Trend in Hämeenlinna
Average Daily Rate (ADR) Airbnb Trends in Hämeenlinna (2026)
Effective short term rental pricing strategy in Hämeenlinna involves understanding monthly ADR fluctuations. The Average Daily Rate (ADR) for Airbnb in Hämeenlinna typically peaks in September and dips lowest during February. Leveraging Airbnb dynamic pricing tools or strategies based on this seasonality can significantly boost revenue. Here's a look at the typical nightly rates achieved:
- Best-in-class properties (Top 10%) command rates of $301+ per night, often due to premium features or locations.
- Strong performing properties (Top 25%) achieve nightly rates of $157 or more.
- Typical properties (Median) charge around $95 per night.
- Entry-level properties (Bottom 25%) earn around $74 per night.
Average Daily Rate (ADR) Trend by Month in Hämeenlinna
Get Live Hämeenlinna Market Intelligence 👇

Explore Real-time Analytics
Airbnb Seasonality Analysis & Trends in Hämeenlinna (2026)
Peak Season (July, August, June)
- Revenue averages $2,277 per month
- Occupancy rates average 50.5%
- Daily rates average $149
Shoulder Season
- Revenue averages $1,698 per month
- Occupancy maintains around 42.8%
- Daily rates hold near $153
Low Season (January, February, April)
- Revenue drops to average $1,232 per month
- Occupancy decreases to average 36.9%
- Daily rates adjust to average $143
Seasonality Insights for Hämeenlinna
- The Airbnb seasonality in Hämeenlinna shows highly seasonal trends requiring careful strategy. While the sections above show seasonal averages, it's also insightful to look at the extremes:
- During the high season, the absolute peak month showcases Hämeenlinna's highest earning potential, with monthly revenues capable of climbing to $2,379, occupancy reaching a high of 52.3%, and ADRs peaking at $164.
- Conversely, the slowest single month of the year, typically falling within the low season, marks the market's lowest point. In this month, revenue might dip to $1,051, occupancy could drop to 26.0%, and ADRs may adjust down to $133.
- Understanding both the seasonal averages and these monthly peaks and troughs in revenue, occupancy, and ADR is crucial for maximizing your Airbnb profit potential in Hämeenlinna.
Seasonal Strategies for Maximizing Profit
- Peak Season: Maximize revenue through premium pricing and potentially longer minimum stays. Ensure high availability.
- Low Season: Offer competitive pricing, special promotions (e.g., extended stay discounts), and flexible cancellation policies. Target off-season travelers like remote workers or budget-conscious guests.
- Shoulder Seasons: Implement dynamic pricing that balances peak and low rates. Target weekend travelers or specific events. Offer slightly more flexible terms than peak season.
- Regularly analyze your own performance against these Hämeenlinna seasonality benchmarks and adjust your pricing and availability strategy accordingly.
Best Areas for Airbnb Investment in Hämeenlinna (2026)
Exploring the top neighborhoods for short-term rentals in Hämeenlinna? This section highlights key areas, outlining why they are attractive for hosts and guests, along with notable local attractions. Consider these locations based on your target guest profile and investment strategy.
| Neighborhood / Area | Why Host Here? (Target Guests & Appeal) | Key Attractions & Landmarks |
|---|---|---|
| City Center | The vibrant heart of Hämeenlinna, offering historical attractions, shopping, and dining options. A prime area for tourists looking to explore the city's culture and history. | Häme Castle, Sibelius Museum, City Park, Shopping centers, Cafés and restaurants |
| Lake Vanajavesi | A beautiful area known for its scenic views and recreational activities. Ideal for guests seeking nature and outdoor experiences such as swimming, boating, and hiking. | Lake Vanajavesi, Recreation areas, Hiking trails, Beach areas, Water sports |
| Tampere Highway Area | An accessible area for travelers coming from Tampere, often sought after by guests for its convenience and close proximity to urban facilities and nature. | Hämeenlinna Railway Station, Local shops and restaurants, Access to transport links |
| Aulanko | Famous for its national park and beautiful scenery. Attractive for tourists interested in hiking, picnics, and nature. | Aulanko Nature Reserve, Lookout tower, Hiking paths, Aulanko Park |
| Räyskälä | A peaceful rural area that attracts guests looking for quiet retreats and outdoor experiences in the Finnish countryside. | Nature trails, Local farms, Cultural heritage sites |
| Cultural Quarter | A hub for arts, galleries, and cultural events. Ideal for those seeking to experience the local arts scene. | Local art galleries, Theatre, Cultural events |
| Hämeenlinna Marina | This area offers scenic waterfront properties, ideal for guests looking for relaxation by the water. | Marina facilities, Waterfront dining, Walking paths |
| Kanta-Häme Region | A broader area that encompasses diverse landscapes and activities, suited for both nature enthusiasts and urban visitors. | Local attractions, Natural parks, Cultural sites |
Understanding Airbnb License Requirements & STR Laws in Hämeenlinna (2026)
While Hämeenlinna, Mainland Finland, Finland currently shows low STR regulations, specific Airbnb license requirements might still exist or change. Always verify the latest short term rental regulations and Airbnb license requirements directly with local government authorities for Hämeenlinna to ensure full compliance before hosting.
(Source: AirROI data, 2026, finding no licensed listings among those analyzed)
Top Performing Airbnb Properties in Hämeenlinna (2026)
Benchmark your potential! Explore examples of top-performing Airbnb properties in Hämeenlinnabased on Trailing Twelve Month (TTM) revenue. Analyze their characteristics, revenue, occupancy rate, and ADR to understand what drives success in this market.

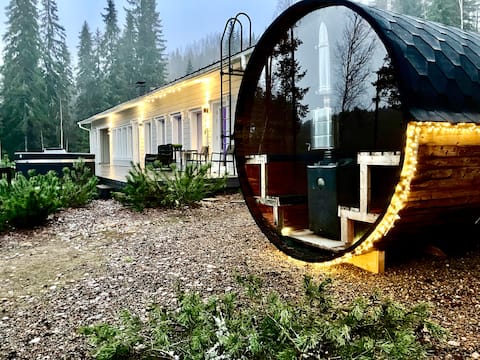
Lapland Mirror House, Outdoor Hot Tub and Reindeer
Entire Place • 1 bedroom

Peace & Privacy – Aulanko Grand Villa
Entire Place • 8 bedrooms

Gorgeous log cabin with outdoor hot tub and reel sauna
Entire Place • 3 bedrooms

Peace & Privacy – Aulanko Lake Villa
Entire Place • 4 bedrooms

Peace & Privacy – Aulanko Lakeside
Entire Place • 4 bedrooms
Villa Renkaranta, 8-10 people + much more
Entire Place • 2 bedrooms
Note: Performance varies based on location, size, amenities, seasonality, and management quality. Data reflects the past 12 months.
Top Performing Airbnb Hosts in Hämeenlinna (2026)
Learn from the best! This table showcases top-performing Airbnb hosts in Hämeenlinna based on the number of properties managed and estimated total revenue over the past year. Analyze their scale and performance metrics.
| Host Name | Properties | Grossing Revenue | Stay Reviews | Avg Rating |
|---|---|---|---|---|
| Kaj | 10 | $308,867 | 75 | 4.79/5.0 |
| Raikku | 2 | $153,561 | 157 | 4.79/5.0 |
| Marjaana | 5 | $72,173 | 592 | 4.73/5.0 |
| Riikka | 3 | $55,219 | 243 | 4.83/5.0 |
| Päivi | 5 | $52,592 | 87 | 4.84/5.0 |
| Anni | 3 | $51,662 | 540 | 4.89/5.0 |
| Teemu | 2 | $48,524 | 142 | 4.78/5.0 |
| Jorma | 2 | $48,087 | 93 | 4.58/5.0 |
| Jenni | 1 | $44,571 | 9 | 4.89/5.0 |
| Matti | 1 | $43,090 | 39 | 4.87/5.0 |
Analyzing the strategies of top hosts, such as their property selection, pricing, and guest communication, can offer valuable lessons for optimizing your own Airbnb operations in Hämeenlinna.
Dive Deeper: Advanced Hämeenlinna STR Market Data (2026)
Ready to unlock more insights? AirROI provides access to advanced metrics and comprehensive Airbnb data for Hämeenlinna. Explore detailed analytics beyond this report to refine your investment strategy, optimize pricing, and maximize your vacation rental profits.
Explore Advanced MetricsHämeenlinna Short-Term Rental Market Composition (2026): Property & Room Types
Room Type Distribution
Property Type Distribution
Market Composition Insights for Hämeenlinna
- The Hämeenlinna Airbnb market composition is heavily skewed towards Entire Home/Apt listings, which make up 85.8% of the 120 active rentals. This indicates strong guest preference for privacy and space.
- Looking at the property type distribution in Hämeenlinna, Apartment/Condo properties are the most common (41.7%), reflecting the local real estate landscape.
- Houses represent a significant 32.5% portion, catering likely to families or larger groups.
- The presence of 5.8% Hotel/Boutique listings indicates integration with traditional hospitality.
- Smaller segments like others (combined 2.5%) offer potential for unique stay experiences.
Hämeenlinna Airbnb Room Capacity Analysis (2026): Bedroom Distribution
Distribution of Listings by Number of Bedrooms
Room Capacity Insights for Hämeenlinna
- The dominant room capacity in Hämeenlinna is 1 bedroom listings, making up 44.2% of the market. This suggests a strong demand for properties suitable for couples or solo travelers.
- Together, 1 bedroom and 2 bedrooms properties represent 63.4% of the active Airbnb listings in Hämeenlinna, indicating a high concentration in these sizes.
- A significant 20.8% of listings offer 3+ bedrooms, catering to larger groups and families seeking more space in Hämeenlinna.
Hämeenlinna Vacation Rental Guest Capacity Trends (2026)
Distribution of Listings by Guest Capacity
Guest Capacity Insights for Hämeenlinna
- The most common guest capacity trend in Hämeenlinna vacation rentals is listings accommodating 8+ guests (18.3%). This suggests the primary traveler segment is likely larger groups.
- Properties designed for 8+ guests and 2 guests dominate the Hämeenlinna STR market, accounting for 36.6% of listings.
- 28.3% of properties accommodate 6+ guests, serving the market segment for larger families or group travel in Hämeenlinna.
- On average, properties in Hämeenlinna are equipped to host 4.0 guests.
Hämeenlinna Airbnb Booking Patterns (2026): Available vs. Booked Days
Available Days Distribution
Booked Days Distribution
Booking Pattern Insights for Hämeenlinna
- The most common availability pattern in Hämeenlinna falls within the 271-366 days range, representing 39.2% of listings. This suggests many properties have significant open periods on their calendars.
- Approximately 73.4% of listings show high availability (181+ days open annually), indicating potential for increased bookings or specific owner usage patterns.
- For booked days, the 91-180 days range is most frequent in Hämeenlinna (34.2%), reflecting common guest stay durations or potential owner blocking patterns.
- A notable 29.2% of properties secure long booking periods (181+ days booked per year), highlighting successful long-term rental strategies or significant owner usage.
Hämeenlinna Airbnb Minimum Stay Requirements Analysis
Distribution of Listings by Minimum Night Requirement
1 Night
61 listings
50.8% of total
2 Nights
20 listings
16.7% of total
3 Nights
2 listings
1.7% of total
4-6 Nights
3 listings
2.5% of total
30+ Nights
34 listings
28.3% of total
Key Insights
- The most prevalent minimum stay requirement in Hämeenlinna is 1 Night, adopted by 50.8% of listings. This highlights the market's preference for shorter, flexible bookings.
- A strong majority (67.5%) of the Hämeenlinna Airbnb data shows acceptance of very short stays (1-2 nights), indicating a dynamic, high-turnover market.
- A significant segment (28.3%) caters to monthly stays (30+ nights) in Hämeenlinna, pointing to opportunities in the extended-stay market.
Recommendations
- Align with the market by considering a 1 Night minimum stay, as 50.8% of Hämeenlinna hosts use this setting.
- Explore offering discounts for stays of 30+ nights to attract the 28.3% of the market seeking extended stays.
- Adjust minimum nights based on seasonality – potentially shorter during low season and longer during peak demand periods in Hämeenlinna.
Hämeenlinna Airbnb Cancellation Policy Trends Analysis (2026)
Limited
1 listings
0.8% of total
Flexible
54 listings
45% of total
Moderate
35 listings
29.2% of total
Firm
13 listings
10.8% of total
Strict
17 listings
14.2% of total
Cancellation Policy Insights for Hämeenlinna
- The prevailing Airbnb cancellation policy trend in Hämeenlinna is Flexible, used by 45% of listings.
- The market strongly favors guest-friendly terms, with 74.2% of listings offering Flexible or Moderate policies. This suggests guests in Hämeenlinna may expect booking flexibility.
Recommendations for Hosts
- Consider adopting a Flexible policy to align with the 45% market standard in Hämeenlinna.
- Using a Strict policy might deter some guests, as only 14.2% of listings use it. Evaluate if potential revenue protection outweighs possible lower booking rates.
- Regularly review your cancellation policy against competitors and market demand shifts in Hämeenlinna.
Hämeenlinna STR Booking Lead Time Analysis (2026)
Average Booking Lead Time by Month
Booking Lead Time Insights for Hämeenlinna
- The overall average booking lead time for vacation rentals in Hämeenlinna is 51 days.
- Guests book furthest in advance for stays during July (average 68 days), likely coinciding with peak travel demand or local events.
- The shortest booking windows occur for stays in February (average 25 days), indicating more last-minute travel plans during this time.
- Seasonally, Summer (66 days avg.) sees the longest lead times, while Fall (35 days avg.) has the shortest, reflecting typical travel planning cycles.
Recommendations for Hosts
- Use the overall average lead time (51 days) as a baseline for your pricing and availability strategy in Hämeenlinna.
- For July stays, consider implementing length-of-stay discounts or slightly higher rates for bookings made less than 68 days out to capitalize on advance planning.
- Target marketing efforts for the Summer season well in advance (at least 66 days) to capture early planners.
- Monitor your own booking lead times against these Hämeenlinna averages to identify opportunities for dynamic pricing adjustments.
Popular & Essential Airbnb Amenities in Hämeenlinna (2026)
Amenity Prevalence
Amenity Insights for Hämeenlinna
- Essential amenities in Hämeenlinna that guests expect include: Smoke alarm. Lacking these (this) could significantly impact bookings.
- Popular amenities like Heating, Dishes and silverware, Kitchen are common but not universal. Offering these can provide a competitive edge.
Recommendations for Hosts
- Ensure your listing includes all essential amenities for Hämeenlinna: Smoke alarm.
- Prioritize adding missing essentials: Smoke alarm.
- Consider adding popular differentiators like Heating or Dishes and silverware to increase appeal.
- Highlight unique or less common amenities you offer (e.g., hot tub, dedicated workspace, EV charger) in your listing description and photos.
- Regularly check competitor amenities in Hämeenlinna to stay competitive.
Hämeenlinna Airbnb Guest Demographics & Profile Analysis (2026)
Guest Profile Summary for Hämeenlinna
- The typical guest profile for Airbnb in Hämeenlinna consists of primarily domestic travelers (80%), often arriving from nearby Helsinki, typically belonging to the Post-2000s (Gen Z/Alpha) group (50%), primarily speaking English or Finnish.
- Domestic travelers account for 80.2% of guests.
- Key international markets include Finland (80.2%) and Germany (3.8%).
- Top languages spoken are English (38.5%) followed by Finnish (33.8%).
- A significant demographic segment is the Post-2000s (Gen Z/Alpha) group, representing 50% of guests.
Recommendations for Hosts
- Target domestic marketing efforts towards travelers from Helsinki and Tampere.
- Tailor amenities and listing descriptions to appeal to the dominant Post-2000s (Gen Z/Alpha) demographic (e.g., highlight fast WiFi, smart home features, local guides).
- Highlight unique local experiences or amenities relevant to the primary guest profile.
- Consider seasonal promotions aligned with peak travel times for key origin markets.
Nearby Short-Term Rental Market Comparison
How does the Hämeenlinna Airbnb market stack up against its neighbors? Compare key performance metrics like average monthly revenue, ADR, and occupancy rates in surrounding areas to understand the broader regional STR landscape.
| Market | Active Properties | Monthly Revenue | Daily Rate | Avg. Occupancy |
|---|---|---|---|---|
| Sysmä | 16 | $2,882 | $287.09 | 40% |
| Lempäälä | 18 | $2,559 | $193.94 | 46% |
| Kirkkonummi | 65 | $2,123 | $221.41 | 41% |
| Hattula | 11 | $1,860 | $192.87 | 33% |
| Pirkkala | 28 | $1,858 | $199.04 | 44% |
| Ingå | 30 | $1,821 | $214.59 | 40% |
| Salo | 110 | $1,798 | $197.10 | 36% |
| Sipoo | 29 | $1,734 | $254.67 | 33% |
| Vihti | 32 | $1,732 | $196.45 | 35% |
| Loppi | 24 | $1,717 | $226.22 | 37% |