Kittilä Airbnb Market Analysis 2026: Short Term Rental Data & Vacation Rental Statistics in Mainland Finland, Finland
Is Airbnb profitable in Kittilä in 2026? Explore comprehensive Airbnb analytics for Kittilä, Mainland Finland, Finland to uncover income potential. This 2026 STR market report for Kittilä, based on AirROI data from February 2025 to January 2026, reveals key trends in the market of 481 active listings.
Whether you're considering an Airbnb investment in Kittilä, optimizing your existing vacation rental, or exploring rental arbitrage opportunities, understanding the Kittilä Airbnb data is crucial. Leveraging the low regulation environment is key to maximizing your short term rental income potential. Let's dive into the specifics.
Key Kittilä Airbnb Performance Metrics Overview
Monthly Airbnb Revenue Variations & Income Potential in Kittilä (2026)
Understanding the monthly revenue variations for Airbnb listings in Kittilä is key to maximizing your short term rental income potential. Seasonality significantly impacts earnings. Our analysis, based on data from the past 12 months, shows that the peak revenue month for STRs in Kittilä is typically February, while June often presents the lowest earnings, highlighting opportunities for strategic pricing adjustments during shoulder and low seasons. Explore the typical Airbnb income in Kittilä across different performance tiers:
- Best-in-class properties (Top 10%) achieve $6,546+ monthly, often utilizing dynamic pricing and superior guest experiences.
- Strong performing properties (Top 25%) earn $4,090 or more, indicating effective management and desirable locations/amenities.
- Typical properties (Median) generate around $2,484 per month, representing the average market performance.
- Entry-level properties (Bottom 25%) see earnings around $1,406, often with potential for optimization.
Average Monthly Airbnb Earnings Trend in Kittilä
Kittilä Airbnb Occupancy Rate Trends (2026)
Maximize your bookings by understanding the Kittilä STR occupancy trends. Seasonal demand shifts significantly influence how often properties are booked. Typically, Februarysees the highest demand (peak season occupancy), while August experiences the lowest (low season). Effective strategies, like adjusting minimum stays or offering promotions, can boost occupancy during slower periods. Here's how different property tiers perform in Kittilä:
- Best-in-class properties (Top 10%) achieve 73%+ occupancy, indicating high desirability and potentially optimized availability.
- Strong performing properties (Top 25%) maintain 55% or higher occupancy, suggesting good market fit and guest satisfaction.
- Typical properties (Median) have an occupancy rate around 38%.
- Entry-level properties (Bottom 25%) average 22% occupancy, potentially facing higher vacancy.
Average Monthly Occupancy Rate Trend in Kittilä
Average Daily Rate (ADR) Airbnb Trends in Kittilä (2026)
Effective short term rental pricing strategy in Kittilä involves understanding monthly ADR fluctuations. The Average Daily Rate (ADR) for Airbnb in Kittilä typically peaks in December and dips lowest during July. Leveraging Airbnb dynamic pricing tools or strategies based on this seasonality can significantly boost revenue. Here's a look at the typical nightly rates achieved:
- Best-in-class properties (Top 10%) command rates of $521+ per night, often due to premium features or locations.
- Strong performing properties (Top 25%) achieve nightly rates of $340 or more.
- Typical properties (Median) charge around $221 per night.
- Entry-level properties (Bottom 25%) earn around $149 per night.
Average Daily Rate (ADR) Trend by Month in Kittilä
Get Live Kittilä Market Intelligence 👇

Explore Real-time Analytics
Airbnb Seasonality Analysis & Trends in Kittilä (2026)
Peak Season (February, December, March)
- Revenue averages $6,093 per month
- Occupancy rates average 66.3%
- Daily rates average $329
Shoulder Season
- Revenue averages $2,687 per month
- Occupancy maintains around 34.4%
- Daily rates hold near $294
Low Season (May, June, August)
- Revenue drops to average $1,370 per month
- Occupancy decreases to average 24.3%
- Daily rates adjust to average $238
Seasonality Insights for Kittilä
- The Airbnb seasonality in Kittilä shows highly seasonal trends requiring careful strategy. While the sections above show seasonal averages, it's also insightful to look at the extremes:
- During the high season, the absolute peak month showcases Kittilä's highest earning potential, with monthly revenues capable of climbing to $6,202, occupancy reaching a high of 74.6%, and ADRs peaking at $381.
- Conversely, the slowest single month of the year, typically falling within the low season, marks the market's lowest point. In this month, revenue might dip to $1,358, occupancy could drop to 23.2%, and ADRs may adjust down to $236.
- Understanding both the seasonal averages and these monthly peaks and troughs in revenue, occupancy, and ADR is crucial for maximizing your Airbnb profit potential in Kittilä.
Seasonal Strategies for Maximizing Profit
- Peak Season: Maximize revenue through premium pricing and potentially longer minimum stays. Ensure high availability.
- Low Season: Offer competitive pricing, special promotions (e.g., extended stay discounts), and flexible cancellation policies. Target off-season travelers like remote workers or budget-conscious guests.
- Shoulder Seasons: Implement dynamic pricing that balances peak and low rates. Target weekend travelers or specific events. Offer slightly more flexible terms than peak season.
- Regularly analyze your own performance against these Kittilä seasonality benchmarks and adjust your pricing and availability strategy accordingly.
Best Areas for Airbnb Investment in Kittilä (2026)
Exploring the top neighborhoods for short-term rentals in Kittilä? This section highlights key areas, outlining why they are attractive for hosts and guests, along with notable local attractions. Consider these locations based on your target guest profile and investment strategy.
| Neighborhood / Area | Why Host Here? (Target Guests & Appeal) | Key Attractions & Landmarks |
|---|---|---|
| Levi | Levi is Finland's premier ski resort known for its extensive slopes and winter activities. It attracts tourists year-round with skiing in winter and mountain biking in summer. | Levi Ski Resort, Levi Village, Levi Spa&Hotel, Ice Karting Levi, Levi Adventure Park |
| Kittilä Village | A charming village close to Levi offering a more local experience and access to cultural attractions and the beautiful Lapland nature. | Kittilä Church, Local museums, Lapland landscape, Cultural events, Traditional restaurants |
| Ylläs | Another popular ski resort offering a variety of winter sports and beautiful nature trails in summer, making it attractive for year-round visitors. | Ylläs Ski Resort, Pallas-Ylläs National Park, Ylläsjärvi Lake, Hiking trails, Mountain biking |
| Kaukola | A picturesque area known for its beautiful landscapes, Kaukola appeals to nature lovers and those looking to escape into the tranquility of Finnish Lapland. | Kaukola Nature Reserve, Scenic walking trails, Fishing spots, Sauna experiences |
| Sirkka | A quaint village providing access to Levi's ski areas while maintaining a peaceful atmosphere, perfect for those seeking a relaxing getaway. | Sirkka's local shops, Scenic views, Nature trails, Cafés and restaurants |
| Pallas | Part of the Pallas-Ylläs National Park, Pallas is known for its stunning natural beauty and is great for hiking and winter sports, appealing to adventurous tourists. | Pallas-Yllästunturi National Park, Hiking trails, Skiing areas, Wildlife watching |
| Vuontispirtti | A scenic area near the beautiful Lake Vuontis, known for outdoor activities and a peaceful atmosphere, suitable for relaxation and nature experiences. | Lake Vuontis, Hiking routes, Fishing spots, Scenic views |
| Äkäslompolo | A cozy village known for its close-knit community and access to natural wonders, ideal for tourists who enjoy a warm and welcoming atmosphere. | Äkäslompolo Lake, Hiking in Nature, Local events, Community markets |
Understanding Airbnb License Requirements & STR Laws in Kittilä (2026)
While Kittilä, Mainland Finland, Finland currently shows low STR regulations, specific Airbnb license requirements might still exist or change. Always verify the latest short term rental regulations and Airbnb license requirements directly with local government authorities for Kittilä to ensure full compliance before hosting.
(Source: AirROI data, 2026, finding no licensed listings among those analyzed)
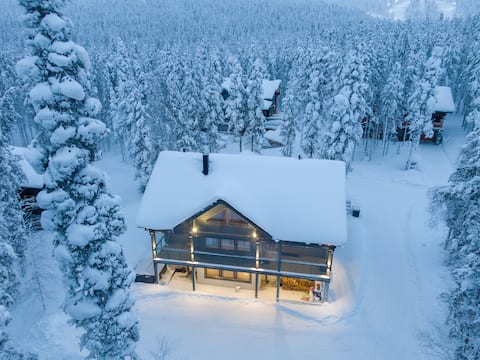
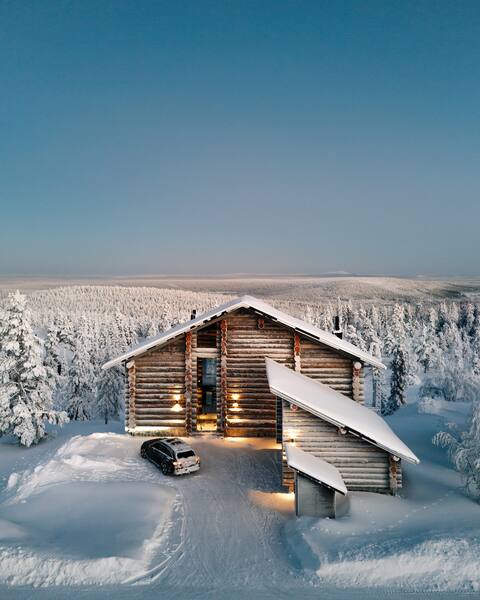
Top Performing Airbnb Properties in Kittilä (2026)
Benchmark your potential! Explore examples of top-performing Airbnb properties in Kittiläbased on Trailing Twelve Month (TTM) revenue. Analyze their characteristics, revenue, occupancy rate, and ADR to understand what drives success in this market.
Luxury Villa of 6 Bedrooms, Jacuzzi, Sauna, 14 ppl
Entire Place • 6 bedrooms
Luxury Villa Utsun Otso with outdoor jacuzzi
Entire Place • 4 bedrooms

Bear Lodge log cabin at Levi centre with jacuzzi
Entire Place • 7 bedrooms

Levi Aurora Igloo
Entire Place • 1 bedroom
Luxurious Villa with jacuzzi near Levi centrum
Entire Place • 4 bedrooms

Loghouse in Levi - little luxury for your vacation
Entire Place • 4 bedrooms
Note: Performance varies based on location, size, amenities, seasonality, and management quality. Data reflects the past 12 months.
Top Performing Airbnb Hosts in Kittilä (2026)
Learn from the best! This table showcases top-performing Airbnb hosts in Kittilä based on the number of properties managed and estimated total revenue over the past year. Analyze their scale and performance metrics.
| Host Name | Properties | Grossing Revenue | Stay Reviews | Avg Rating |
|---|---|---|---|---|
| Aavalevi Holidays | 23 | $645,142 | 65 | 4.80/5.0 |
| Holiday In Lapland | 29 | $572,939 | 151 | 4.74/5.0 |
| Levin Alppitalot | 11 | $377,895 | 129 | 4.76/5.0 |
| Levillenet | 10 | $308,283 | 53 | 4.56/5.0 |
| Hanne | 2 | $188,927 | 64 | 4.66/5.0 |
| Tom | 2 | $187,771 | 32 | 4.88/5.0 |
| Jere | 2 | $172,014 | 77 | 4.83/5.0 |
| Cabin Dreams Oy / Varaamökki C | 8 | $151,740 | 27 | 4.72/5.0 |
| Jussi | 1 | $140,125 | 1 | Not Rated |
| Tuulia | 3 | $137,590 | 112 | 4.81/5.0 |
Analyzing the strategies of top hosts, such as their property selection, pricing, and guest communication, can offer valuable lessons for optimizing your own Airbnb operations in Kittilä.
Dive Deeper: Advanced Kittilä STR Market Data (2026)
Ready to unlock more insights? AirROI provides access to advanced metrics and comprehensive Airbnb data for Kittilä. Explore detailed analytics beyond this report to refine your investment strategy, optimize pricing, and maximize your vacation rental profits.
Explore Advanced MetricsKittilä Short-Term Rental Market Composition (2026): Property & Room Types
Room Type Distribution
Property Type Distribution
Market Composition Insights for Kittilä
- The Kittilä Airbnb market composition is heavily skewed towards Entire Home/Apt listings, which make up 98.3% of the 481 active rentals. This indicates strong guest preference for privacy and space.
- Looking at the property type distribution in Kittilä, House properties are the most common (41%), reflecting the local real estate landscape.
- Houses represent a significant 41% portion, catering likely to families or larger groups.
- Smaller segments like hotel/boutique, unique stays, others (combined 3.1%) offer potential for unique stay experiences.
Kittilä Airbnb Room Capacity Analysis (2026): Bedroom Distribution
Distribution of Listings by Number of Bedrooms
Room Capacity Insights for Kittilä
- The dominant room capacity in Kittilä is 2 bedrooms listings, making up 29.5% of the market. This suggests a strong demand for properties suitable for couples or solo travelers.
- Together, 2 bedrooms and 1 bedroom properties represent 54.0% of the active Airbnb listings in Kittilä, indicating a high concentration in these sizes.
- A significant 38.2% of listings offer 3+ bedrooms, catering to larger groups and families seeking more space in Kittilä.
Kittilä Vacation Rental Guest Capacity Trends (2026)
Distribution of Listings by Guest Capacity
Guest Capacity Insights for Kittilä
- The most common guest capacity trend in Kittilä vacation rentals is listings accommodating 6 guests (29.3%). This suggests the primary traveler segment is likely larger groups.
- Properties designed for 6 guests and 8+ guests dominate the Kittilä STR market, accounting for 57.4% of listings.
- 61.4% of properties accommodate 6+ guests, serving the market segment for larger families or group travel in Kittilä.
- On average, properties in Kittilä are equipped to host 5.6 guests.
Kittilä Airbnb Booking Patterns (2026): Available vs. Booked Days
Available Days Distribution
Booked Days Distribution
Booking Pattern Insights for Kittilä
- The most common availability pattern in Kittilä falls within the 271-366 days range, representing 50.5% of listings. This suggests many properties have significant open periods on their calendars.
- Approximately 89.0% of listings show high availability (181+ days open annually), indicating potential for increased bookings or specific owner usage patterns.
- For booked days, the 91-180 days range is most frequent in Kittilä (40.3%), reflecting common guest stay durations or potential owner blocking patterns.
- A notable 11.2% of properties secure long booking periods (181+ days booked per year), highlighting successful long-term rental strategies or significant owner usage.
Kittilä Airbnb Minimum Stay Requirements Analysis
Distribution of Listings by Minimum Night Requirement
1 Night
37 listings
7.7% of total
2 Nights
48 listings
10% of total
3 Nights
46 listings
9.6% of total
4-6 Nights
67 listings
13.9% of total
7-29 Nights
7 listings
1.5% of total
30+ Nights
276 listings
57.4% of total
Key Insights
- The most prevalent minimum stay requirement in Kittilä is 30+ Nights, adopted by 57.4% of listings. This highlights the market's preference for longer commitments.
- Very short stays (1-2 nights) are less common (17.7%), suggesting hosts prefer slightly longer bookings to optimize turnover.
- A significant segment (57.4%) caters to monthly stays (30+ nights) in Kittilä, pointing to opportunities in the extended-stay market.
Recommendations
- Align with the market by considering a 30+ Nights minimum stay, as 57.4% of Kittilä hosts use this setting.
- If feasible, allowing 1-night stays, especially midweek or during low season, could capture last-minute bookings, as only 7.7% currently do.
- Explore offering discounts for stays of 30+ nights to attract the 57.4% of the market seeking extended stays.
- Adjust minimum nights based on seasonality – potentially shorter during low season and longer during peak demand periods in Kittilä.
Kittilä Airbnb Cancellation Policy Trends Analysis (2026)
Super Strict 30 Days
24 listings
5% of total
Super Strict 60 Days
21 listings
4.4% of total
Limited
10 listings
2.1% of total
Flexible
32 listings
6.7% of total
Moderate
36 listings
7.5% of total
Firm
254 listings
52.8% of total
Strict
104 listings
21.6% of total
Cancellation Policy Insights for Kittilä
- The prevailing Airbnb cancellation policy trend in Kittilä is Firm, used by 52.8% of listings.
- A majority (74.4%) of hosts in Kittilä utilize Firm or Strict policies, indicating a market where hosts prioritize booking security.
Recommendations for Hosts
- Consider adopting a Firm policy to align with the 52.8% market standard in Kittilä.
- Regularly review your cancellation policy against competitors and market demand shifts in Kittilä.
Kittilä STR Booking Lead Time Analysis (2026)
Average Booking Lead Time by Month
Booking Lead Time Insights for Kittilä
- The overall average booking lead time for vacation rentals in Kittilä is 87 days.
- Guests book furthest in advance for stays during December (average 128 days), likely coinciding with peak travel demand or local events.
- The shortest booking windows occur for stays in May (average 32 days), indicating more last-minute travel plans during this time.
- Seasonally, Winter (111 days avg.) sees the longest lead times, while Summer (45 days avg.) has the shortest, reflecting typical travel planning cycles.
Recommendations for Hosts
- Use the overall average lead time (87 days) as a baseline for your pricing and availability strategy in Kittilä.
- For December stays, consider implementing length-of-stay discounts or slightly higher rates for bookings made less than 128 days out to capitalize on advance planning.
- Target marketing efforts for the Winter season well in advance (at least 111 days) to capture early planners.
- Monitor your own booking lead times against these Kittilä averages to identify opportunities for dynamic pricing adjustments.
Popular & Essential Airbnb Amenities in Kittilä (2026)
Amenity Prevalence
Amenity Insights for Kittilä
- Essential amenities in Kittilä that guests expect include: Smoke alarm, Free parking on premises, Kitchen, TV. Lacking these (any) could significantly impact bookings.
- Popular amenities like Heating, Refrigerator, Dishes and silverware are common but not universal. Offering these can provide a competitive edge.
- Warning: Wifi is not universally provided but is considered essential globally. Ensure reliable Wifi is offered.
Recommendations for Hosts
- Ensure your listing includes all essential amenities for Kittilä: Smoke alarm, Free parking on premises, Kitchen, TV.
- Prioritize adding missing essentials: Smoke alarm, Free parking on premises, Kitchen, TV.
- Consider adding popular differentiators like Heating or Refrigerator to increase appeal.
- Highlight unique or less common amenities you offer (e.g., hot tub, dedicated workspace, EV charger) in your listing description and photos.
- Regularly check competitor amenities in Kittilä to stay competitive.
Kittilä Airbnb Guest Demographics & Profile Analysis (2026)
Guest Profile Summary for Kittilä
- The typical guest profile for Airbnb in Kittilä consists of predominantly international visitors (79%), with top international origins including France, typically belonging to the Post-2000s (Gen Z/Alpha) group (50%), primarily speaking English or German.
- Domestic travelers account for 21.0% of guests.
- Key international markets include Finland (21%) and France (15.1%).
- Top languages spoken are English (41.5%) followed by German (13%).
- A significant demographic segment is the Post-2000s (Gen Z/Alpha) group, representing 50% of guests.
Recommendations for Hosts
- Focus marketing internationally, particularly towards travelers from France.
- Tailor amenities and listing descriptions to appeal to the dominant Post-2000s (Gen Z/Alpha) demographic (e.g., highlight fast WiFi, smart home features, local guides).
- Highlight unique local experiences or amenities relevant to the primary guest profile.
- Consider seasonal promotions aligned with peak travel times for key origin markets.
Nearby Short-Term Rental Market Comparison
How does the Kittilä Airbnb market stack up against its neighbors? Compare key performance metrics like average monthly revenue, ADR, and occupancy rates in surrounding areas to understand the broader regional STR landscape.