Loppi Airbnb Market Analysis 2026: Short Term Rental Data & Vacation Rental Statistics in Mainland Finland, Finland
Is Airbnb profitable in Loppi in 2026? Explore comprehensive Airbnb analytics for Loppi, Mainland Finland, Finland to uncover income potential. This 2026 STR market report for Loppi, based on AirROI data from February 2025 to January 2026, reveals key trends in the niche market of 24 active listings.
Whether you're considering an Airbnb investment in Loppi, optimizing your existing vacation rental, or exploring rental arbitrage opportunities, understanding the Loppi Airbnb data is crucial. Leveraging the low regulation environment is key to maximizing your short term rental income potential. Let's dive into the specifics.
Key Loppi Airbnb Performance Metrics Overview
Monthly Airbnb Revenue Variations & Income Potential in Loppi (2026)
Understanding the monthly revenue variations for Airbnb listings in Loppi is key to maximizing your short term rental income potential. Seasonality significantly impacts earnings. Our analysis, based on data from the past 12 months, shows that the peak revenue month for STRs in Loppi is typically July, while January often presents the lowest earnings, highlighting opportunities for strategic pricing adjustments during shoulder and low seasons. Explore the typical Airbnb income in Loppi across different performance tiers:
- Best-in-class properties (Top 10%) achieve $6,205+ monthly, often utilizing dynamic pricing and superior guest experiences.
- Strong performing properties (Top 25%) earn $3,868 or more, indicating effective management and desirable locations/amenities.
- Typical properties (Median) generate around $1,464 per month, representing the average market performance.
- Entry-level properties (Bottom 25%) see earnings around $713, often with potential for optimization.
Average Monthly Airbnb Earnings Trend in Loppi
Loppi Airbnb Occupancy Rate Trends (2026)
Maximize your bookings by understanding the Loppi STR occupancy trends. Seasonal demand shifts significantly influence how often properties are booked. Typically, Julysees the highest demand (peak season occupancy), while January experiences the lowest (low season). Effective strategies, like adjusting minimum stays or offering promotions, can boost occupancy during slower periods. Here's how different property tiers perform in Loppi:
- Best-in-class properties (Top 10%) achieve 75%+ occupancy, indicating high desirability and potentially optimized availability.
- Strong performing properties (Top 25%) maintain 50% or higher occupancy, suggesting good market fit and guest satisfaction.
- Typical properties (Median) have an occupancy rate around 30%.
- Entry-level properties (Bottom 25%) average 18% occupancy, potentially facing higher vacancy.
Average Monthly Occupancy Rate Trend in Loppi
Average Daily Rate (ADR) Airbnb Trends in Loppi (2026)
Effective short term rental pricing strategy in Loppi involves understanding monthly ADR fluctuations. The Average Daily Rate (ADR) for Airbnb in Loppi typically peaks in December and dips lowest during March. Leveraging Airbnb dynamic pricing tools or strategies based on this seasonality can significantly boost revenue. Here's a look at the typical nightly rates achieved:
- Best-in-class properties (Top 10%) command rates of $487+ per night, often due to premium features or locations.
- Strong performing properties (Top 25%) achieve nightly rates of $233 or more.
- Typical properties (Median) charge around $147 per night.
- Entry-level properties (Bottom 25%) earn around $101 per night.
Average Daily Rate (ADR) Trend by Month in Loppi
Get Live Loppi Market Intelligence 👇

Explore Real-time Analytics
Airbnb Seasonality Analysis & Trends in Loppi (2026)
Peak Season (July, December, June)
- Revenue averages $3,489 per month
- Occupancy rates average 46.5%
- Daily rates average $232
Shoulder Season
- Revenue averages $2,589 per month
- Occupancy maintains around 36.1%
- Daily rates hold near $215
Low Season (January, April, October)
- Revenue drops to average $1,738 per month
- Occupancy decreases to average 28.8%
- Daily rates adjust to average $223
Seasonality Insights for Loppi
- The Airbnb seasonality in Loppi shows highly seasonal trends requiring careful strategy. While the sections above show seasonal averages, it's also insightful to look at the extremes:
- During the high season, the absolute peak month showcases Loppi's highest earning potential, with monthly revenues capable of climbing to $3,714, occupancy reaching a high of 55.6%, and ADRs peaking at $243.
- Conversely, the slowest single month of the year, typically falling within the low season, marks the market's lowest point. In this month, revenue might dip to $1,287, occupancy could drop to 23.1%, and ADRs may adjust down to $195.
- Understanding both the seasonal averages and these monthly peaks and troughs in revenue, occupancy, and ADR is crucial for maximizing your Airbnb profit potential in Loppi.
Seasonal Strategies for Maximizing Profit
- Peak Season: Maximize revenue through premium pricing and potentially longer minimum stays. Ensure high availability.
- Low Season: Offer competitive pricing, special promotions (e.g., extended stay discounts), and flexible cancellation policies. Target off-season travelers like remote workers or budget-conscious guests.
- Shoulder Seasons: Implement dynamic pricing that balances peak and low rates. Target weekend travelers or specific events. Offer slightly more flexible terms than peak season.
- Regularly analyze your own performance against these Loppi seasonality benchmarks and adjust your pricing and availability strategy accordingly.
Best Areas for Airbnb Investment in Loppi (2026)
Exploring the top neighborhoods for short-term rentals in Loppi? This section highlights key areas, outlining why they are attractive for hosts and guests, along with notable local attractions. Consider these locations based on your target guest profile and investment strategy.
| Neighborhood / Area | Why Host Here? (Target Guests & Appeal) | Key Attractions & Landmarks |
|---|---|---|
| Jämsä | A picturesque town known for its beautiful lakes and natural scenery. Perfect for tourists seeking tranquility and nature experiences, with access to hiking and water activities. | Jämsä's lakes, Himos Ski Resort, Jämsä Church, Jämsänkoski, Paijanlahti, Ylä-Päijänne |
| Loppi | Located in the heart of Finland, Loppi is perfect for outdoor enthusiasts and those looking for a peaceful getaway. It's a great spot for winter sports and summer activities alike. | Suomenselkä, Loppijärvi Lake, Loppi Church, Local nature trails, Sporting events at the local stadium, Nearby ski resorts |
| Ruokolahti | A charming town surrounded by nature, ideal for those looking to enjoy the Finnish countryside and outdoor activities like hiking and fishing. | Ruokolahti Church, Lake Ruokolahti, Ruokolahti's nature trails, Local museums, Fishing spots, Cafés by the lakeside |
| Tammela | Famous for its stunning landscapes and lakes, Tammela offers visitors a serene environment and is great for families and nature lovers. | Lake Kukkia, Tammelan Nature Reserve, Pälkäne Church, Local hiking paths, Summer events, Cottage rentals |
| Päijänne | This area is famous for the Päijänne National Park, attracting visitors who appreciate nature, boating, and outdoor recreation. | Päijänne National Park, Boating excursions, Fishing spots, Hiking trails, Natural scenery, Cultural heritage sites |
| Forssa | A vibrant town with rich history and various activities. The area offers cultural events and attractive destinations for families. | Forssa Museum, Western Finland Nature Centre, Local attractions, Parks and playgrounds, Cafés and restaurants, Shopping in the town center |
| Lahti | A major regional hub with modern amenities and attractions, Lahti is great for visitors looking for urban experiences coupled with recreational activities. | Ski and sports center, Lahti Symphony Orchestra, Cultural events, Lake Vesijärvi, Shopping districts, Dining establishments |
| Hämeenlinna | A historical city known for its medieval castle and scenic lakes. Offers a mix of culture, history, and nature activities. | Hämeenlinna Castle, Aulanko Nature Reserve, Local museums, Cafés and parks, Lake Vanajavesi, Walking trails |
Understanding Airbnb License Requirements & STR Laws in Loppi (2026)
While Loppi, Mainland Finland, Finland currently shows low STR regulations, specific Airbnb license requirements might still exist or change. Always verify the latest short term rental regulations and Airbnb license requirements directly with local government authorities for Loppi to ensure full compliance before hosting.
(Source: AirROI data, 2026, finding no licensed listings among those analyzed)
Top Performing Airbnb Properties in Loppi (2026)
Benchmark your potential! Explore examples of top-performing Airbnb properties in Loppibased on Trailing Twelve Month (TTM) revenue. Analyze their characteristics, revenue, occupancy rate, and ADR to understand what drives success in this market.
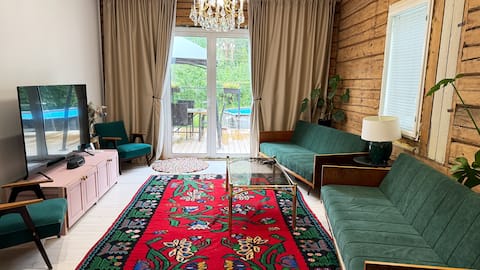
Farmhouse with amenities
Entire Place • 5 bedrooms

Peace & Privacy – Loppi Luxus
Entire Place • 7 bedrooms

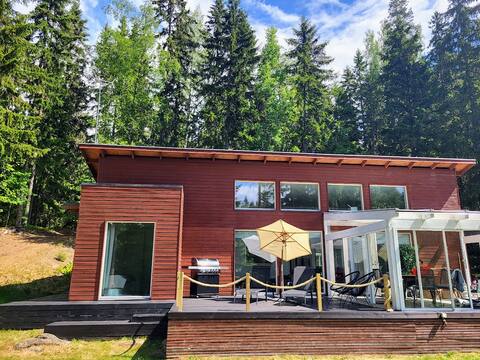
A lovely place with an outdoor hot tub and a yard sauna
Entire Place • 2 bedrooms
Cottage by the lake
Entire Place • 4 bedrooms

Peace & Privacy - Räyskälä Grand Villa
Entire Place • 12 bedrooms
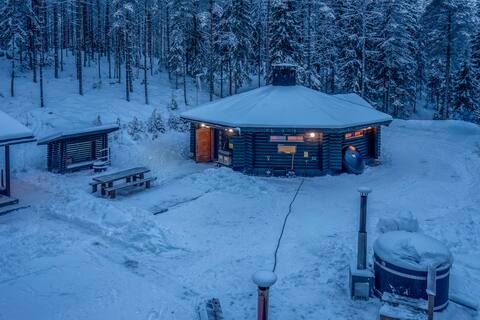
Peace & Privacy – Loppi Wilderness Villa
Entire Place • 3 bedrooms
Note: Performance varies based on location, size, amenities, seasonality, and management quality. Data reflects the past 12 months.
Top Performing Airbnb Hosts in Loppi (2026)
Learn from the best! This table showcases top-performing Airbnb hosts in Loppi based on the number of properties managed and estimated total revenue over the past year. Analyze their scale and performance metrics.
| Host Name | Properties | Grossing Revenue | Stay Reviews | Avg Rating |
|---|---|---|---|---|
| Kaj | 3 | $137,549 | 14 | 4.75/5.0 |
| Sami | 1 | $68,386 | 22 | 4.82/5.0 |
| Raikku | 1 | $63,742 | 134 | 4.81/5.0 |
| Toni | 1 | $44,660 | 33 | 4.82/5.0 |
| Anne | 1 | $28,645 | 13 | 4.85/5.0 |
| Sanna | 1 | $28,321 | 51 | 4.80/5.0 |
| Merja | 5 | $21,446 | 150 | 4.59/5.0 |
| Joni | 1 | $19,957 | 11 | 5.00/5.0 |
| Elina | 1 | $16,785 | 120 | 4.83/5.0 |
| Jari | 1 | $14,272 | 65 | 4.85/5.0 |
Analyzing the strategies of top hosts, such as their property selection, pricing, and guest communication, can offer valuable lessons for optimizing your own Airbnb operations in Loppi.
Dive Deeper: Advanced Loppi STR Market Data (2026)
Ready to unlock more insights? AirROI provides access to advanced metrics and comprehensive Airbnb data for Loppi. Explore detailed analytics beyond this report to refine your investment strategy, optimize pricing, and maximize your vacation rental profits.
Explore Advanced MetricsLoppi Short-Term Rental Market Composition (2026): Property & Room Types
Room Type Distribution
Property Type Distribution
Market Composition Insights for Loppi
- The Loppi Airbnb market composition is heavily skewed towards Entire Home/Apt listings, which make up 91.7% of the 24 active rentals. This indicates strong guest preference for privacy and space.
- Looking at the property type distribution in Loppi, House properties are the most common (54.2%), reflecting the local real estate landscape.
- Houses represent a significant 54.2% portion, catering likely to families or larger groups.
- Smaller segments like apartment/condo (combined 4.2%) offer potential for unique stay experiences.
Loppi Airbnb Room Capacity Analysis (2026): Bedroom Distribution
Distribution of Listings by Number of Bedrooms
Room Capacity Insights for Loppi
- The dominant room capacity in Loppi is 2 bedrooms listings, making up 29.2% of the market. This suggests a strong demand for properties suitable for couples or solo travelers.
- Together, 2 bedrooms and 3 bedrooms properties represent 54.2% of the active Airbnb listings in Loppi, indicating a high concentration in these sizes.
- A significant 45.8% of listings offer 3+ bedrooms, catering to larger groups and families seeking more space in Loppi.
Loppi Vacation Rental Guest Capacity Trends (2026)
Distribution of Listings by Guest Capacity
Guest Capacity Insights for Loppi
- The most common guest capacity trend in Loppi vacation rentals is listings accommodating 8+ guests (29.2%). This suggests the primary traveler segment is likely larger groups.
- Properties designed for 8+ guests and 4 guests dominate the Loppi STR market, accounting for 54.2% of listings.
- 50.0% of properties accommodate 6+ guests, serving the market segment for larger families or group travel in Loppi.
- On average, properties in Loppi are equipped to host 5.3 guests.
Loppi Airbnb Booking Patterns (2026): Available vs. Booked Days
Available Days Distribution
Booked Days Distribution
Booking Pattern Insights for Loppi
- The most common availability pattern in Loppi falls within the 271-366 days range, representing 66.7% of listings. This suggests many properties have significant open periods on their calendars.
- Approximately 91.7% of listings show high availability (181+ days open annually), indicating potential for increased bookings or specific owner usage patterns.
- For booked days, the 31-90 days range is most frequent in Loppi (54.2%), reflecting common guest stay durations or potential owner blocking patterns.
- A notable 8.4% of properties secure long booking periods (181+ days booked per year), highlighting successful long-term rental strategies or significant owner usage.
Loppi Airbnb Minimum Stay Requirements Analysis
Distribution of Listings by Minimum Night Requirement
1 Night
12 listings
50% of total
2 Nights
8 listings
33.3% of total
3 Nights
1 listings
4.2% of total
4-6 Nights
1 listings
4.2% of total
30+ Nights
2 listings
8.3% of total
Key Insights
- The most prevalent minimum stay requirement in Loppi is 1 Night, adopted by 50% of listings. This highlights the market's preference for shorter, flexible bookings.
- A strong majority (83.3%) of the Loppi Airbnb data shows acceptance of very short stays (1-2 nights), indicating a dynamic, high-turnover market.
Recommendations
- Align with the market by considering a 1 Night minimum stay, as 50% of Loppi hosts use this setting.
- Explore offering discounts for stays of 30+ nights to attract the 8.3% of the market seeking extended stays.
- Adjust minimum nights based on seasonality – potentially shorter during low season and longer during peak demand periods in Loppi.
Loppi Airbnb Cancellation Policy Trends Analysis (2026)
Flexible
12 listings
50% of total
Moderate
6 listings
25% of total
Firm
2 listings
8.3% of total
Strict
4 listings
16.7% of total
Cancellation Policy Insights for Loppi
- The prevailing Airbnb cancellation policy trend in Loppi is Flexible, used by 50% of listings.
- The market strongly favors guest-friendly terms, with 75.0% of listings offering Flexible or Moderate policies. This suggests guests in Loppi may expect booking flexibility.
Recommendations for Hosts
- Consider adopting a Flexible policy to align with the 50% market standard in Loppi.
- Regularly review your cancellation policy against competitors and market demand shifts in Loppi.
Loppi STR Booking Lead Time Analysis (2026)
Average Booking Lead Time by Month
Booking Lead Time Insights for Loppi
- The overall average booking lead time for vacation rentals in Loppi is 69 days.
- Guests book furthest in advance for stays during June (average 115 days), likely coinciding with peak travel demand or local events.
- The shortest booking windows occur for stays in February (average 33 days), indicating more last-minute travel plans during this time.
- Seasonally, Summer (89 days avg.) sees the longest lead times, while Spring (50 days avg.) has the shortest, reflecting typical travel planning cycles.
Recommendations for Hosts
- Use the overall average lead time (69 days) as a baseline for your pricing and availability strategy in Loppi.
- For June stays, consider implementing length-of-stay discounts or slightly higher rates for bookings made less than 115 days out to capitalize on advance planning.
- Target marketing efforts for the Summer season well in advance (at least 89 days) to capture early planners.
- Monitor your own booking lead times against these Loppi averages to identify opportunities for dynamic pricing adjustments.
Popular & Essential Airbnb Amenities in Loppi (2026)
Amenity Prevalence
Amenity Insights for Loppi
- Essential amenities in Loppi that guests expect include: Smoke alarm, Free parking on premises, Kitchen, Heating. Lacking these (any) could significantly impact bookings.
- Popular amenities like TV, Refrigerator, Dishes and silverware are common but not universal. Offering these can provide a competitive edge.
Recommendations for Hosts
- Ensure your listing includes all essential amenities for Loppi: Smoke alarm, Free parking on premises, Kitchen, Heating.
- Prioritize adding missing essentials: Kitchen, Heating.
- Consider adding popular differentiators like TV or Refrigerator to increase appeal.
- Highlight unique or less common amenities you offer (e.g., hot tub, dedicated workspace, EV charger) in your listing description and photos.
- Regularly check competitor amenities in Loppi to stay competitive.
Loppi Airbnb Guest Demographics & Profile Analysis (2026)
Guest Profile Summary for Loppi
- The typical guest profile for Airbnb in Loppi consists of primarily domestic travelers (79%), often arriving from nearby Helsinki, typically belonging to the Post-2000s (Gen Z/Alpha) group (50%), primarily speaking English or Finnish.
- Domestic travelers account for 78.7% of guests.
- Key international markets include Finland (78.7%) and Germany (3.1%).
- Top languages spoken are English (37.7%) followed by Finnish (36.4%).
- A significant demographic segment is the Post-2000s (Gen Z/Alpha) group, representing 50% of guests.
Recommendations for Hosts
- Target domestic marketing efforts towards travelers from Helsinki and Vantaa.
- Tailor amenities and listing descriptions to appeal to the dominant Post-2000s (Gen Z/Alpha) demographic (e.g., highlight fast WiFi, smart home features, local guides).
- Highlight unique local experiences or amenities relevant to the primary guest profile.
- Consider seasonal promotions aligned with peak travel times for key origin markets.
Nearby Short-Term Rental Market Comparison
How does the Loppi Airbnb market stack up against its neighbors? Compare key performance metrics like average monthly revenue, ADR, and occupancy rates in surrounding areas to understand the broader regional STR landscape.
| Market | Active Properties | Monthly Revenue | Daily Rate | Avg. Occupancy |
|---|---|---|---|---|
| Sysmä | 16 | $2,882 | $287.09 | 40% |
| Lempäälä | 18 | $2,559 | $193.94 | 46% |
| Kirkkonummi | 65 | $2,123 | $221.41 | 41% |
| Hattula | 11 | $1,860 | $192.87 | 33% |
| Pirkkala | 28 | $1,858 | $199.04 | 44% |
| Ingå | 30 | $1,821 | $214.59 | 40% |
| Salo | 110 | $1,798 | $197.10 | 36% |
| Sipoo | 29 | $1,734 | $254.67 | 33% |
| Vihti | 32 | $1,732 | $196.45 | 35% |
| Jämsä | 67 | $1,683 | $318.39 | 25% |