Hammarland Airbnb Market Analysis 2026: Short Term Rental Data & Vacation Rental Statistics in Åland Islands, Finland
Is Airbnb profitable in Hammarland in 2026? Explore comprehensive Airbnb analytics for Hammarland, Åland Islands, Finland to uncover income potential. This 2026 STR market report for Hammarland, based on AirROI data from January 2025 to December 2025, reveals key trends in the niche market of 19 active listings.
Whether you're considering an Airbnb investment in Hammarland, optimizing your existing vacation rental, or exploring rental arbitrage opportunities, understanding the Hammarland Airbnb data is crucial. Leveraging the low regulation environment is key to maximizing your short term rental income potential. Let's dive into the specifics.
Key Hammarland Airbnb Performance Metrics Overview
Monthly Airbnb Revenue Variations & Income Potential in Hammarland (2026)
Understanding the monthly revenue variations for Airbnb listings in Hammarland is key to maximizing your short term rental income potential. Seasonality significantly impacts earnings. Our analysis, based on data from the past 12 months, shows that the peak revenue month for STRs in Hammarland is typically November, while September often presents the lowest earnings, highlighting opportunities for strategic pricing adjustments during shoulder and low seasons. Explore the typical Airbnb income in Hammarland across different performance tiers:
- Best-in-class properties (Top 10%) achieve $4,276+ monthly, often utilizing dynamic pricing and superior guest experiences.
- Strong performing properties (Top 25%) earn $3,167 or more, indicating effective management and desirable locations/amenities.
- Typical properties (Median) generate around $2,184 per month, representing the average market performance.
- Entry-level properties (Bottom 25%) see earnings around $1,532, often with potential for optimization.
Average Monthly Airbnb Earnings Trend in Hammarland
Hammarland Airbnb Occupancy Rate Trends (2026)
Maximize your bookings by understanding the Hammarland STR occupancy trends. Seasonal demand shifts significantly influence how often properties are booked. Typically, Julysees the highest demand (peak season occupancy), while September experiences the lowest (low season). Effective strategies, like adjusting minimum stays or offering promotions, can boost occupancy during slower periods. Here's how different property tiers perform in Hammarland:
- Best-in-class properties (Top 10%) achieve 70%+ occupancy, indicating high desirability and potentially optimized availability.
- Strong performing properties (Top 25%) maintain 57% or higher occupancy, suggesting good market fit and guest satisfaction.
- Typical properties (Median) have an occupancy rate around 44%.
- Entry-level properties (Bottom 25%) average 32% occupancy, potentially facing higher vacancy.
Average Monthly Occupancy Rate Trend in Hammarland
Average Daily Rate (ADR) Airbnb Trends in Hammarland (2026)
Effective short term rental pricing strategy in Hammarland involves understanding monthly ADR fluctuations. The Average Daily Rate (ADR) for Airbnb in Hammarland typically peaks in July and dips lowest during April. Leveraging Airbnb dynamic pricing tools or strategies based on this seasonality can significantly boost revenue. Here's a look at the typical nightly rates achieved:
- Best-in-class properties (Top 10%) command rates of $261+ per night, often due to premium features or locations.
- Strong performing properties (Top 25%) achieve nightly rates of $186 or more.
- Typical properties (Median) charge around $151 per night.
- Entry-level properties (Bottom 25%) earn around $101 per night.
Average Daily Rate (ADR) Trend by Month in Hammarland
Get Live Hammarland Market Intelligence 👇
Explore Real-time Analytics
Airbnb Seasonality Analysis & Trends in Hammarland (2025)
Peak Season (November, July, February)
- Revenue averages $4,022 per month
- Occupancy rates average 63.9%
- Daily rates average $162
Shoulder Season
- Revenue averages $2,084 per month
- Occupancy maintains around 43.6%
- Daily rates hold near $157
Low Season (September, October, December)
- Revenue drops to average $969 per month
- Occupancy decreases to average 19.7%
- Daily rates adjust to average $155
Seasonality Insights for Hammarland
- The Airbnb seasonality in Hammarland shows highly seasonal trends requiring careful strategy. While the sections above show seasonal averages, it's also insightful to look at the extremes:
- During the high season, the absolute peak month showcases Hammarland's highest earning potential, with monthly revenues capable of climbing to $4,965, occupancy reaching a high of 70.5%, and ADRs peaking at $176.
- Conversely, the slowest single month of the year, typically falling within the low season, marks the market's lowest point. In this month, revenue might dip to $0, occupancy could drop to 0.0%, and ADRs may adjust down to $153.
- Understanding both the seasonal averages and these monthly peaks and troughs in revenue, occupancy, and ADR is crucial for maximizing your Airbnb profit potential in Hammarland.
Seasonal Strategies for Maximizing Profit
- Peak Season: Maximize revenue through premium pricing and potentially longer minimum stays. Ensure high availability.
- Low Season: Offer competitive pricing, special promotions (e.g., extended stay discounts), and flexible cancellation policies. Target off-season travelers like remote workers or budget-conscious guests.
- Shoulder Seasons: Implement dynamic pricing that balances peak and low rates. Target weekend travelers or specific events. Offer slightly more flexible terms than peak season.
- Regularly analyze your own performance against these Hammarland seasonality benchmarks and adjust your pricing and availability strategy accordingly.
Best Areas for Airbnb Investment in Hammarland (2026)
Exploring the top neighborhoods for short-term rentals in Hammarland? This section highlights key areas, outlining why they are attractive for hosts and guests, along with notable local attractions. Consider these locations based on your target guest profile and investment strategy.
| Neighborhood / Area | Why Host Here? (Target Guests & Appeal) | Key Attractions & Landmarks |
|---|---|---|
| Kumlinge | A beautiful island in Åland known for its serene landscapes and natural beauty. Perfect for guests looking for a peaceful escape with outdoor activities. | Kumlinge Church, Nature trails, Sailing opportunities, Scenic viewpoints, Local artisan shops |
| Jomala | Located near Mariehamn, Jomala offers a blend of urban convenience and natural beauty. Great for tourists seeking a mix of relaxation and cultural exploration. | Maritime Museum, Local shops and cafes, Beautiful parks, Access to Mariehamn attractions |
| Eckerö | Known for its stunning nature and outdoor activities, Eckerö attracts nature lovers and families looking for a getaway. | Eckerö Getaway, Eckerö Post and Customs House, Beaches, Nature trails |
| Lemland | This charming area is known for its local atmosphere and proximity to both nature and amenities, ideal for travelers looking to explore Åland. | Local markets, Nature parks, Cultural events, Historic sites |
| Vårdö | A remote island known for its tranquility and natural beauty. Perfect for eco-tourism and those looking to disconnect from the hustle and bustle. | Vårdö Church, Beautiful nature, Outdoor activities, Local wildlife |
| Brändö | A sparsely populated island ideal for adventure seekers and peace lovers. Offers unique experiences in nature and local culture. | Local art and culture, Hiking trails, Fishing spots, Scenic views |
| Småholm | This is a peaceful area known for its scenic beauty and family-friendly environment, attracting visitors who wish to relax and enjoy nature. | Beach access, Local parks, Scenic walks, Picnic areas |
| Sund | An attractive area with a rich history and beautiful coastline. It is popular among tourists for its cultural heritage and outdoor activities. | Sund Church, Historic sites, Coastal hiking, Local eateries |
Understanding Airbnb License Requirements & STR Laws in Hammarland (2026)
While Hammarland, Åland Islands, Finland currently shows low STR regulations, specific Airbnb license requirements might still exist or change. Always verify the latest short term rental regulations and Airbnb license requirements directly with local government authorities for Hammarland to ensure full compliance before hosting.
(Source: AirROI data, 2026, finding no licensed listings among those analyzed)
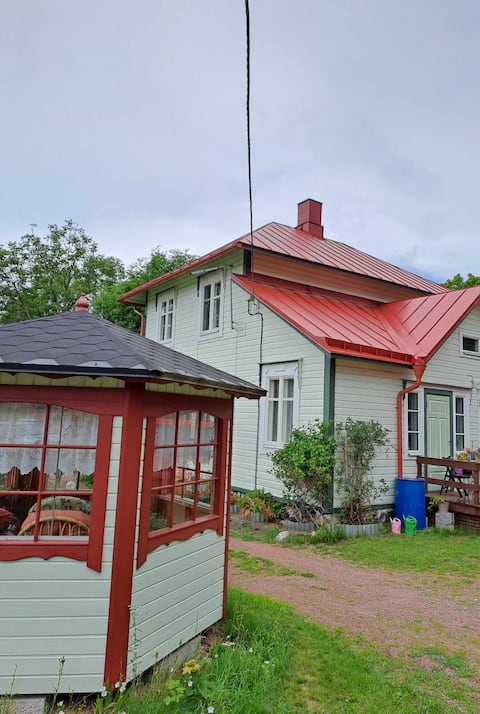
Top Performing Airbnb Properties in Hammarland (2026)
Benchmark your potential! Explore examples of top-performing Airbnb properties in Hammarlandbased on Trailing Twelve Month (TTM) revenue. Analyze their characteristics, revenue, occupancy rate, and ADR to understand what drives success in this market.

A slice of paradise - perfect for fishing!
Entire Place • 5 bedrooms
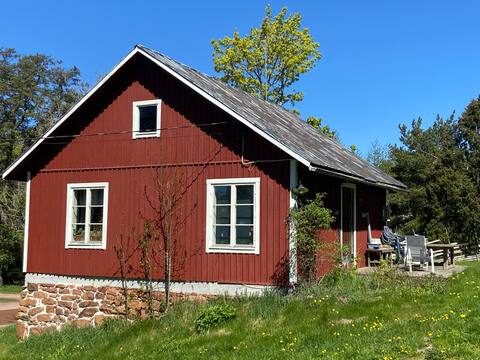
Private house in northwestern Åland
Entire Place • 2 bedrooms
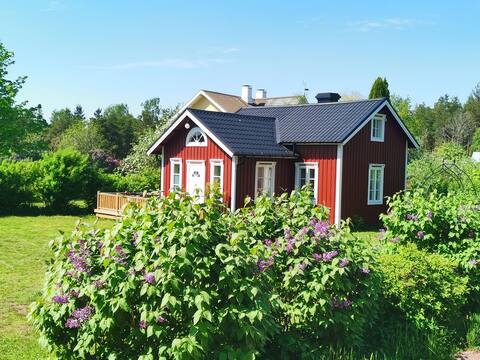
Lillstugan in Frebbenby
Entire Place • 2 bedrooms
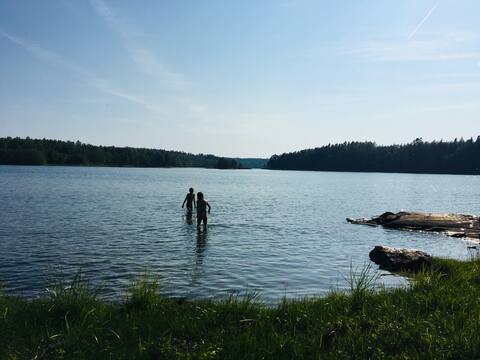
Grannstugan- a cosy cabin with a private beach!
Entire Place • 1 bedroom
Grönlunds
Entire Place • 2 bedrooms
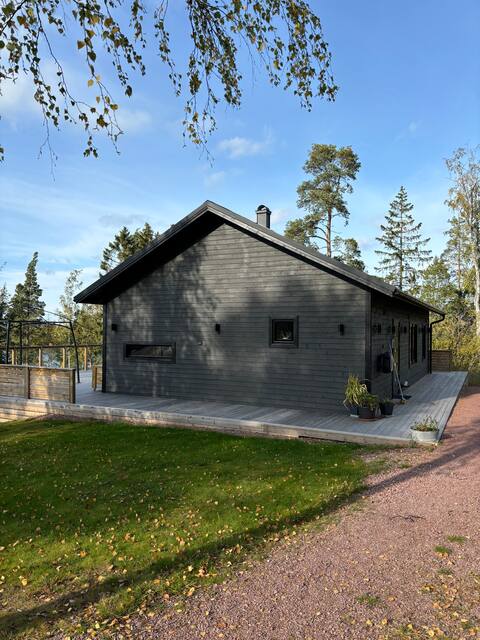
Modern cottage in the countryside
Entire Place • 2 bedrooms
Note: Performance varies based on location, size, amenities, seasonality, and management quality. Data reflects the past 12 months.
Top Performing Airbnb Hosts in Hammarland (2026)
Learn from the best! This table showcases top-performing Airbnb hosts in Hammarland based on the number of properties managed and estimated total revenue over the past year. Analyze their scale and performance metrics.
| Host Name | Properties | Grossing Revenue | Stay Reviews | Avg Rating |
|---|---|---|---|---|
| Klas | 1 | $51,110 | 59 | 4.90/5.0 |
| Mischa | 1 | $21,094 | 7 | 4.00/5.0 |
| Lena | 1 | $18,117 | 15 | 5.00/5.0 |
| Emma | 1 | $17,287 | 60 | 4.87/5.0 |
| Berit | 1 | $13,554 | 39 | 4.95/5.0 |
| Emelie Och Kristian | 1 | $12,880 | 6 | 5.00/5.0 |
| Tuija | 1 | $10,492 | 3 | 5.00/5.0 |
| Joanna | 1 | $10,416 | 16 | 4.94/5.0 |
| Jannika | 1 | $10,411 | 41 | 4.83/5.0 |
| Mona | 1 | $10,347 | 33 | 4.88/5.0 |
Analyzing the strategies of top hosts, such as their property selection, pricing, and guest communication, can offer valuable lessons for optimizing your own Airbnb operations in Hammarland.
Dive Deeper: Advanced Hammarland STR Market Data (2026)
Ready to unlock more insights? AirROI provides access to advanced metrics and comprehensive Airbnb data for Hammarland. Explore detailed analytics beyond this report to refine your investment strategy, optimize pricing, and maximize your vacation rental profits.
Explore Advanced MetricsHammarland Short-Term Rental Market Composition (2026): Property & Room Types
Room Type Distribution
Property Type Distribution
Market Composition Insights for Hammarland
- The Hammarland Airbnb market composition is heavily skewed towards Entire Home/Apt listings, which make up 100% of the 19 active rentals. This indicates strong guest preference for privacy and space.
- Looking at the property type distribution in Hammarland, Outdoor/Unique properties are the most common (47.4%), reflecting the local real estate landscape.
- Houses represent a significant 36.8% portion, catering likely to families or larger groups.
- The presence of 15.8% Hotel/Boutique listings indicates integration with traditional hospitality.
Hammarland Airbnb Room Capacity Analysis (2026): Bedroom Distribution
Distribution of Listings by Number of Bedrooms
Room Capacity Insights for Hammarland
- The dominant room capacity in Hammarland is 1 bedroom listings, making up 47.4% of the market. This suggests a strong demand for properties suitable for couples or solo travelers.
- Together, 1 bedroom and 2 bedrooms properties represent 73.7% of the active Airbnb listings in Hammarland, indicating a high concentration in these sizes.
- A significant 26.4% of listings offer 3+ bedrooms, catering to larger groups and families seeking more space in Hammarland.
Hammarland Vacation Rental Guest Capacity Trends (2026)
Distribution of Listings by Guest Capacity
Guest Capacity Insights for Hammarland
- The most common guest capacity trend in Hammarland vacation rentals is listings accommodating 4 guests (36.8%). This suggests the primary traveler segment is likely small families or groups.
- Properties designed for 4 guests and 2 guests dominate the Hammarland STR market, accounting for 57.9% of listings.
- 15.9% of properties accommodate 6+ guests, serving the market segment for larger families or group travel in Hammarland.
- On average, properties in Hammarland are equipped to host 4.1 guests.
Hammarland Airbnb Booking Patterns (2026): Available vs. Booked Days
Available Days Distribution
Booked Days Distribution
Booking Pattern Insights for Hammarland
- The most common availability pattern in Hammarland falls within the 271-366 days range, representing 78.9% of listings. This suggests many properties have significant open periods on their calendars.
- Approximately 94.7% of listings show high availability (181+ days open annually), indicating potential for increased bookings or specific owner usage patterns.
- For booked days, the 31-90 days range is most frequent in Hammarland (47.4%), reflecting common guest stay durations or potential owner blocking patterns.
- A notable 5.3% of properties secure long booking periods (181+ days booked per year), highlighting successful long-term rental strategies or significant owner usage.
Hammarland Airbnb Minimum Stay Requirements Analysis
Distribution of Listings by Minimum Night Requirement
1 Night
3 listings
15.8% of total
2 Nights
5 listings
26.3% of total
3 Nights
3 listings
15.8% of total
4-6 Nights
3 listings
15.8% of total
30+ Nights
5 listings
26.3% of total
Key Insights
- The most prevalent minimum stay requirement in Hammarland is 2 Nights, adopted by 26.3% of listings. This highlights the market's preference for shorter, flexible bookings.
- A significant segment (26.3%) caters to monthly stays (30+ nights) in Hammarland, pointing to opportunities in the extended-stay market.
Recommendations
- Align with the market by considering a 2 Nights minimum stay, as 26.3% of Hammarland hosts use this setting.
- If feasible, allowing 1-night stays, especially midweek or during low season, could capture last-minute bookings, as only 15.8% currently do.
- Explore offering discounts for stays of 30+ nights to attract the 26.3% of the market seeking extended stays.
- Adjust minimum nights based on seasonality – potentially shorter during low season and longer during peak demand periods in Hammarland.
Hammarland Airbnb Cancellation Policy Trends Analysis (2026)
Flexible
4 listings
21.1% of total
Moderate
9 listings
47.4% of total
Firm
2 listings
10.5% of total
Strict
4 listings
21.1% of total
Cancellation Policy Insights for Hammarland
- The prevailing Airbnb cancellation policy trend in Hammarland is Moderate, used by 47.4% of listings.
- There's a relatively balanced mix between guest-friendly (68.5%) and stricter (31.6%) policies, offering choices for different guest needs.
Recommendations for Hosts
- Consider adopting a Moderate policy to align with the 47.4% market standard in Hammarland.
- Regularly review your cancellation policy against competitors and market demand shifts in Hammarland.
Hammarland STR Booking Lead Time Analysis (2026)
Average Booking Lead Time by Month
Booking Lead Time Insights for Hammarland
- The overall average booking lead time for vacation rentals in Hammarland is 58 days.
- Guests book furthest in advance for stays during November (average 236 days), likely coinciding with peak travel demand or local events.
- The shortest booking windows occur for stays in December (average 0 days), indicating more last-minute travel plans during this time.
- Seasonally, Fall (107 days avg.) sees the longest lead times, while Winter (26 days avg.) has the shortest, reflecting typical travel planning cycles.
Recommendations for Hosts
- Use the overall average lead time (58 days) as a baseline for your pricing and availability strategy in Hammarland.
- For November stays, consider implementing length-of-stay discounts or slightly higher rates for bookings made less than 236 days out to capitalize on advance planning.
- During December, focus on last-minute booking availability and promotions, as guests book with very short notice (0 days avg.).
- Target marketing efforts for the Fall season well in advance (at least 107 days) to capture early planners.
- Monitor your own booking lead times against these Hammarland averages to identify opportunities for dynamic pricing adjustments.
Popular & Essential Airbnb Amenities in Hammarland (2026)
Amenity Prevalence
Amenity Insights for Hammarland
- Popular amenities like Kitchen, Free parking on premises, BBQ grill are common but not universal. Offering these can provide a competitive edge.
Recommendations for Hosts
- Consider adding popular differentiators like Kitchen or Free parking on premises to increase appeal.
- Highlight unique or less common amenities you offer (e.g., hot tub, dedicated workspace, EV charger) in your listing description and photos.
- Regularly check competitor amenities in Hammarland to stay competitive.
Hammarland Airbnb Guest Demographics & Profile Analysis (2026)
Guest Profile Summary for Hammarland
- The typical guest profile for Airbnb in Hammarland consists of a mix of domestic (46%) and international guests, with top international origins including Sweden, typically belonging to the Post-2000s (Gen Z/Alpha) group (50%), primarily speaking English or Finnish.
- Domestic travelers account for 46.2% of guests.
- Key international markets include Finland (46.2%) and Sweden (26.9%).
- Top languages spoken are English (35.7%) followed by Finnish (19%).
- A significant demographic segment is the Post-2000s (Gen Z/Alpha) group, representing 50% of guests.
Recommendations for Hosts
- Balance marketing efforts between domestic and international channels based on the guest mix.
- Tailor amenities and listing descriptions to appeal to the dominant Post-2000s (Gen Z/Alpha) demographic (e.g., highlight fast WiFi, smart home features, local guides).
- Highlight unique local experiences or amenities relevant to the primary guest profile.
- Consider seasonal promotions aligned with peak travel times for key origin markets.
Nearby Short-Term Rental Market Comparison
How does the Hammarland Airbnb market stack up against its neighbors? Compare key performance metrics like average monthly revenue, ADR, and occupancy rates in surrounding areas to understand the broader regional STR landscape.
| Market | Active Properties | Monthly Revenue | Daily Rate | Avg. Occupancy |
|---|---|---|---|---|
| Kungsholmen | 11 | $3,003 | $223.65 | 64% |
| Sandhamn | 13 | $2,743 | $342.42 | 47% |
| Skärmarö | 15 | $2,633 | $358.25 | 35% |
| Vaxholms kommun | 16 | $2,471 | $378.98 | 39% |
| Älgö | 38 | $2,317 | $382.14 | 43% |
| Brevikshalvön | 12 | $2,297 | $191.19 | 48% |
| Tyresö kommun | 48 | $2,244 | $269.17 | 45% |
| Hemmesta | 25 | $2,168 | $296.15 | 46% |
| Björkås | 14 | $2,153 | $308.59 | 39% |
| Räknäs | 18 | $2,142 | $383.48 | 42% |