Chamonix Airbnb Market Analysis 2026: Short Term Rental Data & Vacation Rental Statistics in Auvergne-Rhône-Alpes, France
Is Airbnb profitable in Chamonix in 2026? Explore comprehensive Airbnb analytics for Chamonix, Auvergne-Rhône-Alpes, France to uncover income potential. This 2026 STR market report for Chamonix, based on AirROI data from February 2025 to January 2026, reveals key trends in the niche market of 93 active listings.
Whether you're considering an Airbnb investment in Chamonix, optimizing your existing vacation rental, or exploring rental arbitrage opportunities, understanding the Chamonix Airbnb data is crucial. Navigating the high regulation landscape is key to maximizing your short term rental income potential. Let's dive into the specifics.
Key Chamonix Airbnb Performance Metrics Overview
Monthly Airbnb Revenue Variations & Income Potential in Chamonix (2026)
Understanding the monthly revenue variations for Airbnb listings in Chamonix is key to maximizing your short term rental income potential. Seasonality significantly impacts earnings. Our analysis, based on data from the past 12 months, shows that the peak revenue month for STRs in Chamonix is typically August, while May often presents the lowest earnings, highlighting opportunities for strategic pricing adjustments during shoulder and low seasons. Explore the typical Airbnb income in Chamonix across different performance tiers:
- Best-in-class properties (Top 10%) achieve $7,647+ monthly, often utilizing dynamic pricing and superior guest experiences.
- Strong performing properties (Top 25%) earn $4,591 or more, indicating effective management and desirable locations/amenities.
- Typical properties (Median) generate around $2,547 per month, representing the average market performance.
- Entry-level properties (Bottom 25%) see earnings around $1,365, often with potential for optimization.
Average Monthly Airbnb Earnings Trend in Chamonix
Chamonix Airbnb Occupancy Rate Trends (2026)
Maximize your bookings by understanding the Chamonix STR occupancy trends. Seasonal demand shifts significantly influence how often properties are booked. Typically, Augustsees the highest demand (peak season occupancy), while May experiences the lowest (low season). Effective strategies, like adjusting minimum stays or offering promotions, can boost occupancy during slower periods. Here's how different property tiers perform in Chamonix:
- Best-in-class properties (Top 10%) achieve 69%+ occupancy, indicating high desirability and potentially optimized availability.
- Strong performing properties (Top 25%) maintain 57% or higher occupancy, suggesting good market fit and guest satisfaction.
- Typical properties (Median) have an occupancy rate around 39%.
- Entry-level properties (Bottom 25%) average 24% occupancy, potentially facing higher vacancy.
Average Monthly Occupancy Rate Trend in Chamonix
Average Daily Rate (ADR) Airbnb Trends in Chamonix (2026)
Effective short term rental pricing strategy in Chamonix involves understanding monthly ADR fluctuations. The Average Daily Rate (ADR) for Airbnb in Chamonix typically peaks in January and dips lowest during September. Leveraging Airbnb dynamic pricing tools or strategies based on this seasonality can significantly boost revenue. Here's a look at the typical nightly rates achieved:
- Best-in-class properties (Top 10%) command rates of $559+ per night, often due to premium features or locations.
- Strong performing properties (Top 25%) achieve nightly rates of $371 or more.
- Typical properties (Median) charge around $205 per night.
- Entry-level properties (Bottom 25%) earn around $142 per night.
Average Daily Rate (ADR) Trend by Month in Chamonix
Get Live Chamonix Market Intelligence 👇
Explore Real-time Analytics
Airbnb Seasonality Analysis & Trends in Chamonix (2026)
Peak Season (August, July, January)
- Revenue averages $5,358 per month
- Occupancy rates average 58.2%
- Daily rates average $309
Shoulder Season
- Revenue averages $2,758 per month
- Occupancy maintains around 33.0%
- Daily rates hold near $306
Low Season (February, March, April)
- Revenue drops to average $0 per month
- Occupancy decreases to average 0.0%
- Daily rates adjust to average $297
Seasonality Insights for Chamonix
- The Airbnb seasonality in Chamonix shows highly seasonal trends requiring careful strategy. While the sections above show seasonal averages, it's also insightful to look at the extremes:
- During the high season, the absolute peak month showcases Chamonix's highest earning potential, with monthly revenues capable of climbing to $6,425, occupancy reaching a high of 72.4%, and ADRs peaking at $351.
- Conversely, the slowest single month of the year, typically falling within the low season, marks the market's lowest point. In this month, revenue might dip to $0, occupancy could drop to 0.0%, and ADRs may adjust down to $272.
- Understanding both the seasonal averages and these monthly peaks and troughs in revenue, occupancy, and ADR is crucial for maximizing your Airbnb profit potential in Chamonix.
Seasonal Strategies for Maximizing Profit
- Peak Season: Maximize revenue through premium pricing and potentially longer minimum stays. Ensure high availability.
- Low Season: Offer competitive pricing, special promotions (e.g., extended stay discounts), and flexible cancellation policies. Target off-season travelers like remote workers or budget-conscious guests.
- Shoulder Seasons: Implement dynamic pricing that balances peak and low rates. Target weekend travelers or specific events. Offer slightly more flexible terms than peak season.
- Regularly analyze your own performance against these Chamonix seasonality benchmarks and adjust your pricing and availability strategy accordingly.
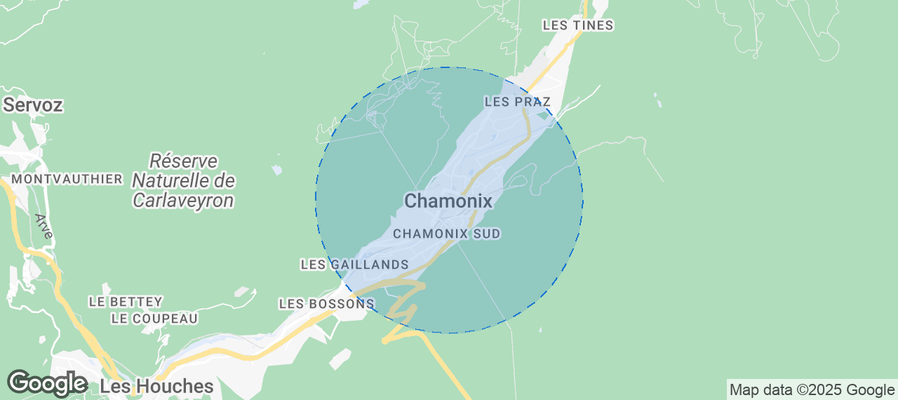
Best Areas for Airbnb Investment in Chamonix (2026)
Exploring the top neighborhoods for short-term rentals in Chamonix? This section highlights key areas, outlining why they are attractive for hosts and guests, along with notable local attractions. Consider these locations based on your target guest profile and investment strategy.
| Neighborhood / Area | Why Host Here? (Target Guests & Appeal) | Key Attractions & Landmarks |
|---|---|---|
| Chamonix Centre | The heart of Chamonix, filled with shops, restaurants, and close to the highest peaks. It's a hub for tourists seeking easy access to the mountains and nightlife. | Mont Blanc, Aiguille du Midi, Chamonix Alpine Museum, Parc de Loisirs de Chamonix, Boutique shops, Restaurants |
| Les Houches | A charming village near Chamonix, popular for its family-friendly ski resorts and hiking trails. Great for those seeking a quieter, more local experience while still close to Chamonix. | Les Houches Ski Resort, Mont Blanc Mountain, Lac de Servoz, Hiking trails, Local restaurants |
| Argentiere | A picturesque village that’s popular among serious skiers and hikers, known for its stunning landscapes and access to the backcountry skiing routes. | Argentiere Glacier, Chamonix Golf Club, Les Granges, Aiguille des Granges, Hiking trails |
| Les Praz | A quaint village situated along the river, with breathtaking views of the mountains, ideal for those looking to relax in nature without straying far from the Chamonix action. | Golf de Chamonix, Flegere Ski Area, Chalet restaurants, Nature walks, Scenic viewpoints |
| Servoz | A serene village located just outside Chamonix, perfect for mountain lovers who want access to nature and the stunning views of the Mont Blanc massif. | Les Gorges de la Diosaz, Nature trails, Local artisan shops, Viewpoints, Peaceful surroundings |
| Les Bossons | Known for its glacier and beautiful views of Mont Blanc, it's a great spot for visitors who want proximity to Chamonix but with a more serene atmosphere. | Bossons Glacier, Hiking trails, Local cafes, Mountain views, Nature parks |
| Vallorcine | A quiet and traditional mountain village at the end of the Chamonix valley, known for its stunning nature and access to ski resorts, suitable for those seeking tranquility. | Vallée de l'Arve, Skiing, Hiking routes, Local wildlife, Traditional architecture |
| Montroc | A small hamlet that boasts gorgeous mountain views and easy access to hiking and skiing, great for visitors looking for a peaceful retreat close to Chamonix. | Nature trails, Skiing opportunities, Scenic spots, Cozy lodges, Artisan shops |
Understanding Airbnb License Requirements & STR Laws in Chamonix (2026)
Yes, Chamonix, Auvergne-Rhône-Alpes, France enforces high STR regulations. Obtaining a license and ensuring compliance is almost certainly required according to current 2026 STR laws. Always verify the latest short term rental regulations and Airbnb license requirements directly with local government authorities for Chamonix to ensure full compliance before hosting.
(Source: AirROI data, 2026, based on 92% licensed listings)
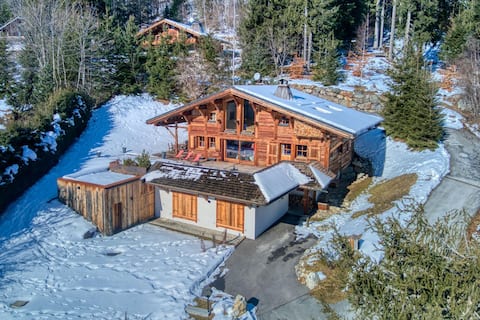
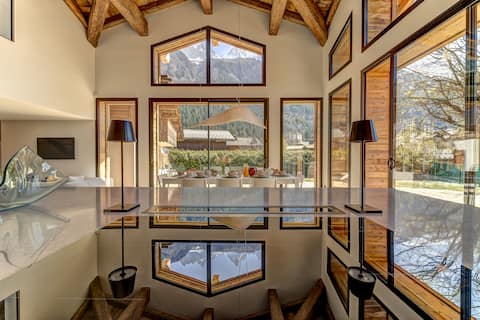
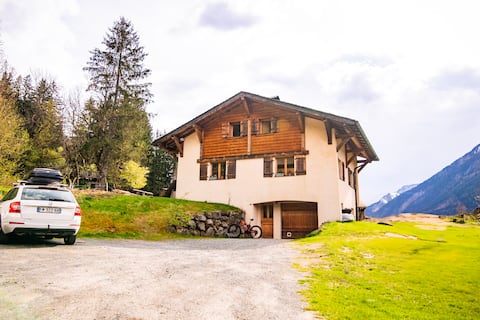
Top Performing Airbnb Properties in Chamonix (2026)
Benchmark your potential! Explore examples of top-performing Airbnb properties in Chamonixbased on Trailing Twelve Month (TTM) revenue. Analyze their characteristics, revenue, occupancy rate, and ADR to understand what drives success in this market.
Chalet Foret Rouge
Entire Place • 7 bedrooms
Chalet Fortuna, a jewel in central Chamonix
Entire Place • 4 bedrooms

Chalet Les Grands Montets - Chamonix Holidays
Entire Place • 4 bedrooms
Le Paradis Chalet
Entire Place • 4 bedrooms
A real favorite in Chamonix Mont-Blanc
Entire Place • 4 bedrooms

Chalet 500m Flégère | Fireplace | Garden 180° View
Entire Place • 4 bedrooms
Note: Performance varies based on location, size, amenities, seasonality, and management quality. Data reflects the past 12 months.
Top Performing Airbnb Hosts in Chamonix (2026)
Learn from the best! This table showcases top-performing Airbnb hosts in Chamonix based on the number of properties managed and estimated total revenue over the past year. Analyze their scale and performance metrics.
| Host Name | Properties | Grossing Revenue | Stay Reviews | Avg Rating |
|---|---|---|---|---|
| Mana Homes | 9 | $341,863 | 152 | 4.76/5.0 |
| Chamonix Resort | 6 | $253,311 | 29 | 4.91/5.0 |
| Collineige | 3 | $167,723 | 13 | 4.79/5.0 |
| Bruno | 1 | $118,405 | 1 | Not Rated |
| Chamonix Holidays | 1 | $109,602 | 3 | 5.00/5.0 |
| Care Concierge | 6 | $106,651 | 29 | 4.52/5.0 |
| Ana | 3 | $105,940 | 47 | 4.89/5.0 |
| Mark | 9 | $94,345 | 26 | 4.47/5.0 |
| Mireille | 2 | $89,319 | 14 | 5.00/5.0 |
| Alpes | 2 | $87,192 | 12 | 5.00/5.0 |
Analyzing the strategies of top hosts, such as their property selection, pricing, and guest communication, can offer valuable lessons for optimizing your own Airbnb operations in Chamonix.
Dive Deeper: Advanced Chamonix STR Market Data (2026)
Ready to unlock more insights? AirROI provides access to advanced metrics and comprehensive Airbnb data for Chamonix. Explore detailed analytics beyond this report to refine your investment strategy, optimize pricing, and maximize your vacation rental profits.
Explore Advanced MetricsChamonix Short-Term Rental Market Composition (2026): Property & Room Types
Room Type Distribution
Property Type Distribution
Market Composition Insights for Chamonix
- The Chamonix Airbnb market composition is heavily skewed towards Entire Home/Apt listings, which make up 94.6% of the 93 active rentals. This indicates strong guest preference for privacy and space.
- Looking at the property type distribution in Chamonix, Apartment/Condo properties are the most common (76.3%), reflecting the local real estate landscape.
- Houses represent a significant 18.3% portion, catering likely to families or larger groups.
- Smaller segments like hotel/boutique, outdoor/unique (combined 5.4%) offer potential for unique stay experiences.
Chamonix Airbnb Room Capacity Analysis (2026): Bedroom Distribution
Distribution of Listings by Number of Bedrooms
Room Capacity Insights for Chamonix
- The dominant room capacity in Chamonix is 2 bedrooms listings, making up 31.2% of the market. This suggests a strong demand for properties suitable for couples or solo travelers.
- Together, 2 bedrooms and 1 bedroom properties represent 59.2% of the active Airbnb listings in Chamonix, indicating a high concentration in these sizes.
- A significant 30.1% of listings offer 3+ bedrooms, catering to larger groups and families seeking more space in Chamonix.
Chamonix Vacation Rental Guest Capacity Trends (2026)
Distribution of Listings by Guest Capacity
Guest Capacity Insights for Chamonix
- The most common guest capacity trend in Chamonix vacation rentals is listings accommodating 4 guests (31.2%). This suggests the primary traveler segment is likely small families or groups.
- Properties designed for 4 guests and 8+ guests dominate the Chamonix STR market, accounting for 51.6% of listings.
- 38.7% of properties accommodate 6+ guests, serving the market segment for larger families or group travel in Chamonix.
- On average, properties in Chamonix are equipped to host 4.7 guests.
Chamonix Airbnb Booking Patterns (2026): Available vs. Booked Days
Available Days Distribution
Booked Days Distribution
Booking Pattern Insights for Chamonix
- The most common availability pattern in Chamonix falls within the 181-270 days range, representing 51.6% of listings. This suggests many properties have significant open periods on their calendars.
- Approximately 97.8% of listings show high availability (181+ days open annually), indicating potential for increased bookings or specific owner usage patterns.
- For booked days, the 91-180 days range is most frequent in Chamonix (51.6%), reflecting common guest stay durations or potential owner blocking patterns.
- A notable 2.2% of properties secure long booking periods (181+ days booked per year), highlighting successful long-term rental strategies or significant owner usage.
Chamonix Airbnb Minimum Stay Requirements Analysis
Distribution of Listings by Minimum Night Requirement
1 Night
6 listings
6.5% of total
2 Nights
7 listings
7.5% of total
3 Nights
7 listings
7.5% of total
4-6 Nights
9 listings
9.7% of total
7-29 Nights
2 listings
2.2% of total
30+ Nights
62 listings
66.7% of total
Key Insights
- The most prevalent minimum stay requirement in Chamonix is 30+ Nights, adopted by 66.7% of listings. This highlights the market's preference for longer commitments.
- Very short stays (1-2 nights) are less common (14.0%), suggesting hosts prefer slightly longer bookings to optimize turnover.
- A significant segment (66.7%) caters to monthly stays (30+ nights) in Chamonix, pointing to opportunities in the extended-stay market.
Recommendations
- Align with the market by considering a 30+ Nights minimum stay, as 66.7% of Chamonix hosts use this setting.
- If feasible, allowing 1-night stays, especially midweek or during low season, could capture last-minute bookings, as only 6.5% currently do.
- Explore offering discounts for stays of 30+ nights to attract the 66.7% of the market seeking extended stays.
- Adjust minimum nights based on seasonality – potentially shorter during low season and longer during peak demand periods in Chamonix.
Chamonix Airbnb Cancellation Policy Trends Analysis (2026)
Limited
10 listings
10.8% of total
Super Strict 30 Days
2 listings
2.2% of total
Super Strict 60 Days
1 listings
1.1% of total
Refundable
1 listings
1.1% of total
Flexible
8 listings
8.6% of total
Moderate
11 listings
11.8% of total
Firm
52 listings
55.9% of total
Strict
8 listings
8.6% of total
Cancellation Policy Insights for Chamonix
- The prevailing Airbnb cancellation policy trend in Chamonix is Firm, used by 55.9% of listings.
- A majority (64.5%) of hosts in Chamonix utilize Firm or Strict policies, indicating a market where hosts prioritize booking security.
- Strict cancellation policies are quite rare (8.6%), potentially making listings with this policy less competitive unless justified by high demand or property type.
Recommendations for Hosts
- Consider adopting a Firm policy to align with the 55.9% market standard in Chamonix.
- Using a Strict policy might deter some guests, as only 8.6% of listings use it. Evaluate if potential revenue protection outweighs possible lower booking rates.
- Regularly review your cancellation policy against competitors and market demand shifts in Chamonix.
Chamonix STR Booking Lead Time Analysis (2026)
Average Booking Lead Time by Month
Booking Lead Time Insights for Chamonix
- The overall average booking lead time for vacation rentals in Chamonix is 37 days.
- Guests book furthest in advance for stays during January (average 52 days), likely coinciding with peak travel demand or local events.
- The shortest booking windows occur for stays in April (average 0 days), indicating more last-minute travel plans during this time.
- Seasonally, Fall (32 days avg.) sees the longest lead times, while Spring (1 days avg.) has the shortest, reflecting typical travel planning cycles.
Recommendations for Hosts
- Use the overall average lead time (37 days) as a baseline for your pricing and availability strategy in Chamonix.
- For January stays, consider implementing length-of-stay discounts or slightly higher rates for bookings made less than 52 days out to capitalize on advance planning.
- During April, focus on last-minute booking availability and promotions, as guests book with very short notice (0 days avg.).
- Target marketing efforts for the Fall season well in advance (at least 32 days) to capture early planners.
- Monitor your own booking lead times against these Chamonix averages to identify opportunities for dynamic pricing adjustments.
Popular & Essential Airbnb Amenities in Chamonix (2026)
Amenity Prevalence
Amenity Insights for Chamonix
- Popular amenities like Kitchen, Heating, Wifi are common but not universal. Offering these can provide a competitive edge.
- Warning: Wifi is not universally provided but is considered essential globally. Ensure reliable Wifi is offered.
Recommendations for Hosts
- Consider adding popular differentiators like Kitchen or Heating to increase appeal.
- Highlight unique or less common amenities you offer (e.g., hot tub, dedicated workspace, EV charger) in your listing description and photos.
- Regularly check competitor amenities in Chamonix to stay competitive.
Chamonix Airbnb Guest Demographics & Profile Analysis (2026)
Guest Profile Summary for Chamonix
- The typical guest profile for Airbnb in Chamonix consists of predominantly international visitors (68%), with top international origins including United States, typically belonging to the Post-2000s (Gen Z/Alpha) group (50%), primarily speaking English or French.
- Domestic travelers account for 32.1% of guests.
- Key international markets include France (32.1%) and United States (18.6%).
- Top languages spoken are English (41.3%) followed by French (23.2%).
- A significant demographic segment is the Post-2000s (Gen Z/Alpha) group, representing 50% of guests.
Recommendations for Hosts
- Focus marketing internationally, particularly towards travelers from United States.
- Tailor amenities and listing descriptions to appeal to the dominant Post-2000s (Gen Z/Alpha) demographic (e.g., highlight fast WiFi, smart home features, local guides).
- Highlight unique local experiences or amenities relevant to the primary guest profile.
- Consider seasonal promotions aligned with peak travel times for key origin markets.
Nearby Short-Term Rental Market Comparison
How does the Chamonix Airbnb market stack up against its neighbors? Compare key performance metrics like average monthly revenue, ADR, and occupancy rates in surrounding areas to understand the broader regional STR landscape.
| Market | Active Properties | Monthly Revenue | Daily Rate | Avg. Occupancy |
|---|---|---|---|---|
| Niederried bei Interlaken | 19 | $6,267 | $552.03 | 44% |
| Lauterbrunnen | 552 | $6,108 | $487.83 | 51% |
| Matten bei Interlaken | 64 | $5,607 | $336.51 | 59% |
| Les Clefs | 34 | $5,585 | $314.08 | 47% |
| Monteu Roero | 12 | $5,184 | $403.07 | 41% |
| Wengen | 12 | $5,115 | $595.38 | 46% |
| Oberhofen am Thunersee | 25 | $5,051 | $329.28 | 51% |
| Zermatt | 792 | $5,017 | $504.14 | 46% |
| Interlaken | 346 | $4,947 | $399.71 | 53% |
| Bönigen | 35 | $4,848 | $288.51 | 65% |