Nébouzat Airbnb Market Analysis 2026: Short Term Rental Data & Vacation Rental Statistics in Auvergne-Rhône-Alpes, France
Is Airbnb profitable in Nébouzat in 2026? Explore comprehensive Airbnb analytics for Nébouzat, Auvergne-Rhône-Alpes, France to uncover income potential. This 2026 STR market report for Nébouzat, based on AirROI data from February 2025 to January 2026, reveals key trends in the niche market of 33 active listings.
Whether you're considering an Airbnb investment in Nébouzat, optimizing your existing vacation rental, or exploring rental arbitrage opportunities, understanding the Nébouzat Airbnb data is crucial. Understanding the local regulations is key to maximizing your short term rental income potential. Let's dive into the specifics.
Key Nébouzat Airbnb Performance Metrics Overview
Monthly Airbnb Revenue Variations & Income Potential in Nébouzat (2026)
Understanding the monthly revenue variations for Airbnb listings in Nébouzat is key to maximizing your short term rental income potential. Seasonality significantly impacts earnings. Our analysis, based on data from the past 12 months, shows that the peak revenue month for STRs in Nébouzat is typically August, while January often presents the lowest earnings, highlighting opportunities for strategic pricing adjustments during shoulder and low seasons. Explore the typical Airbnb income in Nébouzat across different performance tiers:
- Best-in-class properties (Top 10%) achieve $3,123+ monthly, often utilizing dynamic pricing and superior guest experiences.
- Strong performing properties (Top 25%) earn $1,926 or more, indicating effective management and desirable locations/amenities.
- Typical properties (Median) generate around $1,161 per month, representing the average market performance.
- Entry-level properties (Bottom 25%) see earnings around $721, often with potential for optimization.
Average Monthly Airbnb Earnings Trend in Nébouzat
Nébouzat Airbnb Occupancy Rate Trends (2026)
Maximize your bookings by understanding the Nébouzat STR occupancy trends. Seasonal demand shifts significantly influence how often properties are booked. Typically, Augustsees the highest demand (peak season occupancy), while January experiences the lowest (low season). Effective strategies, like adjusting minimum stays or offering promotions, can boost occupancy during slower periods. Here's how different property tiers perform in Nébouzat:
- Best-in-class properties (Top 10%) achieve 76%+ occupancy, indicating high desirability and potentially optimized availability.
- Strong performing properties (Top 25%) maintain 60% or higher occupancy, suggesting good market fit and guest satisfaction.
- Typical properties (Median) have an occupancy rate around 42%.
- Entry-level properties (Bottom 25%) average 27% occupancy, potentially facing higher vacancy.
Average Monthly Occupancy Rate Trend in Nébouzat
Average Daily Rate (ADR) Airbnb Trends in Nébouzat (2026)
Effective short term rental pricing strategy in Nébouzat involves understanding monthly ADR fluctuations. The Average Daily Rate (ADR) for Airbnb in Nébouzat typically peaks in June and dips lowest during April. Leveraging Airbnb dynamic pricing tools or strategies based on this seasonality can significantly boost revenue. Here's a look at the typical nightly rates achieved:
- Best-in-class properties (Top 10%) command rates of $157+ per night, often due to premium features or locations.
- Strong performing properties (Top 25%) achieve nightly rates of $117 or more.
- Typical properties (Median) charge around $89 per night.
- Entry-level properties (Bottom 25%) earn around $67 per night.
Average Daily Rate (ADR) Trend by Month in Nébouzat
Get Live Nébouzat Market Intelligence 👇

Explore Real-time Analytics
Airbnb Seasonality Analysis & Trends in Nébouzat (2026)
Peak Season (August, July, October)
- Revenue averages $2,281 per month
- Occupancy rates average 64.8%
- Daily rates average $109
Shoulder Season
- Revenue averages $1,461 per month
- Occupancy maintains around 43.1%
- Daily rates hold near $106
Low Season (January, March, November)
- Revenue drops to average $930 per month
- Occupancy decreases to average 25.7%
- Daily rates adjust to average $105
Seasonality Insights for Nébouzat
- The Airbnb seasonality in Nébouzat shows highly seasonal trends requiring careful strategy. While the sections above show seasonal averages, it's also insightful to look at the extremes:
- During the high season, the absolute peak month showcases Nébouzat's highest earning potential, with monthly revenues capable of climbing to $2,779, occupancy reaching a high of 78.9%, and ADRs peaking at $112.
- Conversely, the slowest single month of the year, typically falling within the low season, marks the market's lowest point. In this month, revenue might dip to $711, occupancy could drop to 19.8%, and ADRs may adjust down to $99.
- Understanding both the seasonal averages and these monthly peaks and troughs in revenue, occupancy, and ADR is crucial for maximizing your Airbnb profit potential in Nébouzat.
Seasonal Strategies for Maximizing Profit
- Peak Season: Maximize revenue through premium pricing and potentially longer minimum stays. Ensure high availability.
- Low Season: Offer competitive pricing, special promotions (e.g., extended stay discounts), and flexible cancellation policies. Target off-season travelers like remote workers or budget-conscious guests.
- Shoulder Seasons: Implement dynamic pricing that balances peak and low rates. Target weekend travelers or specific events. Offer slightly more flexible terms than peak season.
- Regularly analyze your own performance against these Nébouzat seasonality benchmarks and adjust your pricing and availability strategy accordingly.
Best Areas for Airbnb Investment in Nébouzat (2026)
Exploring the top neighborhoods for short-term rentals in Nébouzat? This section highlights key areas, outlining why they are attractive for hosts and guests, along with notable local attractions. Consider these locations based on your target guest profile and investment strategy.
| Neighborhood / Area | Why Host Here? (Target Guests & Appeal) | Key Attractions & Landmarks |
|---|---|---|
| Néboux | A charming village in the Auvergne region, known for its scenic landscapes and proximity to nature. Ideal for travelers looking for a peaceful retreat away from city life, with hiking and outdoor activities. | Château de Montaigut, Parc Naturel Régional des Volcans d'Auvergne, Lac de Servières, Puy de Dôme, Medieval Village of Veyre-Monton |
| Clermont-Ferrand | The capital of the Auvergne region, famous for its dark volcanic stone architecture and rich history. A bustling city with a vibrant cultural scene, attracting both tourists and business travelers. | Cathédrale Notre-Dame-de-l'Assomption, Vulcania, L'Aventure Michelin, Place de Jaude, Puy de Dôme |
| Issoire | A historical town known for its Romanesque church and scenic surroundings. Offers a laid-back atmosphere appealing to visitors interested in history and culinary delights. | Basilique Saint-Julien, Château de Parentignat, Local vineyards, Auvergne's gastronomic specialties, Nature walks |
| Mont-Dore | A ski resort town in the winter and a hiking destination in the summer, Mont-Dore is perfect for outdoor enthusiasts looking for year-round activities. | Puy de Sancy, Mont-Dore ski resort, Thermal baths, Hiking trails, Lac de Guery |
| La Bourboule | Known for its thermal spa and stunning views, La Bourboule attracts visitors looking for relaxation and health treatments. | Thermes de La Bourboule, Château de La Bourboule, Nature walks in the Dordogne Valley, Local artisan shops, Lake La Bourboule |
| Saint-Flour | A historic town perched on a volcanic plateau, Saint-Flour is attractive for its medieval architecture and breathtaking views. Great for travelers who appreciate history and nature. | Cathédrale de Saint-Flour, Viaduc de Garabit, Festival de Saint-Flour, Historic town center, Nearby hiking trails |
| Ambert | Famous for its cheese and charming countryside, Ambert is ideal for food lovers and those seeking a tranquil environment in the heart of rural France. | Maison de la Fourme d'Ambert, Historic mills, Local markets, Nature exploration, Nearby volcanoes |
| Châtel-Guyon | A well-known spa town, Châtel-Guyon offers wellness tourism and is popular during the summer for its parks and gardens, attracting guests seeking relaxation. | Parc thermal, Thermal baths, Historic gardens, Local wellness centers, Cultural events |
Understanding Airbnb License Requirements & STR Laws in Nébouzat (2026)
With 12% of listings showing registration in 2026, understanding potential Airbnb license requirements is crucial in Nébouzat. Always verify the latest short term rental regulations and Airbnb license requirements directly with local government authorities for Nébouzat to ensure full compliance before hosting.
(Source: AirROI data, 2026, based on 12% licensed listings)
Top Performing Airbnb Properties in Nébouzat (2026)
Benchmark your potential! Explore examples of top-performing Airbnb properties in Nébouzatbased on Trailing Twelve Month (TTM) revenue. Analyze their characteristics, revenue, occupancy rate, and ADR to understand what drives success in this market.
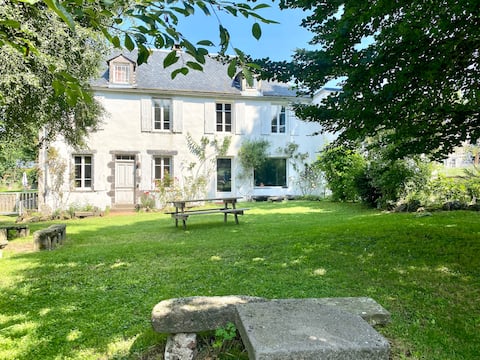
Family house with character (lamaisondurioux)
Entire Place • 9 bedrooms

A-frame Chalet – 4 pers. – Nordic bath – 2 bedrooms
Entire Place • 2 bedrooms

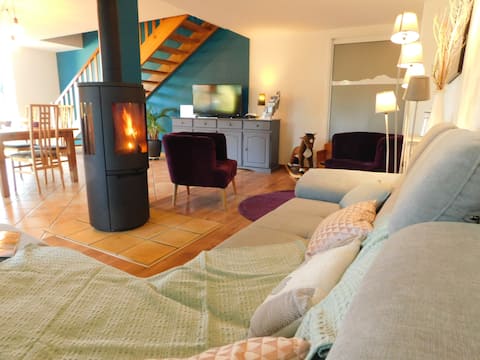
Wellness cottage spa private sauna Chaîne des Puys
Entire Place • 1 bedroom

Family vacation rental in the heart of the Volcanoes, 8 to 10 people
Entire Place • 1 bedroom
Charming cottage in the heart of the Auvergne Volcanoes 6 people
Entire Place • 3 bedrooms
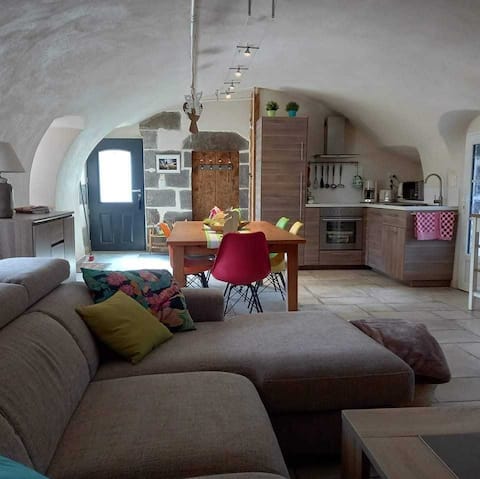
Beautiful atypical 17th century family gîte
Entire Place • 2 bedrooms
Note: Performance varies based on location, size, amenities, seasonality, and management quality. Data reflects the past 12 months.
Top Performing Airbnb Hosts in Nébouzat (2026)
Learn from the best! This table showcases top-performing Airbnb hosts in Nébouzat based on the number of properties managed and estimated total revenue over the past year. Analyze their scale and performance metrics.
| Host Name | Properties | Grossing Revenue | Stay Reviews | Avg Rating |
|---|---|---|---|---|
| Sophie Et Fernando | 3 | $112,099 | 319 | 4.98/5.0 |
| Marie | 3 | $72,993 | 118 | 4.87/5.0 |
| Bovet | 1 | $56,538 | 41 | 4.83/5.0 |
| Thierry | 3 | $32,854 | 538 | 4.92/5.0 |
| Marina | 1 | $22,125 | 86 | 4.98/5.0 |
| Pierre | 1 | $18,159 | 101 | 4.86/5.0 |
| Damien | 1 | $17,712 | 63 | 4.97/5.0 |
| Julien | 1 | $17,114 | 85 | 4.96/5.0 |
| Martine | 2 | $15,644 | 346 | 4.84/5.0 |
| Résa Gîtes | 1 | $15,527 | 4 | 4.75/5.0 |
Analyzing the strategies of top hosts, such as their property selection, pricing, and guest communication, can offer valuable lessons for optimizing your own Airbnb operations in Nébouzat.
Dive Deeper: Advanced Nébouzat STR Market Data (2026)
Ready to unlock more insights? AirROI provides access to advanced metrics and comprehensive Airbnb data for Nébouzat. Explore detailed analytics beyond this report to refine your investment strategy, optimize pricing, and maximize your vacation rental profits.
Explore Advanced MetricsNébouzat Short-Term Rental Market Composition (2026): Property & Room Types
Room Type Distribution
Property Type Distribution
Market Composition Insights for Nébouzat
- The Nébouzat Airbnb market composition is heavily skewed towards Entire Home/Apt listings, which make up 90.9% of the 33 active rentals. This indicates strong guest preference for privacy and space.
- Looking at the property type distribution in Nébouzat, House properties are the most common (63.6%), reflecting the local real estate landscape.
- Houses represent a significant 63.6% portion, catering likely to families or larger groups.
- The presence of 6.1% Hotel/Boutique listings indicates integration with traditional hospitality.
Nébouzat Airbnb Room Capacity Analysis (2026): Bedroom Distribution
Distribution of Listings by Number of Bedrooms
Room Capacity Insights for Nébouzat
- The dominant room capacity in Nébouzat is 1 bedroom listings, making up 48.5% of the market. This suggests a strong demand for properties suitable for couples or solo travelers.
- Together, 1 bedroom and 2 bedrooms properties represent 75.8% of the active Airbnb listings in Nébouzat, indicating a high concentration in these sizes.
Nébouzat Vacation Rental Guest Capacity Trends (2026)
Distribution of Listings by Guest Capacity
Guest Capacity Insights for Nébouzat
- The most common guest capacity trend in Nébouzat vacation rentals is listings accommodating 2 guests (30.3%). This suggests the primary traveler segment is likely couples or solo travelers.
- Properties designed for 2 guests and 4 guests dominate the Nébouzat STR market, accounting for 51.5% of listings.
- 27.3% of properties accommodate 6+ guests, serving the market segment for larger families or group travel in Nébouzat.
- On average, properties in Nébouzat are equipped to host 4.0 guests.
Nébouzat Airbnb Booking Patterns (2026): Available vs. Booked Days
Available Days Distribution
Booked Days Distribution
Booking Pattern Insights for Nébouzat
- The most common availability pattern in Nébouzat falls within the 181-270 days range, representing 42.4% of listings. This suggests many properties have significant open periods on their calendars.
- Approximately 69.7% of listings show high availability (181+ days open annually), indicating potential for increased bookings or specific owner usage patterns.
- For booked days, the 91-180 days range is most frequent in Nébouzat (42.4%), reflecting common guest stay durations or potential owner blocking patterns.
- A notable 33.4% of properties secure long booking periods (181+ days booked per year), highlighting successful long-term rental strategies or significant owner usage.
Nébouzat Airbnb Minimum Stay Requirements Analysis
Distribution of Listings by Minimum Night Requirement
1 Night
4 listings
12.1% of total
2 Nights
7 listings
21.2% of total
3 Nights
2 listings
6.1% of total
4-6 Nights
5 listings
15.2% of total
30+ Nights
15 listings
45.5% of total
Key Insights
- The most prevalent minimum stay requirement in Nébouzat is 30+ Nights, adopted by 45.5% of listings. This highlights the market's preference for longer commitments.
- A significant segment (45.5%) caters to monthly stays (30+ nights) in Nébouzat, pointing to opportunities in the extended-stay market.
Recommendations
- Align with the market by considering a 30+ Nights minimum stay, as 45.5% of Nébouzat hosts use this setting.
- If feasible, allowing 1-night stays, especially midweek or during low season, could capture last-minute bookings, as only 12.1% currently do.
- Explore offering discounts for stays of 30+ nights to attract the 45.5% of the market seeking extended stays.
- Adjust minimum nights based on seasonality – potentially shorter during low season and longer during peak demand periods in Nébouzat.
Nébouzat Airbnb Cancellation Policy Trends Analysis (2026)
Limited
1 listings
3% of total
Flexible
5 listings
15.2% of total
Moderate
16 listings
48.5% of total
Firm
7 listings
21.2% of total
Strict
4 listings
12.1% of total
Cancellation Policy Insights for Nébouzat
- The prevailing Airbnb cancellation policy trend in Nébouzat is Moderate, used by 48.5% of listings.
- There's a relatively balanced mix between guest-friendly (63.7%) and stricter (33.3%) policies, offering choices for different guest needs.
Recommendations for Hosts
- Consider adopting a Moderate policy to align with the 48.5% market standard in Nébouzat.
- Using a Strict policy might deter some guests, as only 12.1% of listings use it. Evaluate if potential revenue protection outweighs possible lower booking rates.
- Regularly review your cancellation policy against competitors and market demand shifts in Nébouzat.
Nébouzat STR Booking Lead Time Analysis (2026)
Average Booking Lead Time by Month
Booking Lead Time Insights for Nébouzat
- The overall average booking lead time for vacation rentals in Nébouzat is 69 days.
- Guests book furthest in advance for stays during August (average 117 days), likely coinciding with peak travel demand or local events.
- The shortest booking windows occur for stays in January (average 28 days), indicating more last-minute travel plans during this time.
- Seasonally, Summer (98 days avg.) sees the longest lead times, while Winter (33 days avg.) has the shortest, reflecting typical travel planning cycles.
Recommendations for Hosts
- Use the overall average lead time (69 days) as a baseline for your pricing and availability strategy in Nébouzat.
- For August stays, consider implementing length-of-stay discounts or slightly higher rates for bookings made less than 117 days out to capitalize on advance planning.
- Target marketing efforts for the Summer season well in advance (at least 98 days) to capture early planners.
- Monitor your own booking lead times against these Nébouzat averages to identify opportunities for dynamic pricing adjustments.
Popular & Essential Airbnb Amenities in Nébouzat (2026)
Amenity Prevalence
Amenity Insights for Nébouzat
- Popular amenities like Free parking on premises, Kitchen, Heating are common but not universal. Offering these can provide a competitive edge.
Recommendations for Hosts
- Consider adding popular differentiators like Free parking on premises or Kitchen to increase appeal.
- Highlight unique or less common amenities you offer (e.g., hot tub, dedicated workspace, EV charger) in your listing description and photos.
- Regularly check competitor amenities in Nébouzat to stay competitive.
Nébouzat Airbnb Guest Demographics & Profile Analysis (2026)
Guest Profile Summary for Nébouzat
- The typical guest profile for Airbnb in Nébouzat consists of primarily domestic travelers (92%), often arriving from nearby Paris, typically belonging to the Post-2000s (Gen Z/Alpha) group (50%), primarily speaking French or English.
- Domestic travelers account for 92.2% of guests.
- Key international markets include France (92.2%) and Belgium (1.7%).
- Top languages spoken are French (50.2%) followed by English (34.4%).
- A significant demographic segment is the Post-2000s (Gen Z/Alpha) group, representing 50% of guests.
Recommendations for Hosts
- Target domestic marketing efforts towards travelers from Paris and Lyon.
- Tailor amenities and listing descriptions to appeal to the dominant Post-2000s (Gen Z/Alpha) demographic (e.g., highlight fast WiFi, smart home features, local guides).
- Highlight unique local experiences or amenities relevant to the primary guest profile.
- Consider seasonal promotions aligned with peak travel times for key origin markets.
Nearby Short-Term Rental Market Comparison
How does the Nébouzat Airbnb market stack up against its neighbors? Compare key performance metrics like average monthly revenue, ADR, and occupancy rates in surrounding areas to understand the broader regional STR landscape.
| Market | Active Properties | Monthly Revenue | Daily Rate | Avg. Occupancy |
|---|---|---|---|---|
| La Dornac | 10 | $2,407 | $288.14 | 32% |
| Saint-Pierre-Roche | 13 | $2,307 | $184.10 | 45% |
| La Roque-Gageac | 41 | $2,103 | $197.21 | 49% |
| Souvigny | 25 | $2,092 | $231.41 | 36% |
| Montaigut-le-Blanc | 17 | $2,062 | $158.88 | 43% |
| Saint-Victor-la-Rivière | 22 | $1,995 | $168.74 | 42% |
| Saint-Sauveur-Camprieu | 15 | $1,955 | $217.34 | 37% |
| Saint-Parize-le-Châtel | 12 | $1,906 | $176.31 | 32% |
| Menat | 16 | $1,899 | $165.53 | 36% |
| Saumane | 10 | $1,893 | $175.90 | 45% |