Beaufort Airbnb Market Analysis 2026: Short Term Rental Data & Vacation Rental Statistics in Auvergne-Rhône-Alpes, France
Is Airbnb profitable in Beaufort in 2026? Explore comprehensive Airbnb analytics for Beaufort, Auvergne-Rhône-Alpes, France to uncover income potential. This 2026 STR market report for Beaufort, based on AirROI data from February 2025 to January 2026, reveals key trends in the market of 255 active listings.
Whether you're considering an Airbnb investment in Beaufort, optimizing your existing vacation rental, or exploring rental arbitrage opportunities, understanding the Beaufort Airbnb data is crucial. Leveraging the low regulation environment is key to maximizing your short term rental income potential. Let's dive into the specifics.
Key Beaufort Airbnb Performance Metrics Overview
Monthly Airbnb Revenue Variations & Income Potential in Beaufort (2026)
Understanding the monthly revenue variations for Airbnb listings in Beaufort is key to maximizing your short term rental income potential. Seasonality significantly impacts earnings. Our analysis, based on data from the past 12 months, shows that the peak revenue month for STRs in Beaufort is typically February, while June often presents the lowest earnings, highlighting opportunities for strategic pricing adjustments during shoulder and low seasons. Explore the typical Airbnb income in Beaufort across different performance tiers:
- Best-in-class properties (Top 10%) achieve $3,309+ monthly, often utilizing dynamic pricing and superior guest experiences.
- Strong performing properties (Top 25%) earn $2,033 or more, indicating effective management and desirable locations/amenities.
- Typical properties (Median) generate around $1,108 per month, representing the average market performance.
- Entry-level properties (Bottom 25%) see earnings around $480, often with potential for optimization.
Average Monthly Airbnb Earnings Trend in Beaufort
Beaufort Airbnb Occupancy Rate Trends (2026)
Maximize your bookings by understanding the Beaufort STR occupancy trends. Seasonal demand shifts significantly influence how often properties are booked. Typically, Februarysees the highest demand (peak season occupancy), while June experiences the lowest (low season). Effective strategies, like adjusting minimum stays or offering promotions, can boost occupancy during slower periods. Here's how different property tiers perform in Beaufort:
- Best-in-class properties (Top 10%) achieve 70%+ occupancy, indicating high desirability and potentially optimized availability.
- Strong performing properties (Top 25%) maintain 51% or higher occupancy, suggesting good market fit and guest satisfaction.
- Typical properties (Median) have an occupancy rate around 27%.
- Entry-level properties (Bottom 25%) average 11% occupancy, potentially facing higher vacancy.
Average Monthly Occupancy Rate Trend in Beaufort
Average Daily Rate (ADR) Airbnb Trends in Beaufort (2026)
Effective short term rental pricing strategy in Beaufort involves understanding monthly ADR fluctuations. The Average Daily Rate (ADR) for Airbnb in Beaufort typically peaks in January and dips lowest during August. Leveraging Airbnb dynamic pricing tools or strategies based on this seasonality can significantly boost revenue. Here's a look at the typical nightly rates achieved:
- Best-in-class properties (Top 10%) command rates of $281+ per night, often due to premium features or locations.
- Strong performing properties (Top 25%) achieve nightly rates of $174 or more.
- Typical properties (Median) charge around $120 per night.
- Entry-level properties (Bottom 25%) earn around $92 per night.
Average Daily Rate (ADR) Trend by Month in Beaufort
Get Live Beaufort Market Intelligence 👇

Explore Real-time Analytics
Airbnb Seasonality Analysis & Trends in Beaufort (2026)
Peak Season (February, August, July)
- Revenue averages $2,321 per month
- Occupancy rates average 49.8%
- Daily rates average $149
Shoulder Season
- Revenue averages $1,397 per month
- Occupancy maintains around 30.1%
- Daily rates hold near $157
Low Season (April, May, June)
- Revenue drops to average $959 per month
- Occupancy decreases to average 23.0%
- Daily rates adjust to average $142
Seasonality Insights for Beaufort
- The Airbnb seasonality in Beaufort shows highly seasonal trends requiring careful strategy. While the sections above show seasonal averages, it's also insightful to look at the extremes:
- During the high season, the absolute peak month showcases Beaufort's highest earning potential, with monthly revenues capable of climbing to $3,054, occupancy reaching a high of 57.7%, and ADRs peaking at $172.
- Conversely, the slowest single month of the year, typically falling within the low season, marks the market's lowest point. In this month, revenue might dip to $810, occupancy could drop to 19.7%, and ADRs may adjust down to $139.
- Understanding both the seasonal averages and these monthly peaks and troughs in revenue, occupancy, and ADR is crucial for maximizing your Airbnb profit potential in Beaufort.
Seasonal Strategies for Maximizing Profit
- Peak Season: Maximize revenue through premium pricing and potentially longer minimum stays. Ensure high availability.
- Low Season: Offer competitive pricing, special promotions (e.g., extended stay discounts), and flexible cancellation policies. Target off-season travelers like remote workers or budget-conscious guests.
- Shoulder Seasons: Implement dynamic pricing that balances peak and low rates. Target weekend travelers or specific events. Offer slightly more flexible terms than peak season.
- Regularly analyze your own performance against these Beaufort seasonality benchmarks and adjust your pricing and availability strategy accordingly.
Best Areas for Airbnb Investment in Beaufort (2026)
Exploring the top neighborhoods for short-term rentals in Beaufort? This section highlights key areas, outlining why they are attractive for hosts and guests, along with notable local attractions. Consider these locations based on your target guest profile and investment strategy.
| Neighborhood / Area | Why Host Here? (Target Guests & Appeal) | Key Attractions & Landmarks |
|---|---|---|
| Historic Center | The heart of Beaufort, attracting visitors with its charming old streets and historical buildings. It's ideal for those looking to experience cultural heritage and local cuisine. | Beaufort Castle, Saint John the Baptist Church, Local artisan shops, Bars and restaurants, Local markets |
| Montagne de Bellevue | This area offers stunning mountain views and is perfect for outdoor enthusiasts who want to explore hiking trails and enjoy nature. | Hiking trails, Stunning viewpoints, Picnic areas, Nature reserves |
| Col de la Loze | Known for its ski resorts and winter sports opportunities, this area attracts tourists during winter for skiing and snowboarding. | Ski slopes, Snowboarding, Mountain lodges, Winter hiking trails |
| Les Saisies | A popular ski resort area that draws in families and groups for skiing and winter activities, as well as summer hiking and biking. | Ski lifts, Mountain biking trails, Family-friendly activities, Scenic panoramas |
| Beaufortain Regional Nature Park | A natural area known for its rich biodiversity and beautiful landscapes, appealing to nature lovers and hikers. | Nature trails, Biodiversity, Mountain lakes, Scenic picnic spots |
| Lac de Roselend | A picturesque lake area that provides opportunities for water activities and relaxing stays, ideal for families and couples. | Water sports, Lakeside walks, Picnic areas, Scenic viewpoints |
| Espace Diamant | A ski area that offers a vast range of pistes and is highly sought after by skiing enthusiasts, particularly in the winter months. | Skiing, Snowshoeing, Winter festivals, Summer hiking regions |
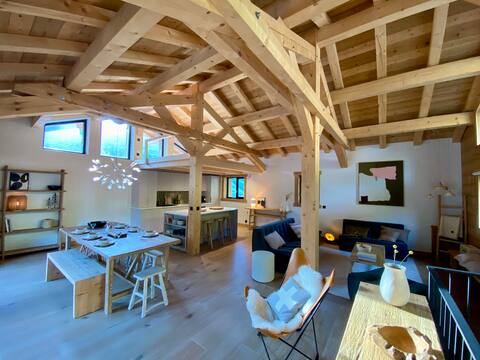
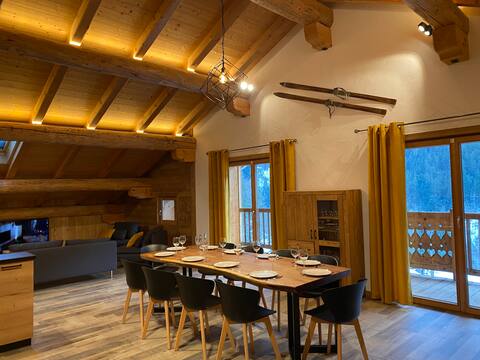
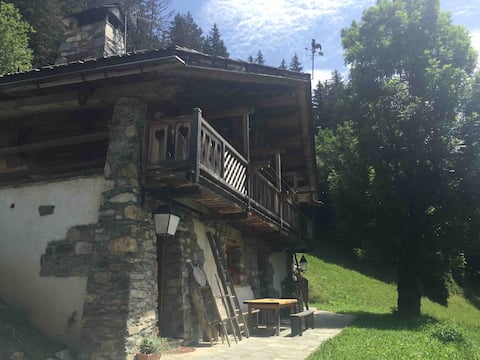
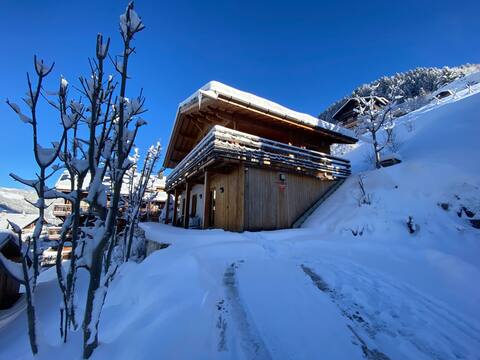
| Chalet-style neighborhoods | Residential areas known for their charming alpine architecture, appealing to visitors looking for a cozy mountain retreat experience. | Chalet stays, Mountain views, Local cuisine, Quiet surroundings |
Understanding Airbnb License Requirements & STR Laws in Beaufort (2026)
While Beaufort, Auvergne-Rhône-Alpes, France currently shows low STR regulations, specific Airbnb license requirements might still exist or change. Always verify the latest short term rental regulations and Airbnb license requirements directly with local government authorities for Beaufort to ensure full compliance before hosting.
(Source: AirROI data, 2026, based on 5% licensed listings)
Top Performing Airbnb Properties in Beaufort (2026)
Benchmark your potential! Explore examples of top-performing Airbnb properties in Beaufortbased on Trailing Twelve Month (TTM) revenue. Analyze their characteristics, revenue, occupancy rate, and ADR to understand what drives success in this market.
140 m² duplex in the heart of Arêches for up to 8 people
Entire Place • 4 bedrooms
Large Cozy Apartment - La Légette du Mirantin
Entire Place • 4 bedrooms
Cottage: 220 m2, 3 bedrooms with bathroom, great view.
Entire Place • 3 bedrooms
Family-friendly chalet for 8/9 people, renovated in Arêches Village
Entire Place • 4 bedrooms
La Ferme d'Eugénie
Entire Place • 3 bedrooms
LA BOULE DE GOMME 2 COTTAGE, with sauna
Entire Place • 5 bedrooms
Note: Performance varies based on location, size, amenities, seasonality, and management quality. Data reflects the past 12 months.
Top Performing Airbnb Hosts in Beaufort (2026)
Learn from the best! This table showcases top-performing Airbnb hosts in Beaufort based on the number of properties managed and estimated total revenue over the past year. Analyze their scale and performance metrics.
| Host Name | Properties | Grossing Revenue | Stay Reviews | Avg Rating |
|---|---|---|---|---|
| Arêches Immobilier | 51 | $353,556 | 155 | 4.83/5.0 |
| Agence Immobiliere | 80 | $294,708 | 702 | 4.59/5.0 |
| Barbara | 2 | $82,879 | 102 | 5.00/5.0 |
| Valérie | 2 | $78,459 | 97 | 5.00/5.0 |
| Prisca | 3 | $74,839 | 60 | 4.94/5.0 |
| Magali | 1 | $64,823 | 6 | 5.00/5.0 |
| Hubert | 2 | $60,784 | 150 | 4.89/5.0 |
| Corine | 2 | $60,641 | 104 | 4.98/5.0 |
| Nathalie | 2 | $58,422 | 243 | 4.92/5.0 |
| Corinne | 2 | $56,160 | 239 | 4.92/5.0 |
Analyzing the strategies of top hosts, such as their property selection, pricing, and guest communication, can offer valuable lessons for optimizing your own Airbnb operations in Beaufort.
Dive Deeper: Advanced Beaufort STR Market Data (2026)
Ready to unlock more insights? AirROI provides access to advanced metrics and comprehensive Airbnb data for Beaufort. Explore detailed analytics beyond this report to refine your investment strategy, optimize pricing, and maximize your vacation rental profits.
Explore Advanced MetricsBeaufort Short-Term Rental Market Composition (2026): Property & Room Types
Room Type Distribution
Property Type Distribution
Market Composition Insights for Beaufort
- The Beaufort Airbnb market composition is heavily skewed towards Entire Home/Apt listings, which make up 98.8% of the 255 active rentals. This indicates strong guest preference for privacy and space.
- Looking at the property type distribution in Beaufort, Apartment/Condo properties are the most common (73.7%), reflecting the local real estate landscape.
- Houses represent a significant 25.5% portion, catering likely to families or larger groups.
- Smaller segments like hotel/boutique, outdoor/unique (combined 0.8%) offer potential for unique stay experiences.
Beaufort Airbnb Room Capacity Analysis (2026): Bedroom Distribution
Distribution of Listings by Number of Bedrooms
Room Capacity Insights for Beaufort
- The dominant room capacity in Beaufort is 1 bedroom listings, making up 34.9% of the market. This suggests a strong demand for properties suitable for couples or solo travelers.
- Together, 1 bedroom and 2 bedrooms properties represent 65.5% of the active Airbnb listings in Beaufort, indicating a high concentration in these sizes.
- A significant 28.6% of listings offer 3+ bedrooms, catering to larger groups and families seeking more space in Beaufort.
Beaufort Vacation Rental Guest Capacity Trends (2026)
Distribution of Listings by Guest Capacity
Guest Capacity Insights for Beaufort
- The most common guest capacity trend in Beaufort vacation rentals is listings accommodating 4 guests (32.2%). This suggests the primary traveler segment is likely small families or groups.
- Properties designed for 4 guests and 8+ guests dominate the Beaufort STR market, accounting for 56.5% of listings.
- 49.8% of properties accommodate 6+ guests, serving the market segment for larger families or group travel in Beaufort.
- On average, properties in Beaufort are equipped to host 5.5 guests.
Beaufort Airbnb Booking Patterns (2026): Available vs. Booked Days
Available Days Distribution
Booked Days Distribution
Booking Pattern Insights for Beaufort
- The most common availability pattern in Beaufort falls within the 271-366 days range, representing 68.2% of listings. This suggests many properties have significant open periods on their calendars.
- Approximately 89.4% of listings show high availability (181+ days open annually), indicating potential for increased bookings or specific owner usage patterns.
- For booked days, the 31-90 days range is most frequent in Beaufort (35.3%), reflecting common guest stay durations or potential owner blocking patterns.
- A notable 11.4% of properties secure long booking periods (181+ days booked per year), highlighting successful long-term rental strategies or significant owner usage.
Beaufort Airbnb Minimum Stay Requirements Analysis
Distribution of Listings by Minimum Night Requirement
1 Night
29 listings
11.4% of total
2 Nights
34 listings
13.3% of total
3 Nights
3 listings
1.2% of total
4-6 Nights
42 listings
16.5% of total
7-29 Nights
39 listings
15.3% of total
30+ Nights
108 listings
42.4% of total
Key Insights
- The most prevalent minimum stay requirement in Beaufort is 30+ Nights, adopted by 42.4% of listings. This highlights the market's preference for longer commitments.
- A significant segment (42.4%) caters to monthly stays (30+ nights) in Beaufort, pointing to opportunities in the extended-stay market.
Recommendations
- Align with the market by considering a 30+ Nights minimum stay, as 42.4% of Beaufort hosts use this setting.
- If feasible, allowing 1-night stays, especially midweek or during low season, could capture last-minute bookings, as only 11.4% currently do.
- Explore offering discounts for stays of 30+ nights to attract the 42.4% of the market seeking extended stays.
- Adjust minimum nights based on seasonality – potentially shorter during low season and longer during peak demand periods in Beaufort.
Beaufort Airbnb Cancellation Policy Trends Analysis (2026)
Super Strict 30 Days
1 listings
0.4% of total
Super Strict 60 Days
68 listings
26.7% of total
Limited
1 listings
0.4% of total
Flexible
14 listings
5.5% of total
Moderate
24 listings
9.4% of total
Firm
116 listings
45.5% of total
Strict
31 listings
12.2% of total
Cancellation Policy Insights for Beaufort
- The prevailing Airbnb cancellation policy trend in Beaufort is Firm, used by 45.5% of listings.
- A majority (57.7%) of hosts in Beaufort utilize Firm or Strict policies, indicating a market where hosts prioritize booking security.
Recommendations for Hosts
- Consider adopting a Firm policy to align with the 45.5% market standard in Beaufort.
- Using a Strict policy might deter some guests, as only 12.2% of listings use it. Evaluate if potential revenue protection outweighs possible lower booking rates.
- Regularly review your cancellation policy against competitors and market demand shifts in Beaufort.
Beaufort STR Booking Lead Time Analysis (2026)
Average Booking Lead Time by Month
Booking Lead Time Insights for Beaufort
- The overall average booking lead time for vacation rentals in Beaufort is 46 days.
- Guests book furthest in advance for stays during February (average 85 days), likely coinciding with peak travel demand or local events.
- The shortest booking windows occur for stays in June (average 25 days), indicating more last-minute travel plans during this time.
- Seasonally, Winter (65 days avg.) sees the longest lead times, while Fall (32 days avg.) has the shortest, reflecting typical travel planning cycles.
Recommendations for Hosts
- Use the overall average lead time (46 days) as a baseline for your pricing and availability strategy in Beaufort.
- For February stays, consider implementing length-of-stay discounts or slightly higher rates for bookings made less than 85 days out to capitalize on advance planning.
- Target marketing efforts for the Winter season well in advance (at least 65 days) to capture early planners.
- Monitor your own booking lead times against these Beaufort averages to identify opportunities for dynamic pricing adjustments.
Popular & Essential Airbnb Amenities in Beaufort (2026)
Amenity Prevalence
Amenity Insights for Beaufort
- Popular amenities like TV, Kitchen, Heating are common but not universal. Offering these can provide a competitive edge.
Recommendations for Hosts
- Consider adding popular differentiators like TV or Kitchen to increase appeal.
- Highlight unique or less common amenities you offer (e.g., hot tub, dedicated workspace, EV charger) in your listing description and photos.
- Regularly check competitor amenities in Beaufort to stay competitive.
Beaufort Airbnb Guest Demographics & Profile Analysis (2026)
Guest Profile Summary for Beaufort
- The typical guest profile for Airbnb in Beaufort consists of primarily domestic travelers (87%), often arriving from nearby Lyon, typically belonging to the Post-2000s (Gen Z/Alpha) group (50%), primarily speaking French or English.
- Domestic travelers account for 86.9% of guests.
- Key international markets include France (86.9%) and Belgium (3%).
- Top languages spoken are French (45.9%) followed by English (34.9%).
- A significant demographic segment is the Post-2000s (Gen Z/Alpha) group, representing 50% of guests.
Recommendations for Hosts
- Target domestic marketing efforts towards travelers from Lyon and Paris.
- Tailor amenities and listing descriptions to appeal to the dominant Post-2000s (Gen Z/Alpha) demographic (e.g., highlight fast WiFi, smart home features, local guides).
- Highlight unique local experiences or amenities relevant to the primary guest profile.
- Consider seasonal promotions aligned with peak travel times for key origin markets.
Nearby Short-Term Rental Market Comparison
How does the Beaufort Airbnb market stack up against its neighbors? Compare key performance metrics like average monthly revenue, ADR, and occupancy rates in surrounding areas to understand the broader regional STR landscape.
| Market | Active Properties | Monthly Revenue | Daily Rate | Avg. Occupancy |
|---|---|---|---|---|
| Niederried bei Interlaken | 19 | $6,267 | $552.03 | 44% |
| Lauterbrunnen | 552 | $6,108 | $487.83 | 51% |
| Matten bei Interlaken | 64 | $5,607 | $336.51 | 59% |
| Les Clefs | 34 | $5,585 | $314.08 | 47% |
| Monteu Roero | 12 | $5,184 | $403.07 | 41% |
| Wengen | 12 | $5,115 | $595.38 | 46% |
| Oberhofen am Thunersee | 25 | $5,051 | $329.28 | 51% |
| Zermatt | 792 | $5,017 | $504.14 | 46% |
| Interlaken | 346 | $4,947 | $399.71 | 53% |
| Bönigen | 35 | $4,848 | $288.51 | 65% |