Jonage Airbnb Market Analysis 2026: Short Term Rental Data & Vacation Rental Statistics in Auvergne-Rhône-Alpes, France
Is Airbnb profitable in Jonage in 2026? Explore comprehensive Airbnb analytics for Jonage, Auvergne-Rhône-Alpes, France to uncover income potential. This 2026 STR market report for Jonage, based on AirROI data from February 2025 to January 2026, reveals key trends in the niche market of 27 active listings.
Whether you're considering an Airbnb investment in Jonage, optimizing your existing vacation rental, or exploring rental arbitrage opportunities, understanding the Jonage Airbnb data is crucial. Leveraging the low regulation environment is key to maximizing your short term rental income potential. Let's dive into the specifics.
Key Jonage Airbnb Performance Metrics Overview
Monthly Airbnb Revenue Variations & Income Potential in Jonage (2026)
Understanding the monthly revenue variations for Airbnb listings in Jonage is key to maximizing your short term rental income potential. Seasonality significantly impacts earnings. Our analysis, based on data from the past 12 months, shows that the peak revenue month for STRs in Jonage is typically August, while February often presents the lowest earnings, highlighting opportunities for strategic pricing adjustments during shoulder and low seasons. Explore the typical Airbnb income in Jonage across different performance tiers:
- Best-in-class properties (Top 10%) achieve $2,187+ monthly, often utilizing dynamic pricing and superior guest experiences.
- Strong performing properties (Top 25%) earn $1,454 or more, indicating effective management and desirable locations/amenities.
- Typical properties (Median) generate around $776 per month, representing the average market performance.
- Entry-level properties (Bottom 25%) see earnings around $329, often with potential for optimization.
Average Monthly Airbnb Earnings Trend in Jonage
Jonage Airbnb Occupancy Rate Trends (2026)
Maximize your bookings by understanding the Jonage STR occupancy trends. Seasonal demand shifts significantly influence how often properties are booked. Typically, Augustsees the highest demand (peak season occupancy), while May experiences the lowest (low season). Effective strategies, like adjusting minimum stays or offering promotions, can boost occupancy during slower periods. Here's how different property tiers perform in Jonage:
- Best-in-class properties (Top 10%) achieve 73%+ occupancy, indicating high desirability and potentially optimized availability.
- Strong performing properties (Top 25%) maintain 49% or higher occupancy, suggesting good market fit and guest satisfaction.
- Typical properties (Median) have an occupancy rate around 27%.
- Entry-level properties (Bottom 25%) average 13% occupancy, potentially facing higher vacancy.
Average Monthly Occupancy Rate Trend in Jonage
Average Daily Rate (ADR) Airbnb Trends in Jonage (2026)
Effective short term rental pricing strategy in Jonage involves understanding monthly ADR fluctuations. The Average Daily Rate (ADR) for Airbnb in Jonage typically peaks in September and dips lowest during March. Leveraging Airbnb dynamic pricing tools or strategies based on this seasonality can significantly boost revenue. Here's a look at the typical nightly rates achieved:
- Best-in-class properties (Top 10%) command rates of $285+ per night, often due to premium features or locations.
- Strong performing properties (Top 25%) achieve nightly rates of $155 or more.
- Typical properties (Median) charge around $90 per night.
- Entry-level properties (Bottom 25%) earn around $61 per night.
Average Daily Rate (ADR) Trend by Month in Jonage
Get Live Jonage Market Intelligence 👇

Explore Real-time Analytics
Airbnb Seasonality Analysis & Trends in Jonage (2026)
Peak Season (August, July, June)
- Revenue averages $1,395 per month
- Occupancy rates average 38.9%
- Daily rates average $131
Shoulder Season
- Revenue averages $1,033 per month
- Occupancy maintains around 34.0%
- Daily rates hold near $133
Low Season (January, February, March)
- Revenue drops to average $760 per month
- Occupancy decreases to average 28.9%
- Daily rates adjust to average $125
Seasonality Insights for Jonage
- The Airbnb seasonality in Jonage shows highly seasonal trends requiring careful strategy. While the sections above show seasonal averages, it's also insightful to look at the extremes:
- During the high season, the absolute peak month showcases Jonage's highest earning potential, with monthly revenues capable of climbing to $1,482, occupancy reaching a high of 43.3%, and ADRs peaking at $139.
- Conversely, the slowest single month of the year, typically falling within the low season, marks the market's lowest point. In this month, revenue might dip to $712, occupancy could drop to 27.6%, and ADRs may adjust down to $119.
- Understanding both the seasonal averages and these monthly peaks and troughs in revenue, occupancy, and ADR is crucial for maximizing your Airbnb profit potential in Jonage.
Seasonal Strategies for Maximizing Profit
- Peak Season: Maximize revenue through premium pricing and potentially longer minimum stays. Ensure high availability.
- Low Season: Offer competitive pricing, special promotions (e.g., extended stay discounts), and flexible cancellation policies. Target off-season travelers like remote workers or budget-conscious guests.
- Shoulder Seasons: Implement dynamic pricing that balances peak and low rates. Target weekend travelers or specific events. Offer slightly more flexible terms than peak season.
- Regularly analyze your own performance against these Jonage seasonality benchmarks and adjust your pricing and availability strategy accordingly.
Best Areas for Airbnb Investment in Jonage (2026)
Exploring the top neighborhoods for short-term rentals in Jonage? This section highlights key areas, outlining why they are attractive for hosts and guests, along with notable local attractions. Consider these locations based on your target guest profile and investment strategy.
| Neighborhood / Area | Why Host Here? (Target Guests & Appeal) | Key Attractions & Landmarks |
|---|---|---|
| Centre de Jonage | A charming location with easy access to local amenities and transport links. Perfect for guests looking to enjoy the quiet suburban atmosphere while being close to Lyon. | Parc de la Mairie, Église Saint-Bonnet, Maison de la Culture et du Tourisme, Les Jardins de la Mairie |
| Parc de la Tête d'Or | A nearby large urban park that offers beautiful lakes, a zoo, and cultural events. Ideal for families and nature lovers. | Parc de la Tête d'Or, Orchidée Tropicale, Zoo de Lyon, Lac du parc, Jardin Botanique |
| Lyon's Croix-Rousse District | Known for its historic buildings and vibrant market scene, this area is popular with tourists seeking authentic local culture and good gastronomy. | Place de la Croix-Rousse, Les Halles de Lyon, Mur des Canuts, Parc de la Cerisaie |
| Bron City | Located close to Jonage, Bron offers a mix of urban living with access to parks and recreational areas. Great for families and business travelers. | Parc de Parilly, Lyon-Bron Airport, Centre de Congrès |
Understanding Airbnb License Requirements & STR Laws in Jonage (2026)
While Jonage, Auvergne-Rhône-Alpes, France currently shows low STR regulations, specific Airbnb license requirements might still exist or change. Always verify the latest short term rental regulations and Airbnb license requirements directly with local government authorities for Jonage to ensure full compliance before hosting.
(Source: AirROI data, 2026, based on 7% licensed listings)
Top Performing Airbnb Properties in Jonage (2026)
Benchmark your potential! Explore examples of top-performing Airbnb properties in Jonagebased on Trailing Twelve Month (TTM) revenue. Analyze their characteristics, revenue, occupancy rate, and ADR to understand what drives success in this market.
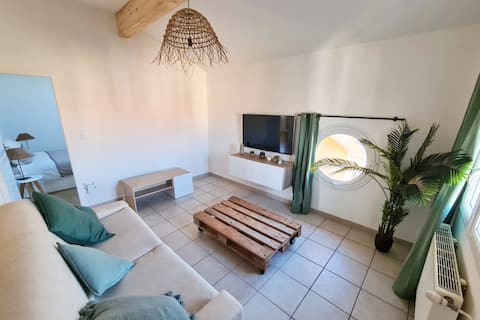
Casa Papidou, Charming Quiet House
Entire Place • 2 bedrooms
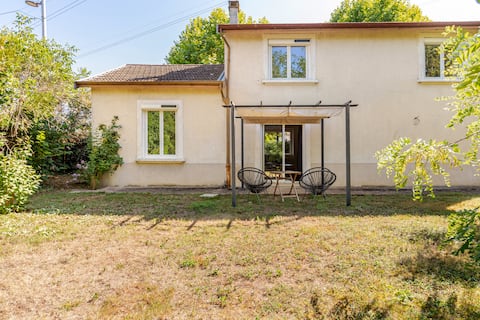
Cozy home near Lyon and airport
Entire Place • 3 bedrooms
The bedroom : proche aeroport lyon, groupama, ldlc
Entire Place • 1 bedroom
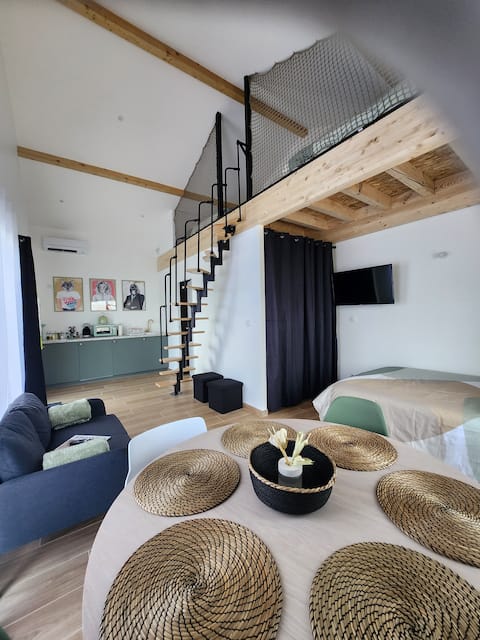
Jonage Urban Good Living
Entire Place • 1 bedroom
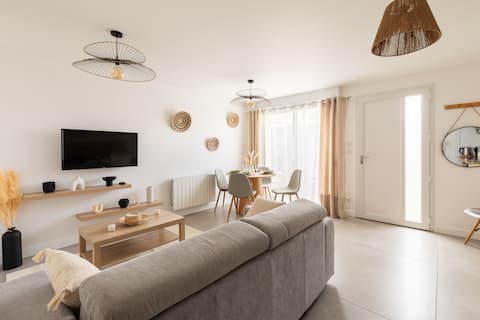
Studio/30mn Lyon/10mn StEx/10mn Stade OL/20mn Eurexpo
Entire Place • 1 bedroom

Family villa with pool near Lyon
Entire Place • 3 bedrooms
Note: Performance varies based on location, size, amenities, seasonality, and management quality. Data reflects the past 12 months.
Top Performing Airbnb Hosts in Jonage (2026)
Learn from the best! This table showcases top-performing Airbnb hosts in Jonage based on the number of properties managed and estimated total revenue over the past year. Analyze their scale and performance metrics.
| Host Name | Properties | Grossing Revenue | Stay Reviews | Avg Rating |
|---|---|---|---|---|
| Florian Et Elodie | 1 | $27,097 | 191 | 4.92/5.0 |
| Robin | 1 | $24,922 | 70 | 4.84/5.0 |
| Emilie | 2 | $24,410 | 158 | 4.57/5.0 |
| Romain | 1 | $21,028 | 82 | 4.98/5.0 |
| Laurie | 1 | $17,557 | 81 | 4.96/5.0 |
| Audrey-Julien | 1 | $17,238 | 206 | 4.86/5.0 |
| Audrey | 1 | $16,102 | 13 | 4.92/5.0 |
| Haby | 2 | $14,979 | 42 | 4.80/5.0 |
| Michel | 3 | $13,131 | 39 | 4.93/5.0 |
| Eddy | 4 | $12,397 | 61 | 3.90/5.0 |
Analyzing the strategies of top hosts, such as their property selection, pricing, and guest communication, can offer valuable lessons for optimizing your own Airbnb operations in Jonage.
Dive Deeper: Advanced Jonage STR Market Data (2026)
Ready to unlock more insights? AirROI provides access to advanced metrics and comprehensive Airbnb data for Jonage. Explore detailed analytics beyond this report to refine your investment strategy, optimize pricing, and maximize your vacation rental profits.
Explore Advanced MetricsJonage Short-Term Rental Market Composition (2026): Property & Room Types
Room Type Distribution
Property Type Distribution
Market Composition Insights for Jonage
- The Jonage Airbnb market composition is heavily skewed towards Entire Home/Apt listings, which make up 74.1% of the 27 active rentals. This indicates strong guest preference for privacy and space.
- Looking at the property type distribution in Jonage, House properties are the most common (59.3%), reflecting the local real estate landscape.
- Houses represent a significant 59.3% portion, catering likely to families or larger groups.
- Smaller segments like hotel/boutique (combined 3.7%) offer potential for unique stay experiences.
Jonage Airbnb Room Capacity Analysis (2026): Bedroom Distribution
Distribution of Listings by Number of Bedrooms
Room Capacity Insights for Jonage
- The dominant room capacity in Jonage is 1 bedroom listings, making up 29.6% of the market. This suggests a strong demand for properties suitable for couples or solo travelers.
- Together, 1 bedroom and 3 bedrooms properties represent 55.5% of the active Airbnb listings in Jonage, indicating a high concentration in these sizes.
- A significant 29.6% of listings offer 3+ bedrooms, catering to larger groups and families seeking more space in Jonage.
Jonage Vacation Rental Guest Capacity Trends (2026)
Distribution of Listings by Guest Capacity
Guest Capacity Insights for Jonage
- The most common guest capacity trend in Jonage vacation rentals is listings accommodating 6 guests (22.2%). This suggests the primary traveler segment is likely larger groups.
- Properties designed for 6 guests and 4 guests dominate the Jonage STR market, accounting for 40.7% of listings.
- 37.0% of properties accommodate 6+ guests, serving the market segment for larger families or group travel in Jonage.
- On average, properties in Jonage are equipped to host 3.5 guests.
Jonage Airbnb Booking Patterns (2026): Available vs. Booked Days
Available Days Distribution
Booked Days Distribution
Booking Pattern Insights for Jonage
- The most common availability pattern in Jonage falls within the 271-366 days range, representing 63% of listings. This suggests many properties have significant open periods on their calendars.
- Approximately 81.5% of listings show high availability (181+ days open annually), indicating potential for increased bookings or specific owner usage patterns.
- For booked days, the 31-90 days range is most frequent in Jonage (44.4%), reflecting common guest stay durations or potential owner blocking patterns.
- A notable 18.5% of properties secure long booking periods (181+ days booked per year), highlighting successful long-term rental strategies or significant owner usage.
Jonage Airbnb Minimum Stay Requirements Analysis
Distribution of Listings by Minimum Night Requirement
1 Night
14 listings
51.9% of total
2 Nights
7 listings
25.9% of total
3 Nights
1 listings
3.7% of total
4-6 Nights
2 listings
7.4% of total
30+ Nights
3 listings
11.1% of total
Key Insights
- The most prevalent minimum stay requirement in Jonage is 1 Night, adopted by 51.9% of listings. This highlights the market's preference for shorter, flexible bookings.
- A strong majority (77.8%) of the Jonage Airbnb data shows acceptance of very short stays (1-2 nights), indicating a dynamic, high-turnover market.
- A significant segment (11.1%) caters to monthly stays (30+ nights) in Jonage, pointing to opportunities in the extended-stay market.
Recommendations
- Align with the market by considering a 1 Night minimum stay, as 51.9% of Jonage hosts use this setting.
- Explore offering discounts for stays of 30+ nights to attract the 11.1% of the market seeking extended stays.
- Adjust minimum nights based on seasonality – potentially shorter during low season and longer during peak demand periods in Jonage.
Jonage Airbnb Cancellation Policy Trends Analysis (2026)
Flexible
11 listings
40.7% of total
Moderate
8 listings
29.6% of total
Firm
4 listings
14.8% of total
Strict
4 listings
14.8% of total
Cancellation Policy Insights for Jonage
- The prevailing Airbnb cancellation policy trend in Jonage is Flexible, used by 40.7% of listings.
- The market strongly favors guest-friendly terms, with 70.3% of listings offering Flexible or Moderate policies. This suggests guests in Jonage may expect booking flexibility.
Recommendations for Hosts
- Consider adopting a Flexible policy to align with the 40.7% market standard in Jonage.
- Using a Strict policy might deter some guests, as only 14.8% of listings use it. Evaluate if potential revenue protection outweighs possible lower booking rates.
- Regularly review your cancellation policy against competitors and market demand shifts in Jonage.
Jonage STR Booking Lead Time Analysis (2026)
Average Booking Lead Time by Month
Booking Lead Time Insights for Jonage
- The overall average booking lead time for vacation rentals in Jonage is 39 days.
- Guests book furthest in advance for stays during June (average 67 days), likely coinciding with peak travel demand or local events.
- The shortest booking windows occur for stays in January (average 17 days), indicating more last-minute travel plans during this time.
- Seasonally, Summer (45 days avg.) sees the longest lead times, while Winter (26 days avg.) has the shortest, reflecting typical travel planning cycles.
Recommendations for Hosts
- Use the overall average lead time (39 days) as a baseline for your pricing and availability strategy in Jonage.
- For June stays, consider implementing length-of-stay discounts or slightly higher rates for bookings made less than 67 days out to capitalize on advance planning.
- Target marketing efforts for the Summer season well in advance (at least 45 days) to capture early planners.
- Monitor your own booking lead times against these Jonage averages to identify opportunities for dynamic pricing adjustments.
Popular & Essential Airbnb Amenities in Jonage (2026)
Amenity Prevalence
Amenity Insights for Jonage
- Essential amenities in Jonage that guests expect include: TV, Wifi. Lacking these (any) could significantly impact bookings.
- Popular amenities like Kitchen, Free parking on premises, Smoke alarm are common but not universal. Offering these can provide a competitive edge.
Recommendations for Hosts
- Ensure your listing includes all essential amenities for Jonage: TV, Wifi.
- Prioritize adding missing essentials: Wifi.
- Consider adding popular differentiators like Kitchen or Free parking on premises to increase appeal.
- Highlight unique or less common amenities you offer (e.g., hot tub, dedicated workspace, EV charger) in your listing description and photos.
- Regularly check competitor amenities in Jonage to stay competitive.
Jonage Airbnb Guest Demographics & Profile Analysis (2026)
Guest Profile Summary for Jonage
- The typical guest profile for Airbnb in Jonage consists of primarily domestic travelers (86%), often arriving from nearby Lyon, typically belonging to the Post-2000s (Gen Z/Alpha) group (50%), primarily speaking French or English.
- Domestic travelers account for 85.6% of guests.
- Key international markets include France (85.6%) and Netherlands (2.6%).
- Top languages spoken are French (46.1%) followed by English (32%).
- A significant demographic segment is the Post-2000s (Gen Z/Alpha) group, representing 50% of guests.
Recommendations for Hosts
- Target domestic marketing efforts towards travelers from Lyon and Hindisheim.
- Tailor amenities and listing descriptions to appeal to the dominant Post-2000s (Gen Z/Alpha) demographic (e.g., highlight fast WiFi, smart home features, local guides).
- Highlight unique local experiences or amenities relevant to the primary guest profile.
- Consider seasonal promotions aligned with peak travel times for key origin markets.
Nearby Short-Term Rental Market Comparison
How does the Jonage Airbnb market stack up against its neighbors? Compare key performance metrics like average monthly revenue, ADR, and occupancy rates in surrounding areas to understand the broader regional STR landscape.
| Market | Active Properties | Monthly Revenue | Daily Rate | Avg. Occupancy |
|---|---|---|---|---|
| Épinac | 18 | $8,488 | $539.65 | 36% |
| Les Clefs | 34 | $5,585 | $314.08 | 47% |
| La Rivière-Enverse | 18 | $4,591 | $674.42 | 37% |
| Manigod | 221 | $4,273 | $460.37 | 38% |
| Saint-Trivier-sur-Moignans | 10 | $3,748 | $311.34 | 37% |
| Saint-Nicolas-la-Chapelle | 27 | $3,658 | $459.86 | 41% |
| Charvonnex | 11 | $3,610 | $266.39 | 45% |
| Bourdeau | 13 | $3,327 | $260.60 | 50% |
| Les Villards-sur-Thônes | 63 | $3,322 | $292.02 | 47% |
| Cavillargues | 12 | $3,274 | $342.99 | 43% |