Sampans Airbnb Market Analysis 2026: Short Term Rental Data & Vacation Rental Statistics in Bourgogne – Franche-Comté, France
Is Airbnb profitable in Sampans in 2026? Explore comprehensive Airbnb analytics for Sampans, Bourgogne – Franche-Comté, France to uncover income potential. This 2026 STR market report for Sampans, based on AirROI data from February 2025 to January 2026, reveals key trends in the niche market of 19 active listings.
Whether you're considering an Airbnb investment in Sampans, optimizing your existing vacation rental, or exploring rental arbitrage opportunities, understanding the Sampans Airbnb data is crucial. Leveraging the low regulation environment is key to maximizing your short term rental income potential. Let's dive into the specifics.
Key Sampans Airbnb Performance Metrics Overview
Monthly Airbnb Revenue Variations & Income Potential in Sampans (2026)
Understanding the monthly revenue variations for Airbnb listings in Sampans is key to maximizing your short term rental income potential. Seasonality significantly impacts earnings. Our analysis, based on data from the past 12 months, shows that the peak revenue month for STRs in Sampans is typically January, while November often presents the lowest earnings, highlighting opportunities for strategic pricing adjustments during shoulder and low seasons. Explore the typical Airbnb income in Sampans across different performance tiers:
- Best-in-class properties (Top 10%) achieve $3,048+ monthly, often utilizing dynamic pricing and superior guest experiences.
- Strong performing properties (Top 25%) earn $1,070 or more, indicating effective management and desirable locations/amenities.
- Typical properties (Median) generate around $545 per month, representing the average market performance.
- Entry-level properties (Bottom 25%) see earnings around $250, often with potential for optimization.
Average Monthly Airbnb Earnings Trend in Sampans
Sampans Airbnb Occupancy Rate Trends (2026)
Maximize your bookings by understanding the Sampans STR occupancy trends. Seasonal demand shifts significantly influence how often properties are booked. Typically, Augustsees the highest demand (peak season occupancy), while November experiences the lowest (low season). Effective strategies, like adjusting minimum stays or offering promotions, can boost occupancy during slower periods. Here's how different property tiers perform in Sampans:
- Best-in-class properties (Top 10%) achieve 59%+ occupancy, indicating high desirability and potentially optimized availability.
- Strong performing properties (Top 25%) maintain 42% or higher occupancy, suggesting good market fit and guest satisfaction.
- Typical properties (Median) have an occupancy rate around 18%.
- Entry-level properties (Bottom 25%) average 9% occupancy, potentially facing higher vacancy.
Average Monthly Occupancy Rate Trend in Sampans
Average Daily Rate (ADR) Airbnb Trends in Sampans (2026)
Effective short term rental pricing strategy in Sampans involves understanding monthly ADR fluctuations. The Average Daily Rate (ADR) for Airbnb in Sampans typically peaks in December and dips lowest during April. Leveraging Airbnb dynamic pricing tools or strategies based on this seasonality can significantly boost revenue. Here's a look at the typical nightly rates achieved:
- Best-in-class properties (Top 10%) command rates of $178+ per night, often due to premium features or locations.
- Strong performing properties (Top 25%) achieve nightly rates of $111 or more.
- Typical properties (Median) charge around $63 per night.
- Entry-level properties (Bottom 25%) earn around $52 per night.
Average Daily Rate (ADR) Trend by Month in Sampans
Get Live Sampans Market Intelligence 👇

Explore Real-time Analytics
Airbnb Seasonality Analysis & Trends in Sampans (2026)
Peak Season (January, August, July)
- Revenue averages $1,524 per month
- Occupancy rates average 38.1%
- Daily rates average $94
Shoulder Season
- Revenue averages $834 per month
- Occupancy maintains around 23.4%
- Daily rates hold near $90
Low Season (April, September, November)
- Revenue drops to average $696 per month
- Occupancy decreases to average 21.6%
- Daily rates adjust to average $92
Seasonality Insights for Sampans
- The Airbnb seasonality in Sampans shows highly seasonal trends requiring careful strategy. While the sections above show seasonal averages, it's also insightful to look at the extremes:
- During the high season, the absolute peak month showcases Sampans's highest earning potential, with monthly revenues capable of climbing to $1,758, occupancy reaching a high of 40.8%, and ADRs peaking at $102.
- Conversely, the slowest single month of the year, typically falling within the low season, marks the market's lowest point. In this month, revenue might dip to $673, occupancy could drop to 17.2%, and ADRs may adjust down to $81.
- Understanding both the seasonal averages and these monthly peaks and troughs in revenue, occupancy, and ADR is crucial for maximizing your Airbnb profit potential in Sampans.
Seasonal Strategies for Maximizing Profit
- Peak Season: Maximize revenue through premium pricing and potentially longer minimum stays. Ensure high availability.
- Low Season: Offer competitive pricing, special promotions (e.g., extended stay discounts), and flexible cancellation policies. Target off-season travelers like remote workers or budget-conscious guests.
- Shoulder Seasons: Implement dynamic pricing that balances peak and low rates. Target weekend travelers or specific events. Offer slightly more flexible terms than peak season.
- Regularly analyze your own performance against these Sampans seasonality benchmarks and adjust your pricing and availability strategy accordingly.
Best Areas for Airbnb Investment in Sampans (2026)
Exploring the top neighborhoods for short-term rentals in Sampans? This section highlights key areas, outlining why they are attractive for hosts and guests, along with notable local attractions. Consider these locations based on your target guest profile and investment strategy.
| Neighborhood / Area | Why Host Here? (Target Guests & Appeal) | Key Attractions & Landmarks |
|---|---|---|
| Château de Pommard | A beautiful historic château known for its wine production and breathtaking landscapes. It's a popular spot for wine tourists and those looking to experience the French countryside. | Château de Pommard, Vineyards tours, Wine tasting experiences, Burgundian gastronomy, Cycling routes through vineyards |
| Beaune | Famous for its wine culture and remarkable architecture, Beaune attracts tourists year-round with its historical significance and annual wine festivals. | Hôtel-Dieu Museum, Beaune's vineyards, Wine tasting tours, Beaune market, Burgundy wine auction |
| Dijon | The capital of Burgundy is known for its rich history, culinary delights, and beautiful museums. A vibrant city ideal for both short and long stays. | Dijon Cathedral, Palace of the Dukes of Burgundy, Musee des Beaux-Arts de Dijon, Les Halles market, Dijon mustard shops |
| Nuits-Saint-Georges | A charming town famous for its wine production and beautiful countryside, ideal for guests seeking a peaceful retreat in the Côte de Nuits. | Wine cellars, Côte de Nuits vineyards, Nuits-Saint-Georges market, Hiking trails, Wine tours |
| Montbard | Home to the Abbey of Fontenay, a UNESCO World Heritage site, Montbard offers a blend of historical charm and nature, attracting heritage enthusiasts. | Abbey of Fontenay, Burgundy Canal, Bicycle routes, Historical buildings, Natural parks |
| Autun | An ancient Roman city with rich history, offering a unique cultural experience for tourists interested in history and architecture. | Roman theater, Cathédrale Saint-Lazare, Museum of Autun, Historical walking tours, Local markets |
| Tournus | Located along the Saône river with a rich historical background, Tournus offers picturesque views and great food, appealing to both nature lovers and foodies. | Tournus Abbey, Saône river walks, Culinary specialties, Historic buildings, Local wine tasting |
| Macon | Known for its wine production and beautiful landscapes, Macon attracts visitors looking for a blend of urban and rural experiences. | Macon Cathedral, Vineyards, Local markets, Cultural festivals, River Saône |
Understanding Airbnb License Requirements & STR Laws in Sampans (2026)
While Sampans, Bourgogne – Franche-Comté, France currently shows low STR regulations, specific Airbnb license requirements might still exist or change. Always verify the latest short term rental regulations and Airbnb license requirements directly with local government authorities for Sampans to ensure full compliance before hosting.
(Source: AirROI data, 2026, finding no licensed listings among those analyzed)
Top Performing Airbnb Properties in Sampans (2026)
Benchmark your potential! Explore examples of top-performing Airbnb properties in Sampansbased on Trailing Twelve Month (TTM) revenue. Analyze their characteristics, revenue, occupancy rate, and ADR to understand what drives success in this market.

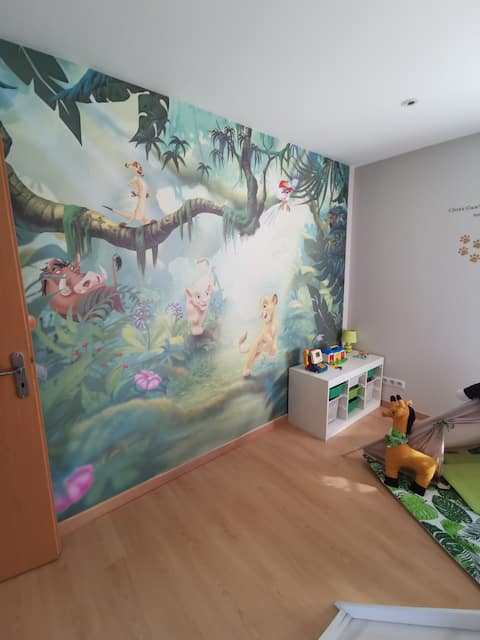
Luxury villa with private heated HOT TUB
Entire Place • 2 bedrooms

La Romalou, 4 bedroom house + Pool
Entire Place • 4 bedrooms
Bed and breakfast at Manon's
Private Room • 4 bedrooms

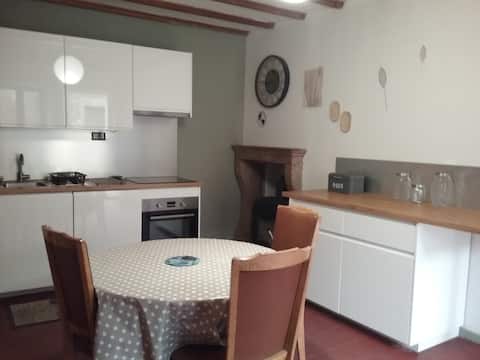
House in a small village
Entire Place • 4 bedrooms

Chalet - 2 persons – Jura, near Dole / Mont-Roland
Entire Place • 1 bedroom
Country cottage for rent
Entire Place • 2 bedrooms
Note: Performance varies based on location, size, amenities, seasonality, and management quality. Data reflects the past 12 months.
Top Performing Airbnb Hosts in Sampans (2026)
Learn from the best! This table showcases top-performing Airbnb hosts in Sampans based on the number of properties managed and estimated total revenue over the past year. Analyze their scale and performance metrics.
| Host Name | Properties | Grossing Revenue | Stay Reviews | Avg Rating |
|---|---|---|---|---|
| Sami | 1 | $37,496 | 80 | 4.99/5.0 |
| Amandine | 1 | $26,586 | 86 | 4.94/5.0 |
| Manon | 7 | $24,017 | 132 | 4.76/5.0 |
| Fanny | 1 | $11,736 | 9 | 4.89/5.0 |
| Marc | 4 | $9,572 | 415 | 4.64/5.0 |
| Adrien | 1 | $8,180 | 77 | 4.86/5.0 |
| Clément | 2 | $7,880 | 23 | 4.83/5.0 |
| Alain Et Fat | 1 | $3,409 | 58 | 4.81/5.0 |
| Nicolas | 1 | $1,955 | 6 | 5.00/5.0 |
Analyzing the strategies of top hosts, such as their property selection, pricing, and guest communication, can offer valuable lessons for optimizing your own Airbnb operations in Sampans.
Dive Deeper: Advanced Sampans STR Market Data (2026)
Ready to unlock more insights? AirROI provides access to advanced metrics and comprehensive Airbnb data for Sampans. Explore detailed analytics beyond this report to refine your investment strategy, optimize pricing, and maximize your vacation rental profits.
Explore Advanced MetricsSampans Short-Term Rental Market Composition (2026): Property & Room Types
Room Type Distribution
Property Type Distribution
Market Composition Insights for Sampans
- The Sampans Airbnb market composition is heavily skewed towards Private Room listings, which make up 57.9% of the 19 active rentals. This indicates strong guest preference for privacy and space.
- Looking at the property type distribution in Sampans, Hotel/Boutique properties are the most common (57.9%), reflecting the local real estate landscape.
- Houses represent a significant 36.8% portion, catering likely to families or larger groups.
- The presence of 57.9% Hotel/Boutique listings indicates integration with traditional hospitality.
Sampans Airbnb Room Capacity Analysis (2026): Bedroom Distribution
Distribution of Listings by Number of Bedrooms
Room Capacity Insights for Sampans
- The dominant room capacity in Sampans is 2 bedrooms listings, making up 26.3% of the market. This suggests a strong demand for properties suitable for couples or solo travelers.
- Together, 2 bedrooms and 1 bedroom properties represent 42.1% of the active Airbnb listings in Sampans, indicating a high concentration in these sizes.
- A significant 21.1% of listings offer 3+ bedrooms, catering to larger groups and families seeking more space in Sampans.
Sampans Vacation Rental Guest Capacity Trends (2026)
Distribution of Listings by Guest Capacity
Guest Capacity Insights for Sampans
- The most common guest capacity trend in Sampans vacation rentals is listings accommodating 8+ guests (15.8%). This suggests the primary traveler segment is likely larger groups.
- Properties designed for 8+ guests and 2 guests dominate the Sampans STR market, accounting for 26.3% of listings.
- 21.1% of properties accommodate 6+ guests, serving the market segment for larger families or group travel in Sampans.
- On average, properties in Sampans are equipped to host 2.4 guests.
Sampans Airbnb Booking Patterns (2026): Available vs. Booked Days
Available Days Distribution
Booked Days Distribution
Booking Pattern Insights for Sampans
- The most common availability pattern in Sampans falls within the 271-366 days range, representing 73.7% of listings. This suggests many properties have significant open periods on their calendars.
- Approximately 100.0% of listings show high availability (181+ days open annually), indicating potential for increased bookings or specific owner usage patterns.
- For booked days, the 1-30 days range is most frequent in Sampans (36.8%), reflecting common guest stay durations or potential owner blocking patterns.
Sampans Airbnb Minimum Stay Requirements Analysis
Distribution of Listings by Minimum Night Requirement
1 Night
14 listings
73.7% of total
2 Nights
2 listings
10.5% of total
3 Nights
1 listings
5.3% of total
7-29 Nights
1 listings
5.3% of total
30+ Nights
1 listings
5.3% of total
Key Insights
- The most prevalent minimum stay requirement in Sampans is 1 Night, adopted by 73.7% of listings. This highlights the market's preference for shorter, flexible bookings.
- A strong majority (84.2%) of the Sampans Airbnb data shows acceptance of very short stays (1-2 nights), indicating a dynamic, high-turnover market.
Recommendations
- Align with the market by considering a 1 Night minimum stay, as 73.7% of Sampans hosts use this setting.
- Explore offering discounts for stays of 30+ nights to attract the 5.3% of the market seeking extended stays.
- Adjust minimum nights based on seasonality – potentially shorter during low season and longer during peak demand periods in Sampans.
Sampans Airbnb Cancellation Policy Trends Analysis (2026)
Flexible
6 listings
31.6% of total
Moderate
12 listings
63.2% of total
Firm
1 listings
5.3% of total
Cancellation Policy Insights for Sampans
- The prevailing Airbnb cancellation policy trend in Sampans is Moderate, used by 63.2% of listings.
- The market strongly favors guest-friendly terms, with 94.8% of listings offering Flexible or Moderate policies. This suggests guests in Sampans may expect booking flexibility.
Recommendations for Hosts
- Consider adopting a Moderate policy to align with the 63.2% market standard in Sampans.
- Regularly review your cancellation policy against competitors and market demand shifts in Sampans.
Sampans STR Booking Lead Time Analysis (2026)
Average Booking Lead Time by Month
Booking Lead Time Insights for Sampans
- The overall average booking lead time for vacation rentals in Sampans is 33 days.
- Guests book furthest in advance for stays during December (average 69 days), likely coinciding with peak travel demand or local events.
- The shortest booking windows occur for stays in November (average 6 days), indicating more last-minute travel plans during this time.
- Seasonally, Summer (52 days avg.) sees the longest lead times, while Fall (16 days avg.) has the shortest, reflecting typical travel planning cycles.
Recommendations for Hosts
- Use the overall average lead time (33 days) as a baseline for your pricing and availability strategy in Sampans.
- For December stays, consider implementing length-of-stay discounts or slightly higher rates for bookings made less than 69 days out to capitalize on advance planning.
- During November, focus on last-minute booking availability and promotions, as guests book with very short notice (6 days avg.).
- Target marketing efforts for the Summer season well in advance (at least 52 days) to capture early planners.
- Monitor your own booking lead times against these Sampans averages to identify opportunities for dynamic pricing adjustments.
Popular & Essential Airbnb Amenities in Sampans (2026)
Amenity Prevalence
Amenity Insights for Sampans
- Essential amenities in Sampans that guests expect include: Free parking on premises. Lacking these (this) could significantly impact bookings.
- Popular amenities like Bed linens, Outdoor dining area, Wifi are common but not universal. Offering these can provide a competitive edge.
- Warning: Wifi is not universally provided but is considered essential globally. Ensure reliable Wifi is offered.
Recommendations for Hosts
- Ensure your listing includes all essential amenities for Sampans: Free parking on premises.
- Consider adding popular differentiators like Bed linens or Outdoor dining area to increase appeal.
- Highlight unique or less common amenities you offer (e.g., hot tub, dedicated workspace, EV charger) in your listing description and photos.
- Regularly check competitor amenities in Sampans to stay competitive.
Sampans Airbnb Guest Demographics & Profile Analysis (2026)
Guest Profile Summary for Sampans
- The typical guest profile for Airbnb in Sampans consists of a mix of domestic (53%) and international guests, often arriving from nearby Paris, typically belonging to the Post-2000s (Gen Z/Alpha) group (50%), primarily speaking English or French.
- Domestic travelers account for 53.4% of guests.
- Key international markets include France (53.4%) and Germany (18.3%).
- Top languages spoken are English (32.8%) followed by French (28.5%).
- A significant demographic segment is the Post-2000s (Gen Z/Alpha) group, representing 50% of guests.
Recommendations for Hosts
- Balance marketing efforts between domestic and international channels based on the guest mix.
- Tailor amenities and listing descriptions to appeal to the dominant Post-2000s (Gen Z/Alpha) demographic (e.g., highlight fast WiFi, smart home features, local guides).
- Highlight unique local experiences or amenities relevant to the primary guest profile.
- Consider seasonal promotions aligned with peak travel times for key origin markets.
Nearby Short-Term Rental Market Comparison
How does the Sampans Airbnb market stack up against its neighbors? Compare key performance metrics like average monthly revenue, ADR, and occupancy rates in surrounding areas to understand the broader regional STR landscape.
| Market | Active Properties | Monthly Revenue | Daily Rate | Avg. Occupancy |
|---|---|---|---|---|
| Épinac | 18 | $8,488 | $539.65 | 36% |
| La Rivière-Enverse | 18 | $4,591 | $674.42 | 37% |
| Saint-Trivier-sur-Moignans | 10 | $3,748 | $311.34 | 37% |
| La Forge | 13 | $3,208 | $339.73 | 41% |
| Bligny-lès-Beaune | 23 | $3,066 | $279.17 | 43% |
| Ventron | 84 | $3,064 | $290.20 | 38% |
| Liézey | 24 | $2,977 | $303.41 | 35% |
| Montriond | 177 | $2,913 | $398.08 | 36% |
| Juliénas | 17 | $2,882 | $244.93 | 43% |
| Puligny-Montrachet | 16 | $2,859 | $368.33 | 35% |