Caurel Airbnb Market Analysis 2026: Short Term Rental Data & Vacation Rental Statistics in Brittany, France
Is Airbnb profitable in Caurel in 2026? Explore comprehensive Airbnb analytics for Caurel, Brittany, France to uncover income potential. This 2026 STR market report for Caurel, based on AirROI data from February 2025 to January 2026, reveals key trends in the niche market of 24 active listings.
Whether you're considering an Airbnb investment in Caurel, optimizing your existing vacation rental, or exploring rental arbitrage opportunities, understanding the Caurel Airbnb data is crucial. Leveraging the low regulation environment is key to maximizing your short term rental income potential. Let's dive into the specifics.
Key Caurel Airbnb Performance Metrics Overview
Monthly Airbnb Revenue Variations & Income Potential in Caurel (2026)
Understanding the monthly revenue variations for Airbnb listings in Caurel is key to maximizing your short term rental income potential. Seasonality significantly impacts earnings. Our analysis, based on data from the past 12 months, shows that the peak revenue month for STRs in Caurel is typically August, while February often presents the lowest earnings, highlighting opportunities for strategic pricing adjustments during shoulder and low seasons. Explore the typical Airbnb income in Caurel across different performance tiers:
- Best-in-class properties (Top 10%) achieve $3,346+ monthly, often utilizing dynamic pricing and superior guest experiences.
- Strong performing properties (Top 25%) earn $1,775 or more, indicating effective management and desirable locations/amenities.
- Typical properties (Median) generate around $1,055 per month, representing the average market performance.
- Entry-level properties (Bottom 25%) see earnings around $538, often with potential for optimization.
Average Monthly Airbnb Earnings Trend in Caurel
Caurel Airbnb Occupancy Rate Trends (2026)
Maximize your bookings by understanding the Caurel STR occupancy trends. Seasonal demand shifts significantly influence how often properties are booked. Typically, Augustsees the highest demand (peak season occupancy), while February experiences the lowest (low season). Effective strategies, like adjusting minimum stays or offering promotions, can boost occupancy during slower periods. Here's how different property tiers perform in Caurel:
- Best-in-class properties (Top 10%) achieve 70%+ occupancy, indicating high desirability and potentially optimized availability.
- Strong performing properties (Top 25%) maintain 55% or higher occupancy, suggesting good market fit and guest satisfaction.
- Typical properties (Median) have an occupancy rate around 35%.
- Entry-level properties (Bottom 25%) average 19% occupancy, potentially facing higher vacancy.
Average Monthly Occupancy Rate Trend in Caurel
Average Daily Rate (ADR) Airbnb Trends in Caurel (2026)
Effective short term rental pricing strategy in Caurel involves understanding monthly ADR fluctuations. The Average Daily Rate (ADR) for Airbnb in Caurel typically peaks in August and dips lowest during January. Leveraging Airbnb dynamic pricing tools or strategies based on this seasonality can significantly boost revenue. Here's a look at the typical nightly rates achieved:
- Best-in-class properties (Top 10%) command rates of $162+ per night, often due to premium features or locations.
- Strong performing properties (Top 25%) achieve nightly rates of $127 or more.
- Typical properties (Median) charge around $98 per night.
- Entry-level properties (Bottom 25%) earn around $86 per night.
Average Daily Rate (ADR) Trend by Month in Caurel
Get Live Caurel Market Intelligence 👇

Explore Real-time Analytics
Airbnb Seasonality Analysis & Trends in Caurel (2026)
Peak Season (August, July, October)
- Revenue averages $2,242 per month
- Occupancy rates average 54.4%
- Daily rates average $127
Shoulder Season
- Revenue averages $1,404 per month
- Occupancy maintains around 33.3%
- Daily rates hold near $117
Low Season (February, April, December)
- Revenue drops to average $1,181 per month
- Occupancy decreases to average 29.8%
- Daily rates adjust to average $113
Seasonality Insights for Caurel
- The Airbnb seasonality in Caurel shows highly seasonal trends requiring careful strategy. While the sections above show seasonal averages, it's also insightful to look at the extremes:
- During the high season, the absolute peak month showcases Caurel's highest earning potential, with monthly revenues capable of climbing to $2,816, occupancy reaching a high of 68.1%, and ADRs peaking at $134.
- Conversely, the slowest single month of the year, typically falling within the low season, marks the market's lowest point. In this month, revenue might dip to $1,075, occupancy could drop to 26.6%, and ADRs may adjust down to $110.
- Understanding both the seasonal averages and these monthly peaks and troughs in revenue, occupancy, and ADR is crucial for maximizing your Airbnb profit potential in Caurel.
Seasonal Strategies for Maximizing Profit
- Peak Season: Maximize revenue through premium pricing and potentially longer minimum stays. Ensure high availability.
- Low Season: Offer competitive pricing, special promotions (e.g., extended stay discounts), and flexible cancellation policies. Target off-season travelers like remote workers or budget-conscious guests.
- Shoulder Seasons: Implement dynamic pricing that balances peak and low rates. Target weekend travelers or specific events. Offer slightly more flexible terms than peak season.
- Regularly analyze your own performance against these Caurel seasonality benchmarks and adjust your pricing and availability strategy accordingly.
Best Areas for Airbnb Investment in Caurel (2026)
Exploring the top neighborhoods for short-term rentals in Caurel? This section highlights key areas, outlining why they are attractive for hosts and guests, along with notable local attractions. Consider these locations based on your target guest profile and investment strategy.
| Neighborhood / Area | Why Host Here? (Target Guests & Appeal) | Key Attractions & Landmarks |
|---|---|---|
| Lac de Caurel | A picturesque lake surrounded by lush nature, perfect for outdoor activities like kayaking, fishing, and hiking. Attracts nature lovers and families looking for a serene getaway. | Lac de Caurel, Sentiers de randonnée, Pêche, Kayak, Baignade |
| La Chapelle Neuve | A charming village showcasing traditional Brittany architecture and culture. Ideal for tourists seeking an authentic local experience with quaint shops and cafes. | Église Saint-Maudez, Le Moulin de la Chapelle Neuve, Artisan shops, Local markets |
| Mur-de-Bretagne | Famous for stunning views and natural beauty, it’s a great spot for hiking and enjoying the rural landscape. Popular with travelers who enjoy scenic views and outdoor activities. | Lac de Guerlédan, Sentier du Rohan, Cycling routes, Nature reserves |
| Quénécan Forest | A vast and enchanting forest offering numerous walking trails and opportunities for bird watching. Attracts adventure seekers and families looking for outdoor recreation. | Forêt de Quénécan, Randonnée, Observation des oiseaux, Véloroutes |
| Bon Repos Abbey | A historical site with beautiful architecture and serene gardens, ideal for cultural tourism and historical appreciation. | Abbaye de Bon Repos, Jardins, Activités culturelles |
| Loudéac | A lively town with a blend of modern amenities and historical charm, offering access to various shops and eateries, ideal for those who prefer a more urban environment within Brittany. | Centre-ville animé, Restaurants, Marché local |
| Béganne | A serene and beautiful village known for its views of the Blavet River, great for relaxing retreats and nature exploration. | Rivière du Blavet, Pêche, Randonnées, Villages pittoresques |
| Mur-de-Bretagne Lake area | An area rich in aquatic activities and natural landscapes, ideal for families and ceux who appreciate leisure activities in a scenic setting. | Activités nautiques, Plages, Randonnées autour du lac |
Understanding Airbnb License Requirements & STR Laws in Caurel (2026)
While Caurel, Brittany, France currently shows low STR regulations, specific Airbnb license requirements might still exist or change. Always verify the latest short term rental regulations and Airbnb license requirements directly with local government authorities for Caurel to ensure full compliance before hosting.
(Source: AirROI data, 2026, based on 8% licensed listings)
Top Performing Airbnb Properties in Caurel (2026)
Benchmark your potential! Explore examples of top-performing Airbnb properties in Caurelbased on Trailing Twelve Month (TTM) revenue. Analyze their characteristics, revenue, occupancy rate, and ADR to understand what drives success in this market.
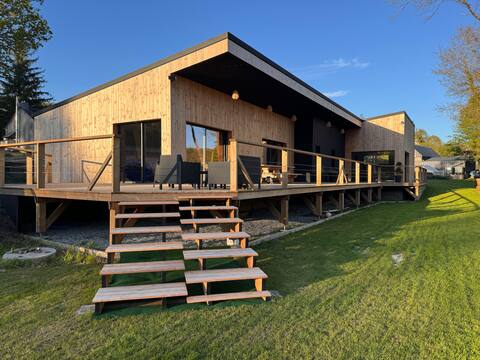
L'Antre de Kergoff
Entire Place • 3 bedrooms
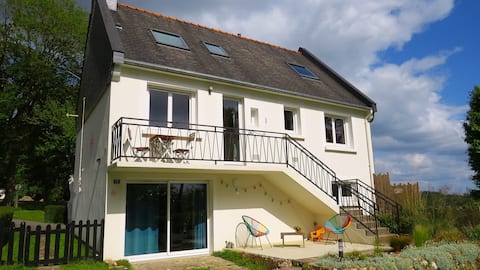
Roz Avel Gîte - Sauna & Lake Guerlédan Stay
Entire Place • 3 bedrooms
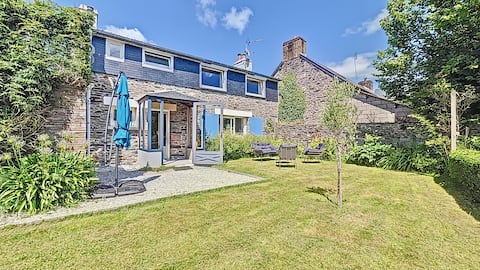
Along the water, 5 min walk to Lake Guerlédan
Entire Place • 3 bedrooms
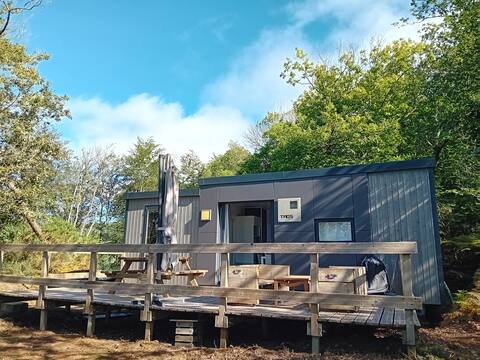
Guerledan lake view mobile home
Entire Place • 2 bedrooms
Gite du Lac in Caurel (6-7 people)
Entire Place • 3 bedrooms

Beautiful house in britain center : Guerledan lake
Entire Place • 2 bedrooms
Note: Performance varies based on location, size, amenities, seasonality, and management quality. Data reflects the past 12 months.
Top Performing Airbnb Hosts in Caurel (2026)
Learn from the best! This table showcases top-performing Airbnb hosts in Caurel based on the number of properties managed and estimated total revenue over the past year. Analyze their scale and performance metrics.
| Host Name | Properties | Grossing Revenue | Stay Reviews | Avg Rating |
|---|---|---|---|---|
| Le Bourhis | 1 | $88,654 | 28 | 5.00/5.0 |
| Sandrine | 2 | $30,959 | 463 | 4.92/5.0 |
| Dominique | 1 | $25,850 | 53 | 5.00/5.0 |
| Rosana Et Larry | 4 | $24,336 | 28 | 4.91/5.0 |
| Nathalie | 1 | $19,954 | 32 | 4.88/5.0 |
| Helene | 1 | $18,519 | 54 | 4.98/5.0 |
| Yannick | 2 | $17,178 | 45 | 4.77/5.0 |
| Yo | 1 | $11,938 | 23 | 4.78/5.0 |
| Régis | 1 | $10,237 | 52 | 4.58/5.0 |
| Jeannine | 2 | $9,814 | 34 | 4.70/5.0 |
Analyzing the strategies of top hosts, such as their property selection, pricing, and guest communication, can offer valuable lessons for optimizing your own Airbnb operations in Caurel.
Dive Deeper: Advanced Caurel STR Market Data (2026)
Ready to unlock more insights? AirROI provides access to advanced metrics and comprehensive Airbnb data for Caurel. Explore detailed analytics beyond this report to refine your investment strategy, optimize pricing, and maximize your vacation rental profits.
Explore Advanced MetricsCaurel Short-Term Rental Market Composition (2026): Property & Room Types
Room Type Distribution
Property Type Distribution
Market Composition Insights for Caurel
- The Caurel Airbnb market composition is heavily skewed towards Entire Home/Apt listings, which make up 75% of the 24 active rentals. This indicates strong guest preference for privacy and space.
- Looking at the property type distribution in Caurel, House properties are the most common (66.7%), reflecting the local real estate landscape.
- Houses represent a significant 66.7% portion, catering likely to families or larger groups.
- The presence of 16.7% Hotel/Boutique listings indicates integration with traditional hospitality.
- Smaller segments like others (combined 4.2%) offer potential for unique stay experiences.
Caurel Airbnb Room Capacity Analysis (2026): Bedroom Distribution
Distribution of Listings by Number of Bedrooms
Room Capacity Insights for Caurel
- The dominant room capacity in Caurel is 2 bedrooms listings, making up 45.8% of the market. This suggests a strong demand for properties suitable for couples or solo travelers.
- Together, 2 bedrooms and 3 bedrooms properties represent 79.1% of the active Airbnb listings in Caurel, indicating a high concentration in these sizes.
- A significant 33.3% of listings offer 3+ bedrooms, catering to larger groups and families seeking more space in Caurel.
Caurel Vacation Rental Guest Capacity Trends (2026)
Distribution of Listings by Guest Capacity
Guest Capacity Insights for Caurel
- The most common guest capacity trend in Caurel vacation rentals is listings accommodating 4 guests (41.7%). This suggests the primary traveler segment is likely small families or groups.
- Properties designed for 4 guests and 6 guests dominate the Caurel STR market, accounting for 62.5% of listings.
- 37.4% of properties accommodate 6+ guests, serving the market segment for larger families or group travel in Caurel.
- On average, properties in Caurel are equipped to host 4.6 guests.
Caurel Airbnb Booking Patterns (2026): Available vs. Booked Days
Available Days Distribution
Booked Days Distribution
Booking Pattern Insights for Caurel
- The most common availability pattern in Caurel falls within the 271-366 days range, representing 62.5% of listings. This suggests many properties have significant open periods on their calendars.
- Approximately 79.2% of listings show high availability (181+ days open annually), indicating potential for increased bookings or specific owner usage patterns.
- For booked days, the 31-90 days range is most frequent in Caurel (45.8%), reflecting common guest stay durations or potential owner blocking patterns.
- A notable 20.8% of properties secure long booking periods (181+ days booked per year), highlighting successful long-term rental strategies or significant owner usage.
Caurel Airbnb Minimum Stay Requirements Analysis
Distribution of Listings by Minimum Night Requirement
1 Night
5 listings
20.8% of total
2 Nights
7 listings
29.2% of total
3 Nights
1 listings
4.2% of total
4-6 Nights
3 listings
12.5% of total
30+ Nights
8 listings
33.3% of total
Key Insights
- The most prevalent minimum stay requirement in Caurel is 30+ Nights, adopted by 33.3% of listings. This highlights the market's preference for longer commitments.
- A significant segment (33.3%) caters to monthly stays (30+ nights) in Caurel, pointing to opportunities in the extended-stay market.
Recommendations
- Align with the market by considering a 30+ Nights minimum stay, as 33.3% of Caurel hosts use this setting.
- If feasible, allowing 1-night stays, especially midweek or during low season, could capture last-minute bookings, as only 20.8% currently do.
- Explore offering discounts for stays of 30+ nights to attract the 33.3% of the market seeking extended stays.
- Adjust minimum nights based on seasonality – potentially shorter during low season and longer during peak demand periods in Caurel.
Caurel Airbnb Cancellation Policy Trends Analysis (2026)
Flexible
4 listings
16.7% of total
Moderate
6 listings
25% of total
Firm
12 listings
50% of total
Strict
2 listings
8.3% of total
Cancellation Policy Insights for Caurel
- The prevailing Airbnb cancellation policy trend in Caurel is Firm, used by 50% of listings.
- A majority (58.3%) of hosts in Caurel utilize Firm or Strict policies, indicating a market where hosts prioritize booking security.
- Strict cancellation policies are quite rare (8.3%), potentially making listings with this policy less competitive unless justified by high demand or property type.
Recommendations for Hosts
- Consider adopting a Firm policy to align with the 50% market standard in Caurel.
- Using a Strict policy might deter some guests, as only 8.3% of listings use it. Evaluate if potential revenue protection outweighs possible lower booking rates.
- Regularly review your cancellation policy against competitors and market demand shifts in Caurel.
Caurel STR Booking Lead Time Analysis (2026)
Average Booking Lead Time by Month
Booking Lead Time Insights for Caurel
- The overall average booking lead time for vacation rentals in Caurel is 52 days.
- Guests book furthest in advance for stays during July (average 84 days), likely coinciding with peak travel demand or local events.
- The shortest booking windows occur for stays in January (average 4 days), indicating more last-minute travel plans during this time.
- Seasonally, Summer (81 days avg.) sees the longest lead times, while Winter (16 days avg.) has the shortest, reflecting typical travel planning cycles.
Recommendations for Hosts
- Use the overall average lead time (52 days) as a baseline for your pricing and availability strategy in Caurel.
- For July stays, consider implementing length-of-stay discounts or slightly higher rates for bookings made less than 84 days out to capitalize on advance planning.
- During January, focus on last-minute booking availability and promotions, as guests book with very short notice (4 days avg.).
- Target marketing efforts for the Summer season well in advance (at least 81 days) to capture early planners.
- Monitor your own booking lead times against these Caurel averages to identify opportunities for dynamic pricing adjustments.
Popular & Essential Airbnb Amenities in Caurel (2026)
Amenity Prevalence
Amenity Insights for Caurel
- Essential amenities in Caurel that guests expect include: Refrigerator, Coffee maker, Heating, Smoke alarm. Lacking these (any) could significantly impact bookings.
- Popular amenities like Dishes and silverware, Free parking on premises, Microwave are common but not universal. Offering these can provide a competitive edge.
Recommendations for Hosts
- Ensure your listing includes all essential amenities for Caurel: Refrigerator, Coffee maker, Heating, Smoke alarm.
- Prioritize adding missing essentials: Heating, Smoke alarm.
- Consider adding popular differentiators like Dishes and silverware or Free parking on premises to increase appeal.
- Highlight unique or less common amenities you offer (e.g., hot tub, dedicated workspace, EV charger) in your listing description and photos.
- Regularly check competitor amenities in Caurel to stay competitive.
Caurel Airbnb Guest Demographics & Profile Analysis (2026)
Guest Profile Summary for Caurel
- The typical guest profile for Airbnb in Caurel consists of primarily domestic travelers (90%), often arriving from nearby Rennes, typically belonging to the Post-2000s (Gen Z/Alpha) group (50%), primarily speaking French or English.
- Domestic travelers account for 89.5% of guests.
- Key international markets include France (89.5%) and United Kingdom (5.6%).
- Top languages spoken are French (48.6%) followed by English (35.7%).
- A significant demographic segment is the Post-2000s (Gen Z/Alpha) group, representing 50% of guests.
Recommendations for Hosts
- Target domestic marketing efforts towards travelers from Rennes and Nantes.
- Tailor amenities and listing descriptions to appeal to the dominant Post-2000s (Gen Z/Alpha) demographic (e.g., highlight fast WiFi, smart home features, local guides).
- Highlight unique local experiences or amenities relevant to the primary guest profile.
- Consider seasonal promotions aligned with peak travel times for key origin markets.
Nearby Short-Term Rental Market Comparison
How does the Caurel Airbnb market stack up against its neighbors? Compare key performance metrics like average monthly revenue, ADR, and occupancy rates in surrounding areas to understand the broader regional STR landscape.
| Market | Active Properties | Monthly Revenue | Daily Rate | Avg. Occupancy |
|---|---|---|---|---|
| St Martin | 13 | $4,259 | $494.81 | 46% |
| Donges | 12 | $3,715 | $297.19 | 43% |
| Vale | 12 | $3,196 | $236.67 | 55% |
| St Clement | 17 | $2,929 | $242.25 | 57% |
| St Helier | 61 | $2,757 | $256.82 | 56% |
| St Ouen | 14 | $2,690 | $441.20 | 43% |
| Grouville | 18 | $2,659 | $198.18 | 55% |
| Castel | 15 | $2,562 | $203.72 | 59% |
| St Martin | 15 | $2,505 | $231.10 | 50% |
| Lanmodez | 18 | $2,492 | $234.53 | 40% |