Lorient Airbnb Market Analysis 2026: Short Term Rental Data & Vacation Rental Statistics in Brittany, France
Is Airbnb profitable in Lorient in 2026? Explore comprehensive Airbnb analytics for Lorient, Brittany, France to uncover income potential. This 2026 STR market report for Lorient, based on AirROI data from February 2025 to January 2026, reveals key trends in the market of 565 active listings.
Whether you're considering an Airbnb investment in Lorient, optimizing your existing vacation rental, or exploring rental arbitrage opportunities, understanding the Lorient Airbnb data is crucial. Navigating the high regulation landscape is key to maximizing your short term rental income potential. Let's dive into the specifics.
Key Lorient Airbnb Performance Metrics Overview
Monthly Airbnb Revenue Variations & Income Potential in Lorient (2026)
Understanding the monthly revenue variations for Airbnb listings in Lorient is key to maximizing your short term rental income potential. Seasonality significantly impacts earnings. Our analysis, based on data from the past 12 months, shows that the peak revenue month for STRs in Lorient is typically August, while January often presents the lowest earnings, highlighting opportunities for strategic pricing adjustments during shoulder and low seasons. Explore the typical Airbnb income in Lorient across different performance tiers:
- Best-in-class properties (Top 10%) achieve $2,238+ monthly, often utilizing dynamic pricing and superior guest experiences.
- Strong performing properties (Top 25%) earn $1,522 or more, indicating effective management and desirable locations/amenities.
- Typical properties (Median) generate around $923 per month, representing the average market performance.
- Entry-level properties (Bottom 25%) see earnings around $475, often with potential for optimization.
Average Monthly Airbnb Earnings Trend in Lorient
Lorient Airbnb Occupancy Rate Trends (2026)
Maximize your bookings by understanding the Lorient STR occupancy trends. Seasonal demand shifts significantly influence how often properties are booked. Typically, Augustsees the highest demand (peak season occupancy), while January experiences the lowest (low season). Effective strategies, like adjusting minimum stays or offering promotions, can boost occupancy during slower periods. Here's how different property tiers perform in Lorient:
- Best-in-class properties (Top 10%) achieve 81%+ occupancy, indicating high desirability and potentially optimized availability.
- Strong performing properties (Top 25%) maintain 65% or higher occupancy, suggesting good market fit and guest satisfaction.
- Typical properties (Median) have an occupancy rate around 41%.
- Entry-level properties (Bottom 25%) average 20% occupancy, potentially facing higher vacancy.
Average Monthly Occupancy Rate Trend in Lorient
Average Daily Rate (ADR) Airbnb Trends in Lorient (2026)
Effective short term rental pricing strategy in Lorient involves understanding monthly ADR fluctuations. The Average Daily Rate (ADR) for Airbnb in Lorient typically peaks in August and dips lowest during March. Leveraging Airbnb dynamic pricing tools or strategies based on this seasonality can significantly boost revenue. Here's a look at the typical nightly rates achieved:
- Best-in-class properties (Top 10%) command rates of $175+ per night, often due to premium features or locations.
- Strong performing properties (Top 25%) achieve nightly rates of $114 or more.
- Typical properties (Median) charge around $79 per night.
- Entry-level properties (Bottom 25%) earn around $58 per night.
Average Daily Rate (ADR) Trend by Month in Lorient
Get Live Lorient Market Intelligence 👇

Explore Real-time Analytics
Airbnb Seasonality Analysis & Trends in Lorient (2026)
Peak Season (August, July, September)
- Revenue averages $1,604 per month
- Occupancy rates average 48.0%
- Daily rates average $108
Shoulder Season
- Revenue averages $1,052 per month
- Occupancy maintains around 41.7%
- Daily rates hold near $100
Low Season (January, February, March)
- Revenue drops to average $862 per month
- Occupancy decreases to average 41.6%
- Daily rates adjust to average $96
Seasonality Insights for Lorient
- The Airbnb seasonality in Lorient shows highly seasonal trends requiring careful strategy. While the sections above show seasonal averages, it's also insightful to look at the extremes:
- During the high season, the absolute peak month showcases Lorient's highest earning potential, with monthly revenues capable of climbing to $1,930, occupancy reaching a high of 52.1%, and ADRs peaking at $113.
- Conversely, the slowest single month of the year, typically falling within the low season, marks the market's lowest point. In this month, revenue might dip to $773, occupancy could drop to 33.8%, and ADRs may adjust down to $94.
- Understanding both the seasonal averages and these monthly peaks and troughs in revenue, occupancy, and ADR is crucial for maximizing your Airbnb profit potential in Lorient.
Seasonal Strategies for Maximizing Profit
- Peak Season: Maximize revenue through premium pricing and potentially longer minimum stays. Ensure high availability.
- Low Season: Offer competitive pricing, special promotions (e.g., extended stay discounts), and flexible cancellation policies. Target off-season travelers like remote workers or budget-conscious guests.
- Shoulder Seasons: Implement dynamic pricing that balances peak and low rates. Target weekend travelers or specific events. Offer slightly more flexible terms than peak season.
- Regularly analyze your own performance against these Lorient seasonality benchmarks and adjust your pricing and availability strategy accordingly.
Best Areas for Airbnb Investment in Lorient (2026)
Exploring the top neighborhoods for short-term rentals in Lorient? This section highlights key areas, outlining why they are attractive for hosts and guests, along with notable local attractions. Consider these locations based on your target guest profile and investment strategy.
| Neighborhood / Area | Why Host Here? (Target Guests & Appeal) | Key Attractions & Landmarks |
|---|---|---|
| Cité de la Voile Eric Tabarly | A modern maritime complex dedicated to sailing, attracting boating enthusiasts and tourists interested in maritime culture and activities. | Sailing shows, Boating events, Exhibitions on maritime history |
| Port de pêche de Lorient | A lively fishing port that offers a glimpse into local life, as well as access to fresh seafood and beautiful harbor views. | Fresh seafood markets, Fishing tours, Seaside restaurants |
| Plage de Kerguélen | A beautiful beach area that attracts sunbathers and water sports enthusiasts. Perfect for family vacations and summer tourism. | Sunbathing, Water sports, Walking trails along the coast |
| Lorient Festival Interceltique | Known for its annual Celtic festival, attracting visitors from all over the world who are interested in Celtic culture and music. | Celtic music concerts, Cultural exhibitions, Workshops |
| Centre-Ville de Lorient | The city center features shops, cafés, and cultural sites, making it ideal for tourists who want to explore local life and culture. | Shopping, Local cafés, Cultural sites and museums |
| Île de Groix | An accessible island with beautiful landscapes and beaches, popular for day trips and natural exploration. | Beaches, Hiking trails, Island tours |
| Parc des Expositions de Lorient | A major event center that hosts various events and exhibitions, drawing business travelers and event attendees year-round. | Trade shows, Exhibitions, Conventions |
| Lorient submarine base | A historic submarine base that has been transformed into a cultural space, attracting history buffs and tourists interested in military history. | Historical tours, Cultural exhibitions, Art installations |
Understanding Airbnb License Requirements & STR Laws in Lorient (2026)
Yes, Lorient, Brittany, France enforces high STR regulations. Obtaining a license and ensuring compliance is almost certainly required according to current 2026 STR laws. Always verify the latest short term rental regulations and Airbnb license requirements directly with local government authorities for Lorient to ensure full compliance before hosting.
(Source: AirROI data, 2026, based on 75% licensed listings)
Top Performing Airbnb Properties in Lorient (2026)
Benchmark your potential! Explore examples of top-performing Airbnb properties in Lorientbased on Trailing Twelve Month (TTM) revenue. Analyze their characteristics, revenue, occupancy rate, and ADR to understand what drives success in this market.

Urban Jungle
Entire Place • 3 bedrooms
La Dolce Vita - Toulliou
Entire Place • 4 bedrooms
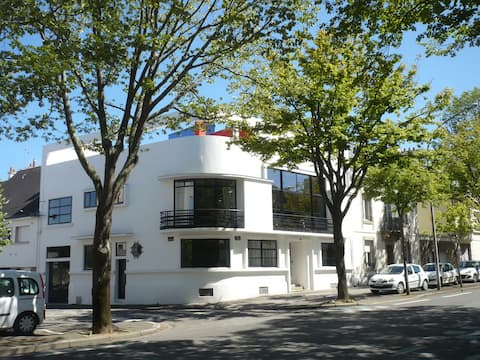
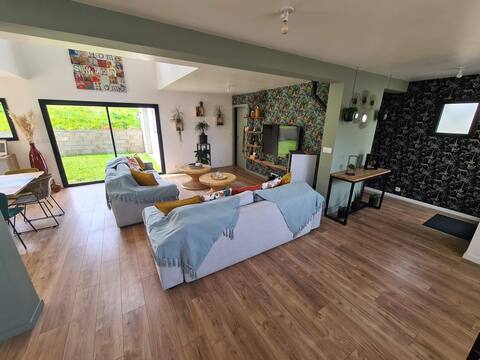
Lorient center, large art deco house with spa
Entire Place • 8 bedrooms

La maison du monde - near train station
Entire Place • 5 bedrooms

Le Loft, Lorient center, jacuzzi and cinema room
Entire Place • 4 bedrooms

Bright 2-bedroom apartment in the heart of Lorient - Everything within walking distance
Entire Place • 2 bedrooms
Note: Performance varies based on location, size, amenities, seasonality, and management quality. Data reflects the past 12 months.
Top Performing Airbnb Hosts in Lorient (2026)
Learn from the best! This table showcases top-performing Airbnb hosts in Lorient based on the number of properties managed and estimated total revenue over the past year. Analyze their scale and performance metrics.
| Host Name | Properties | Grossing Revenue | Stay Reviews | Avg Rating |
|---|---|---|---|---|
| Groom | 16 | $297,670 | 990 | 4.91/5.0 |
| Corinne | 13 | $162,117 | 1618 | 4.74/5.0 |
| Ulrich | 10 | $158,562 | 742 | 4.82/5.0 |
| Nathalie | 9 | $136,007 | 746 | 4.72/5.0 |
| Locly | 16 | $117,806 | 485 | 4.20/5.0 |
| Albert | 10 | $106,878 | 77 | 4.50/5.0 |
| Morgane | 5 | $79,741 | 106 | 4.69/5.0 |
| Sci Du Bonhomme | 3 | $68,830 | 168 | 4.81/5.0 |
| Vanessa & Ludovic | 5 | $68,764 | 433 | 4.96/5.0 |
| Marc-ANTOINE | 2 | $67,210 | 64 | 4.89/5.0 |
Analyzing the strategies of top hosts, such as their property selection, pricing, and guest communication, can offer valuable lessons for optimizing your own Airbnb operations in Lorient.
Dive Deeper: Advanced Lorient STR Market Data (2026)
Ready to unlock more insights? AirROI provides access to advanced metrics and comprehensive Airbnb data for Lorient. Explore detailed analytics beyond this report to refine your investment strategy, optimize pricing, and maximize your vacation rental profits.
Explore Advanced MetricsLorient Short-Term Rental Market Composition (2026): Property & Room Types
Room Type Distribution
Property Type Distribution
Market Composition Insights for Lorient
- The Lorient Airbnb market composition is heavily skewed towards Entire Home/Apt listings, which make up 83.7% of the 565 active rentals. This indicates strong guest preference for privacy and space.
- Looking at the property type distribution in Lorient, Apartment/Condo properties are the most common (76.5%), reflecting the local real estate landscape.
- Houses represent a significant 19.1% portion, catering likely to families or larger groups.
- Smaller segments like hotel/boutique, outdoor/unique, others (combined 4.4%) offer potential for unique stay experiences.
Lorient Airbnb Room Capacity Analysis (2026): Bedroom Distribution
Distribution of Listings by Number of Bedrooms
Room Capacity Insights for Lorient
- The dominant room capacity in Lorient is 1 bedroom listings, making up 37.2% of the market. This suggests a strong demand for properties suitable for couples or solo travelers.
- Together, 1 bedroom and 2 bedrooms properties represent 57.6% of the active Airbnb listings in Lorient, indicating a high concentration in these sizes.
Lorient Vacation Rental Guest Capacity Trends (2026)
Distribution of Listings by Guest Capacity
Guest Capacity Insights for Lorient
- The most common guest capacity trend in Lorient vacation rentals is listings accommodating 2 guests (34.2%). This suggests the primary traveler segment is likely couples or solo travelers.
- Properties designed for 2 guests and 4 guests dominate the Lorient STR market, accounting for 61.3% of listings.
- 16.8% of properties accommodate 6+ guests, serving the market segment for larger families or group travel in Lorient.
- On average, properties in Lorient are equipped to host 3.1 guests.
Lorient Airbnb Booking Patterns (2026): Available vs. Booked Days
Available Days Distribution
Booked Days Distribution
Booking Pattern Insights for Lorient
- The most common availability pattern in Lorient falls within the 271-366 days range, representing 56.1% of listings. This suggests many properties have significant open periods on their calendars.
- Approximately 83.5% of listings show high availability (181+ days open annually), indicating potential for increased bookings or specific owner usage patterns.
- For booked days, the 31-90 days range is most frequent in Lorient (34.5%), reflecting common guest stay durations or potential owner blocking patterns.
- A notable 16.6% of properties secure long booking periods (181+ days booked per year), highlighting successful long-term rental strategies or significant owner usage.
Lorient Airbnb Minimum Stay Requirements Analysis
Distribution of Listings by Minimum Night Requirement
1 Night
124 listings
21.9% of total
2 Nights
120 listings
21.2% of total
3 Nights
25 listings
4.4% of total
4-6 Nights
55 listings
9.7% of total
7-29 Nights
14 listings
2.5% of total
30+ Nights
227 listings
40.2% of total
Key Insights
- The most prevalent minimum stay requirement in Lorient is 30+ Nights, adopted by 40.2% of listings. This highlights the market's preference for longer commitments.
- A significant segment (40.2%) caters to monthly stays (30+ nights) in Lorient, pointing to opportunities in the extended-stay market.
Recommendations
- Align with the market by considering a 30+ Nights minimum stay, as 40.2% of Lorient hosts use this setting.
- If feasible, allowing 1-night stays, especially midweek or during low season, could capture last-minute bookings, as only 21.9% currently do.
- Explore offering discounts for stays of 30+ nights to attract the 40.2% of the market seeking extended stays.
- Adjust minimum nights based on seasonality – potentially shorter during low season and longer during peak demand periods in Lorient.
Lorient Airbnb Cancellation Policy Trends Analysis (2026)
Limited
7 listings
1.2% of total
Flexible
200 listings
35.5% of total
Moderate
214 listings
38% of total
Firm
109 listings
19.4% of total
Strict
33 listings
5.9% of total
Cancellation Policy Insights for Lorient
- The prevailing Airbnb cancellation policy trend in Lorient is Moderate, used by 38% of listings.
- The market strongly favors guest-friendly terms, with 73.5% of listings offering Flexible or Moderate policies. This suggests guests in Lorient may expect booking flexibility.
- Strict cancellation policies are quite rare (5.9%), potentially making listings with this policy less competitive unless justified by high demand or property type.
Recommendations for Hosts
- Consider adopting a Moderate policy to align with the 38% market standard in Lorient.
- Using a Strict policy might deter some guests, as only 5.9% of listings use it. Evaluate if potential revenue protection outweighs possible lower booking rates.
- Regularly review your cancellation policy against competitors and market demand shifts in Lorient.
Lorient STR Booking Lead Time Analysis (2026)
Average Booking Lead Time by Month
Booking Lead Time Insights for Lorient
- The overall average booking lead time for vacation rentals in Lorient is 46 days.
- Guests book furthest in advance for stays during August (average 66 days), likely coinciding with peak travel demand or local events.
- The shortest booking windows occur for stays in February (average 19 days), indicating more last-minute travel plans during this time.
- Seasonally, Summer (52 days avg.) sees the longest lead times, while Winter (20 days avg.) has the shortest, reflecting typical travel planning cycles.
Recommendations for Hosts
- Use the overall average lead time (46 days) as a baseline for your pricing and availability strategy in Lorient.
- For August stays, consider implementing length-of-stay discounts or slightly higher rates for bookings made less than 66 days out to capitalize on advance planning.
- Target marketing efforts for the Summer season well in advance (at least 52 days) to capture early planners.
- Monitor your own booking lead times against these Lorient averages to identify opportunities for dynamic pricing adjustments.
Popular & Essential Airbnb Amenities in Lorient (2026)
Amenity Prevalence
Amenity Insights for Lorient
- Popular amenities like Kitchen, Wifi, Smoke alarm are common but not universal. Offering these can provide a competitive edge.
- Warning: Wifi is not universally provided but is considered essential globally. Ensure reliable Wifi is offered.
Recommendations for Hosts
- Consider adding popular differentiators like Kitchen or Wifi to increase appeal.
- Highlight unique or less common amenities you offer (e.g., hot tub, dedicated workspace, EV charger) in your listing description and photos.
- Regularly check competitor amenities in Lorient to stay competitive.
Lorient Airbnb Guest Demographics & Profile Analysis (2026)
Guest Profile Summary for Lorient
- The typical guest profile for Airbnb in Lorient consists of primarily domestic travelers (90%), often arriving from nearby Paris, typically belonging to the Post-2000s (Gen Z/Alpha) group (50%), primarily speaking French or English.
- Domestic travelers account for 90.2% of guests.
- Key international markets include France (90.2%) and Germany (1.2%).
- Top languages spoken are French (45.2%) followed by English (32.5%).
- A significant demographic segment is the Post-2000s (Gen Z/Alpha) group, representing 50% of guests.
Recommendations for Hosts
- Target domestic marketing efforts towards travelers from Paris and Rennes.
- Tailor amenities and listing descriptions to appeal to the dominant Post-2000s (Gen Z/Alpha) demographic (e.g., highlight fast WiFi, smart home features, local guides).
- Highlight unique local experiences or amenities relevant to the primary guest profile.
- Consider seasonal promotions aligned with peak travel times for key origin markets.
Nearby Short-Term Rental Market Comparison
How does the Lorient Airbnb market stack up against its neighbors? Compare key performance metrics like average monthly revenue, ADR, and occupancy rates in surrounding areas to understand the broader regional STR landscape.
| Market | Active Properties | Monthly Revenue | Daily Rate | Avg. Occupancy |
|---|---|---|---|---|
| Donges | 12 | $3,715 | $297.19 | 43% |
| Lanmodez | 18 | $2,492 | $234.53 | 40% |
| Île-de-Bréhat | 49 | $2,373 | $230.16 | 45% |
| Plélan-le-Petit | 13 | $2,358 | $204.12 | 39% |
| Île-Molène | 11 | $2,158 | $123.01 | 67% |
| Guégon | 11 | $2,017 | $141.78 | 52% |
| Herbignac | 43 | $1,934 | $209.78 | 36% |
| Caden | 28 | $1,892 | $201.40 | 36% |
| Guern | 12 | $1,803 | $117.23 | 42% |
| Sainte-Brigitte | 10 | $1,801 | $178.03 | 34% |