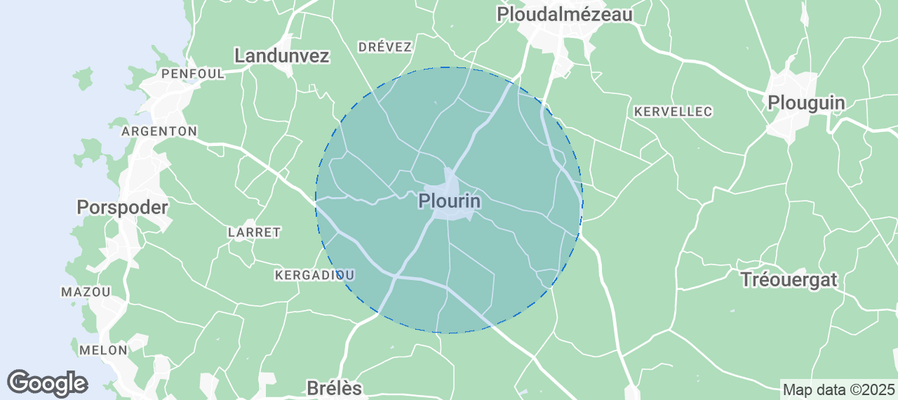
Plourin Airbnb Market Analysis 2026: Short Term Rental Data & Vacation Rental Statistics in Brittany, France
Is Airbnb profitable in Plourin in 2026? Explore comprehensive Airbnb analytics for Plourin, Brittany, France to uncover income potential. This 2026 STR market report for Plourin, based on AirROI data from March 2024 to February 2025, reveals key trends in the niche market of 17 active listings.
Whether you're considering an Airbnb investment in Plourin, optimizing your existing vacation rental, or exploring rental arbitrage opportunities, understanding the Plourin Airbnb data is crucial. Navigating the high regulation landscape is key to maximizing your short term rental income potential. Let's dive into the specifics.
Key Plourin Airbnb Performance Metrics Overview
Monthly Airbnb Revenue Variations & Income Potential in Plourin (2026)
Understanding the monthly revenue variations for Airbnb listings in Plourin is key to maximizing your short term rental income potential. Seasonality significantly impacts earnings. Our analysis, based on data from the past 12 months, shows that the peak revenue month for STRs in Plourin is typically August, while February often presents the lowest earnings, highlighting opportunities for strategic pricing adjustments during shoulder and low seasons. Explore the typical Airbnb income in Plourin across different performance tiers:
- Best-in-class properties (Top 10%) achieve $6,827+ monthly, often utilizing dynamic pricing and superior guest experiences.
- Strong performing properties (Top 25%) earn $2,747 or more, indicating effective management and desirable locations/amenities.
- Typical properties (Median) generate around $1,557 per month, representing the average market performance.
- Entry-level properties (Bottom 25%) see earnings around $881, often with potential for optimization.
Average Monthly Airbnb Earnings Trend in Plourin
Plourin Airbnb Occupancy Rate Trends (2026)
Maximize your bookings by understanding the Plourin STR occupancy trends. Seasonal demand shifts significantly influence how often properties are booked. Typically, Augustsees the highest demand (peak season occupancy), while February experiences the lowest (low season). Effective strategies, like adjusting minimum stays or offering promotions, can boost occupancy during slower periods. Here's how different property tiers perform in Plourin:
- Best-in-class properties (Top 10%) achieve 69%+ occupancy, indicating high desirability and potentially optimized availability.
- Strong performing properties (Top 25%) maintain 56% or higher occupancy, suggesting good market fit and guest satisfaction.
- Typical properties (Median) have an occupancy rate around 40%.
- Entry-level properties (Bottom 25%) average 26% occupancy, potentially facing higher vacancy.
Average Monthly Occupancy Rate Trend in Plourin
Average Daily Rate (ADR) Airbnb Trends in Plourin (2026)
Effective short term rental pricing strategy in Plourin involves understanding monthly ADR fluctuations. The Average Daily Rate (ADR) for Airbnb in Plourin typically peaks in July and dips lowest during February. Leveraging Airbnb dynamic pricing tools or strategies based on this seasonality can significantly boost revenue. Here's a look at the typical nightly rates achieved:
- Best-in-class properties (Top 10%) command rates of $389+ per night, often due to premium features or locations.
- Strong performing properties (Top 25%) achieve nightly rates of $172 or more.
- Typical properties (Median) charge around $113 per night.
- Entry-level properties (Bottom 25%) earn around $78 per night.
Average Daily Rate (ADR) Trend by Month in Plourin
Get Live Plourin Market Intelligence 👇
Explore Real-time Analytics
Airbnb Seasonality Analysis & Trends in Plourin (2025)
Peak Season (August, May, January)
- Revenue averages $3,671 per month
- Occupancy rates average 57.2%
- Daily rates average $165
Shoulder Season
- Revenue averages $2,506 per month
- Occupancy maintains around 42.2%
- Daily rates hold near $165
Low Season (February, April, October)
- Revenue drops to average $1,589 per month
- Occupancy decreases to average 27.6%
- Daily rates adjust to average $161
Seasonality Insights for Plourin
- The Airbnb seasonality in Plourin shows highly seasonal trends requiring careful strategy. While the sections above show seasonal averages, it's also insightful to look at the extremes:
- During the high season, the absolute peak month showcases Plourin's highest earning potential, with monthly revenues capable of climbing to $4,448, occupancy reaching a high of 85.5%, and ADRs peaking at $175.
- Conversely, the slowest single month of the year, typically falling within the low season, marks the market's lowest point. In this month, revenue might dip to $1,358, occupancy could drop to 22.0%, and ADRs may adjust down to $155.
- Understanding both the seasonal averages and these monthly peaks and troughs in revenue, occupancy, and ADR is crucial for maximizing your Airbnb profit potential in Plourin.
Seasonal Strategies for Maximizing Profit
- Peak Season: Maximize revenue through premium pricing and potentially longer minimum stays. Ensure high availability.
- Low Season: Offer competitive pricing, special promotions (e.g., extended stay discounts), and flexible cancellation policies. Target off-season travelers like remote workers or budget-conscious guests.
- Shoulder Seasons: Implement dynamic pricing that balances peak and low rates. Target weekend travelers or specific events. Offer slightly more flexible terms than peak season.
- Regularly analyze your own performance against these Plourin seasonality benchmarks and adjust your pricing and availability strategy accordingly.
Best Areas for Airbnb Investment in Plourin (2026)
Exploring the top neighborhoods for short-term rentals in Plourin? This section highlights key areas, outlining why they are attractive for hosts and guests, along with notable local attractions. Consider these locations based on your target guest profile and investment strategy.
| Neighborhood / Area | Why Host Here? (Target Guests & Appeal) | Key Attractions & Landmarks |
|---|---|---|
| Centre Ville de Plourin | The heart of Plourin with charming streets and local shops. It's ideal for guests looking to experience the local culture and cuisine of Brittany. | Church of Saint-Cadou, Château de Kerjean, Local markets, Cafés and bistros, Art galleries |
| Plage de Kerfissien | A beautiful beach area perfect for seaside retreats. Ideal for families and couples looking for a relaxing getaway with beach access. | Kerfissien Beach, Coastal walking trails, Water sports activities, Seaside restaurants, Scenic viewpoints |
| Rives d'Elorn | A scenic riverside area offering picturesque views and tranquility. Great for nature lovers and those wanting to escape the hustle and bustle. | Elorn River trails, Nature parks, Fishing spots, Picnic areas, Cycling paths |
| Les Terres de Saint-Herbot | A rural area with stunning landscapes, ideal for travelers seeking serenity and natural beauty. | Saint-Herbot Chapel, Hiking trails, Picnic spots, Flora and fauna, Local farms |
| L'abbaye de Daoulas | Historical site with a serene environment, appealing to guests interested in history and culture. | Daoulas Abbey, Gardens, Cultural events, Historical exhibitions, Trekking routes |
| Goulet de Brest | A lively port area with a blend of maritime charm and urban buzz. Popular with tourists exploring the coast and enjoying seafood. | Brest harbor, Maritime Museum, Restaurants and bars, Sightseeing cruises, Coastal walks |
| Les Monts d'Arrée | A mountainous area great for hiking and enjoying breathtaking views. Attractive for outdoor enthusiasts and adventure seekers. | Mountains, Hiking trails, Scenic viewpoints, Local wildlife, Traditional villages |
| Locquirec | A coastal village known for its beauty and tranquility. A perfect spot for guests wanting to relax by the sea and explore local culture. | Locquirec Beach, Coastal paths, Local restaurants, Historic architecture, Fishing opportunities |
Understanding Airbnb License Requirements & STR Laws in Plourin (2026)
Yes, Plourin, Brittany, France enforces high STR regulations. Obtaining a license and ensuring compliance is almost certainly required according to current 2026 STR laws. Always verify the latest short term rental regulations and Airbnb license requirements directly with local government authorities for Plourin to ensure full compliance before hosting.
(Source: AirROI data, 2026, based on 35% licensed listings)
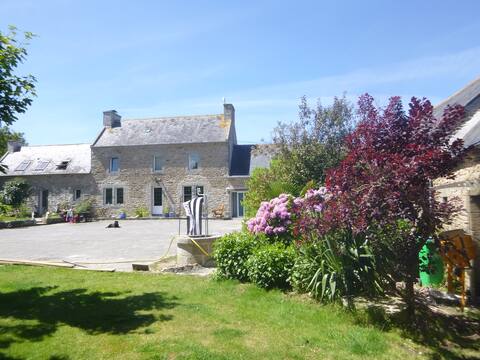
Top Performing Airbnb Properties in Plourin (2026)
Benchmark your potential! Explore examples of top-performing Airbnb properties in Plourinbased on Trailing Twelve Month (TTM) revenue. Analyze their characteristics, revenue, occupancy rate, and ADR to understand what drives success in this market.

Ker Gana 3 houses, sauna and jacuzzi, 15 people
Entire Place • 7 bedrooms
Gîte de Brocéliande
Private Room • 6 bedrooms
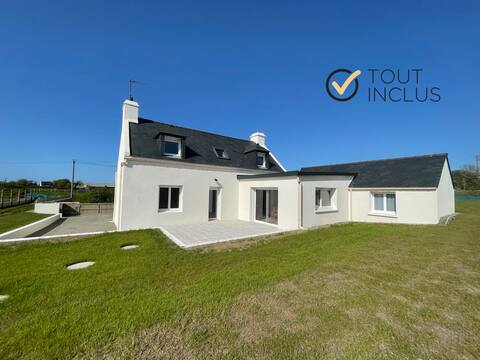
Ty Gwechall - Pretty renovated house between land
Entire Place • 4 bedrooms
Gîtes l'Authentik
Entire Place • 8 bedrooms
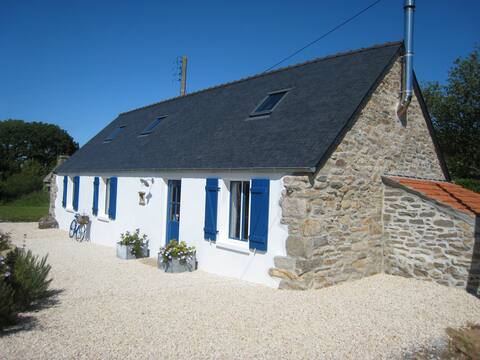
Ker Gana Dope Hot Tub, Sauna & Wood Stove
Entire Place • 2 bedrooms

Gite in Brittany with Jacuzzi
Entire Place • 2 bedrooms
Note: Performance varies based on location, size, amenities, seasonality, and management quality. Data reflects the past 12 months.
Top Performing Airbnb Hosts in Plourin (2026)
Learn from the best! This table showcases top-performing Airbnb hosts in Plourin based on the number of properties managed and estimated total revenue over the past year. Analyze their scale and performance metrics.
| Host Name | Properties | Grossing Revenue | Stay Reviews | Avg Rating |
|---|---|---|---|---|
| Céline | 4 | $157,636 | 325 | 4.86/5.0 |
| Sébastien | 2 | $49,966 | 28 | 4.80/5.0 |
| Fabienne | 1 | $46,831 | 32 | 4.88/5.0 |
| Antoine | 2 | $32,844 | 11 | 5.00/5.0 |
| Alex | 2 | $29,171 | 79 | 4.96/5.0 |
| Etienne | 1 | $11,377 | 11 | 5.00/5.0 |
| Alain | 1 | $10,857 | 60 | 4.90/5.0 |
| Paul &Michelle | 1 | $8,201 | 79 | 4.80/5.0 |
| Host #207107358 | 1 | $4,148 | 1 | 0.00/5.0 |
| Caroline | 1 | $2,516 | 47 | 4.66/5.0 |
Analyzing the strategies of top hosts, such as their property selection, pricing, and guest communication, can offer valuable lessons for optimizing your own Airbnb operations in Plourin.
Dive Deeper: Advanced Plourin STR Market Data (2026)
Ready to unlock more insights? AirROI provides access to advanced metrics and comprehensive Airbnb data for Plourin. Explore detailed analytics beyond this report to refine your investment strategy, optimize pricing, and maximize your vacation rental profits.
Explore Advanced MetricsPlourin Short-Term Rental Market Composition (2026): Property & Room Types
Room Type Distribution
Property Type Distribution
Market Composition Insights for Plourin
- The Plourin Airbnb market composition is heavily skewed towards Entire Home/Apt listings, which make up 88.2% of the 17 active rentals. This indicates strong guest preference for privacy and space.
- Looking at the property type distribution in Plourin, House properties are the most common (82.4%), reflecting the local real estate landscape.
- Houses represent a significant 82.4% portion, catering likely to families or larger groups.
- The presence of 5.9% Hotel/Boutique listings indicates integration with traditional hospitality.
Plourin Airbnb Room Capacity Analysis (2026): Bedroom Distribution
Distribution of Listings by Number of Bedrooms
Room Capacity Insights for Plourin
- The dominant room capacity in Plourin is 2 bedrooms listings, making up 41.2% of the market. This suggests a strong demand for properties suitable for couples or solo travelers.
- Together, 2 bedrooms and 5+ bedrooms properties represent 58.8% of the active Airbnb listings in Plourin, indicating a high concentration in these sizes.
- A significant 41.1% of listings offer 3+ bedrooms, catering to larger groups and families seeking more space in Plourin.
Plourin Vacation Rental Guest Capacity Trends (2026)
Distribution of Listings by Guest Capacity
Guest Capacity Insights for Plourin
- The most common guest capacity trend in Plourin vacation rentals is listings accommodating 2 guests (23.5%). This suggests the primary traveler segment is likely couples or solo travelers.
- Properties designed for 2 guests and 4 guests dominate the Plourin STR market, accounting for 41.1% of listings.
- 41.1% of properties accommodate 6+ guests, serving the market segment for larger families or group travel in Plourin.
- On average, properties in Plourin are equipped to host 4.4 guests.
Plourin Airbnb Booking Patterns (2026): Available vs. Booked Days
Available Days Distribution
Booked Days Distribution
Booking Pattern Insights for Plourin
- The most common availability pattern in Plourin falls within the 181-270 days range, representing 47.1% of listings. This suggests many properties have significant open periods on their calendars.
- Approximately 88.3% of listings show high availability (181+ days open annually), indicating potential for increased bookings or specific owner usage patterns.
- For booked days, the 91-180 days range is most frequent in Plourin (47.1%), reflecting common guest stay durations or potential owner blocking patterns.
- A notable 11.8% of properties secure long booking periods (181+ days booked per year), highlighting successful long-term rental strategies or significant owner usage.
Plourin Airbnb Minimum Stay Requirements Analysis
Distribution of Listings by Minimum Night Requirement
1 Night
6 listings
35.3% of total
2 Nights
5 listings
29.4% of total
3 Nights
4 listings
23.5% of total
4-6 Nights
1 listings
5.9% of total
7-29 Nights
1 listings
5.9% of total
Key Insights
- The most prevalent minimum stay requirement in Plourin is 1 Night, adopted by 35.3% of listings. This highlights the market's preference for shorter, flexible bookings.
- A strong majority (64.7%) of the Plourin Airbnb data shows acceptance of very short stays (1-2 nights), indicating a dynamic, high-turnover market.
Recommendations
- Align with the market by considering a 1 Night minimum stay, as 35.3% of Plourin hosts use this setting.
- Adjust minimum nights based on seasonality – potentially shorter during low season and longer during peak demand periods in Plourin.
Plourin Airbnb Cancellation Policy Trends Analysis (2026)
Flexible
1 listings
6.7% of total
Moderate
1 listings
6.7% of total
Firm
3 listings
20% of total
Strict
10 listings
66.7% of total
Cancellation Policy Insights for Plourin
- The prevailing Airbnb cancellation policy trend in Plourin is Strict, used by 66.7% of listings.
- A majority (86.7%) of hosts in Plourin utilize Firm or Strict policies, indicating a market where hosts prioritize booking security.
Recommendations for Hosts
- Consider adopting a Strict policy to align with the 66.7% market standard in Plourin.
- With 66.7% using Strict terms, this is a viable option in Plourin, particularly for high-value properties or during peak demand periods.
- Regularly review your cancellation policy against competitors and market demand shifts in Plourin.
Plourin STR Booking Lead Time Analysis (2026)
Average Booking Lead Time by Month
Booking Lead Time Insights for Plourin
- The overall average booking lead time for vacation rentals in Plourin is 86 days.
- Guests book furthest in advance for stays during June (average 135 days), likely coinciding with peak travel demand or local events.
- The shortest booking windows occur for stays in February (average 15 days), indicating more last-minute travel plans during this time.
- Seasonally, Summer (119 days avg.) sees the longest lead times, while Winter (74 days avg.) has the shortest, reflecting typical travel planning cycles.
Recommendations for Hosts
- Use the overall average lead time (86 days) as a baseline for your pricing and availability strategy in Plourin.
- For June stays, consider implementing length-of-stay discounts or slightly higher rates for bookings made less than 135 days out to capitalize on advance planning.
- Target marketing efforts for the Summer season well in advance (at least 119 days) to capture early planners.
- Monitor your own booking lead times against these Plourin averages to identify opportunities for dynamic pricing adjustments.
Popular & Essential Airbnb Amenities in Plourin (2026)
Amenity Prevalence
Amenity Insights for Plourin
- Essential amenities in Plourin that guests expect include: Kitchen. Lacking these (this) could significantly impact bookings.
- Popular amenities like Wifi, Free parking on premises, Cooking basics are common but not universal. Offering these can provide a competitive edge.
- Warning: Wifi is not universally provided but is considered essential globally. Ensure reliable Wifi is offered.
Recommendations for Hosts
- Ensure your listing includes all essential amenities for Plourin: Kitchen.
- Consider adding popular differentiators like Wifi or Free parking on premises to increase appeal.
- Highlight unique or less common amenities you offer (e.g., hot tub, dedicated workspace, EV charger) in your listing description and photos.
- Regularly check competitor amenities in Plourin to stay competitive.
Plourin Airbnb Guest Demographics & Profile Analysis (2026)
Guest Profile Summary for Plourin
- The typical guest profile for Airbnb in Plourin consists of primarily domestic travelers (87%), often arriving from nearby Paris, typically belonging to the Post-2000s (Gen Z/Alpha) group (50%), primarily speaking French or English.
- Domestic travelers account for 87.3% of guests.
- Key international markets include France (87.3%) and Germany (5.6%).
- Top languages spoken are French (46.3%) followed by English (34.1%).
- A significant demographic segment is the Post-2000s (Gen Z/Alpha) group, representing 50% of guests.
Recommendations for Hosts
- Target domestic marketing efforts towards travelers from Paris and Brest.
- Tailor amenities and listing descriptions to appeal to the dominant Post-2000s (Gen Z/Alpha) demographic (e.g., highlight fast WiFi, smart home features, local guides).
- Highlight unique local experiences or amenities relevant to the primary guest profile.
- Consider seasonal promotions aligned with peak travel times for key origin markets.
Nearby Short-Term Rental Market Comparison
How does the Plourin Airbnb market stack up against its neighbors? Compare key performance metrics like average monthly revenue, ADR, and occupancy rates in surrounding areas to understand the broader regional STR landscape.
| Market | Active Properties | Monthly Revenue | Daily Rate | Avg. Occupancy |
|---|---|---|---|---|
| Île-de-Bréhat | 46 | $2,275 | $220.16 | 45% |
| Ushant | 63 | $2,117 | $151.38 | 54% |
| Lanmodez | 20 | $1,975 | $216.57 | 41% |
| Landaul | 17 | $1,862 | $151.82 | 45% |
| Langoat | 10 | $1,726 | $105.19 | 58% |
| Guern | 13 | $1,711 | $102.22 | 42% |
| Languidic | 39 | $1,687 | $151.95 | 43% |
| Sainte-Brigitte | 11 | $1,686 | $162.28 | 39% |
| Saint-Barthélemy | 11 | $1,632 | $158.59 | 36% |
| Sibiril | 45 | $1,611 | $166.07 | 41% |