Uturoa Airbnb Market Analysis 2026: Short Term Rental Data & Vacation Rental Statistics in French Polynesia, France
Is Airbnb profitable in Uturoa in 2026? Explore comprehensive Airbnb analytics for Uturoa, French Polynesia, France to uncover income potential. This 2026 STR market report for Uturoa, based on AirROI data from February 2025 to January 2026, reveals key trends in the niche market of 66 active listings.
Whether you're considering an Airbnb investment in Uturoa, optimizing your existing vacation rental, or exploring rental arbitrage opportunities, understanding the Uturoa Airbnb data is crucial. Navigating the high regulation landscape is key to maximizing your short term rental income potential. Let's dive into the specifics.
Key Uturoa Airbnb Performance Metrics Overview
Monthly Airbnb Revenue Variations & Income Potential in Uturoa (2026)
Understanding the monthly revenue variations for Airbnb listings in Uturoa is key to maximizing your short term rental income potential. Seasonality significantly impacts earnings. Our analysis, based on data from the past 12 months, shows that the peak revenue month for STRs in Uturoa is typically July, while March often presents the lowest earnings, highlighting opportunities for strategic pricing adjustments during shoulder and low seasons. Explore the typical Airbnb income in Uturoa across different performance tiers:
- Best-in-class properties (Top 10%) achieve $4,417+ monthly, often utilizing dynamic pricing and superior guest experiences.
- Strong performing properties (Top 25%) earn $3,013 or more, indicating effective management and desirable locations/amenities.
- Typical properties (Median) generate around $1,859 per month, representing the average market performance.
- Entry-level properties (Bottom 25%) see earnings around $1,083, often with potential for optimization.
Average Monthly Airbnb Earnings Trend in Uturoa
Uturoa Airbnb Occupancy Rate Trends (2026)
Maximize your bookings by understanding the Uturoa STR occupancy trends. Seasonal demand shifts significantly influence how often properties are booked. Typically, Julysees the highest demand (peak season occupancy), while January experiences the lowest (low season). Effective strategies, like adjusting minimum stays or offering promotions, can boost occupancy during slower periods. Here's how different property tiers perform in Uturoa:
- Best-in-class properties (Top 10%) achieve 83%+ occupancy, indicating high desirability and potentially optimized availability.
- Strong performing properties (Top 25%) maintain 70% or higher occupancy, suggesting good market fit and guest satisfaction.
- Typical properties (Median) have an occupancy rate around 53%.
- Entry-level properties (Bottom 25%) average 26% occupancy, potentially facing higher vacancy.
Average Monthly Occupancy Rate Trend in Uturoa
Average Daily Rate (ADR) Airbnb Trends in Uturoa (2026)
Effective short term rental pricing strategy in Uturoa involves understanding monthly ADR fluctuations. The Average Daily Rate (ADR) for Airbnb in Uturoa typically peaks in October and dips lowest during March. Leveraging Airbnb dynamic pricing tools or strategies based on this seasonality can significantly boost revenue. Here's a look at the typical nightly rates achieved:
- Best-in-class properties (Top 10%) command rates of $442+ per night, often due to premium features or locations.
- Strong performing properties (Top 25%) achieve nightly rates of $180 or more.
- Typical properties (Median) charge around $118 per night.
- Entry-level properties (Bottom 25%) earn around $92 per night.
Average Daily Rate (ADR) Trend by Month in Uturoa
Get Live Uturoa Market Intelligence 👇

Explore Real-time Analytics
Airbnb Seasonality Analysis & Trends in Uturoa (2026)
Peak Season (July, August, October)
- Revenue averages $3,175 per month
- Occupancy rates average 60.8%
- Daily rates average $219
Shoulder Season
- Revenue averages $2,310 per month
- Occupancy maintains around 50.3%
- Daily rates hold near $220
Low Season (January, February, March)
- Revenue drops to average $1,639 per month
- Occupancy decreases to average 35.0%
- Daily rates adjust to average $210
Seasonality Insights for Uturoa
- The Airbnb seasonality in Uturoa shows highly seasonal trends requiring careful strategy. While the sections above show seasonal averages, it's also insightful to look at the extremes:
- During the high season, the absolute peak month showcases Uturoa's highest earning potential, with monthly revenues capable of climbing to $3,442, occupancy reaching a high of 66.4%, and ADRs peaking at $240.
- Conversely, the slowest single month of the year, typically falling within the low season, marks the market's lowest point. In this month, revenue might dip to $1,527, occupancy could drop to 32.9%, and ADRs may adjust down to $196.
- Understanding both the seasonal averages and these monthly peaks and troughs in revenue, occupancy, and ADR is crucial for maximizing your Airbnb profit potential in Uturoa.
Seasonal Strategies for Maximizing Profit
- Peak Season: Maximize revenue through premium pricing and potentially longer minimum stays. Ensure high availability.
- Low Season: Offer competitive pricing, special promotions (e.g., extended stay discounts), and flexible cancellation policies. Target off-season travelers like remote workers or budget-conscious guests.
- Shoulder Seasons: Implement dynamic pricing that balances peak and low rates. Target weekend travelers or specific events. Offer slightly more flexible terms than peak season.
- Regularly analyze your own performance against these Uturoa seasonality benchmarks and adjust your pricing and availability strategy accordingly.
Best Areas for Airbnb Investment in Uturoa (2026)
Exploring the top neighborhoods for short-term rentals in Uturoa? This section highlights key areas, outlining why they are attractive for hosts and guests, along with notable local attractions. Consider these locations based on your target guest profile and investment strategy.
| Neighborhood / Area | Why Host Here? (Target Guests & Appeal) | Key Attractions & Landmarks |
|---|---|---|
| Cooks Bay | Scenic bay area known for its stunning views and tranquil atmosphere. Popular among visitors looking for relaxation and natural beauty, with access to water activities. | Cooks Bay, Water sports, Scenic hiking trails, Snorkeling and diving spots, Beautiful beaches |
| Raitea Island | Lovely island known for its lush nature and authentic Polynesian culture. Ideal for those seeking a cultural experience and secluded getaway, close to beautiful sights. | Mount Temehani, Raiatea Huiti, Cultural sites, Hiking trails, Maohi cultural experiences |
| Apooiti | A quaint coastal area offering a mix of serene beaches and lush greenery. Suitable for families and travelers looking for a peaceful eco-friendly stay. | Apooiti Beach, Waterfront views, Local dining options, Fishing and boating, Scenic walks |
| Uturoa Town | The main town of Raiatea, bustling with shops, dining, and local culture. Provides an urban experience with easy access to the island's attractions and amenities. | Local markets, Cafes and restaurants, Cultural experiences, Shopping, Transportation hub |
| Faaroa Bay | A stunning bay on the north coast of Raiatea, perfect for kayaking and exploring the nearby natural beauty. Offers a unique experience for nature lovers and adventurers. | Kayaking, Faaroa River, Tropical surroundings, Wildlife viewing, Scenic boat trips |
| Tumaraa | A serene area known for its beautiful beaches and quaint atmosphere. Great for those looking for leisure and relaxation in a picturesque setting. | Beautiful beaches, Snorkeling spots, Quiet retreats, Stunning sunsets, Local flora and fauna |
| Huahine Island | Close to the main island, offers a laid-back vibe with beautiful landscapes and cultural experiences. Perfect for travelers wanting to escape the hustle and bustle. | Historical sites, Untouched beaches, Local markets, Island tours, Cultural events |
| Taha'a Island | Famous for its vanilla plantations and stunning coral reefs. A top choice for eco-tourists and those interested in agriculture and marine life. | Vanilla farms, Coral gardens, Taha’a tours, Cultural experiences, Scenic views |
Understanding Airbnb License Requirements & STR Laws in Uturoa (2026)
Yes, Uturoa, French Polynesia, France enforces high STR regulations. Obtaining a license and ensuring compliance is almost certainly required according to current 2026 STR laws. Always verify the latest short term rental regulations and Airbnb license requirements directly with local government authorities for Uturoa to ensure full compliance before hosting.
(Source: AirROI data, 2026, based on 97% licensed listings)
Top Performing Airbnb Properties in Uturoa (2026)
Benchmark your potential! Explore examples of top-performing Airbnb properties in Uturoabased on Trailing Twelve Month (TTM) revenue. Analyze their characteristics, revenue, occupancy rate, and ADR to understand what drives success in this market.

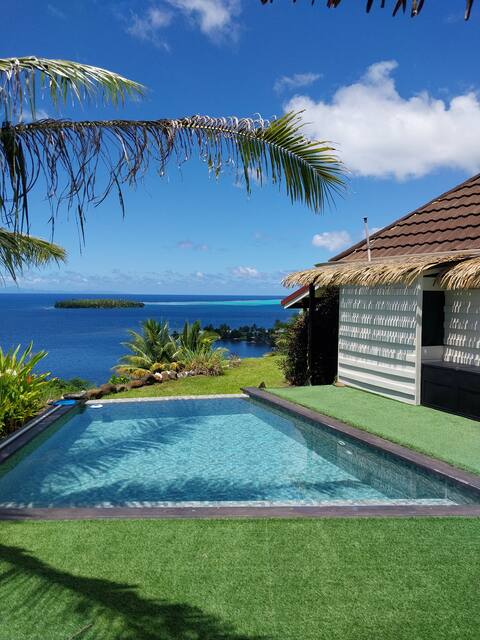
Tekauhivai Lodge
Entire Place • 4 bedrooms

Maison de vacances
Entire Place • 3 bedrooms
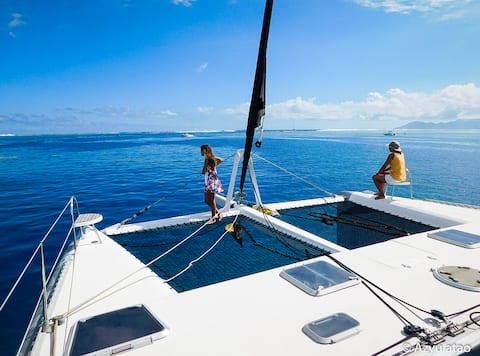
Private catamaran 15 m. Sailing to the Leeward Islands
Private Room • 3 bedrooms

FARE KURA BORD DE MER, UTUROA, FRENCH POLYNESIA
Entire Place • 3 bedrooms
Fare Mahi Mahi logement "Bungalow Mopelia"
Entire Place • 1 bedroom
Tekauhivai: Ground floor
Entire Place • 2 bedrooms
Note: Performance varies based on location, size, amenities, seasonality, and management quality. Data reflects the past 12 months.
Top Performing Airbnb Hosts in Uturoa (2026)
Learn from the best! This table showcases top-performing Airbnb hosts in Uturoa based on the number of properties managed and estimated total revenue over the past year. Analyze their scale and performance metrics.
| Host Name | Properties | Grossing Revenue | Stay Reviews | Avg Rating |
|---|---|---|---|---|
| Fare Tepua Lodge | 12 | $195,456 | 842 | 4.69/5.0 |
| Tekauhivai | 3 | $172,842 | 89 | 4.90/5.0 |
| Maï | 1 | $92,150 | 8 | 5.00/5.0 |
| Sandrine | 2 | $89,511 | 127 | 5.00/5.0 |
| Jean-Marie | 1 | $65,663 | 9 | 5.00/5.0 |
| Martine | 2 | $64,771 | 294 | 4.70/5.0 |
| Cathy | 1 | $52,321 | 99 | 4.85/5.0 |
| Olivia | 2 | $47,836 | 35 | 4.92/5.0 |
| Tahiti Reva | 2 | $45,198 | 39 | 4.41/5.0 |
| Meherio | 3 | $42,815 | 68 | 4.96/5.0 |
Analyzing the strategies of top hosts, such as their property selection, pricing, and guest communication, can offer valuable lessons for optimizing your own Airbnb operations in Uturoa.
Dive Deeper: Advanced Uturoa STR Market Data (2026)
Ready to unlock more insights? AirROI provides access to advanced metrics and comprehensive Airbnb data for Uturoa. Explore detailed analytics beyond this report to refine your investment strategy, optimize pricing, and maximize your vacation rental profits.
Explore Advanced MetricsUturoa Short-Term Rental Market Composition (2026): Property & Room Types
Room Type Distribution
Property Type Distribution
Market Composition Insights for Uturoa
- The Uturoa Airbnb market composition is heavily skewed towards Entire Home/Apt listings, which make up 63.6% of the 66 active rentals. This indicates strong guest preference for privacy and space.
- However, a notable 33.3% share for Private Rooms suggests opportunities for budget-conscious travelers or hosts renting out spare rooms.
- Looking at the property type distribution in Uturoa, House properties are the most common (48.5%), reflecting the local real estate landscape.
- Houses represent a significant 48.5% portion, catering likely to families or larger groups.
- The presence of 37.9% Hotel/Boutique listings indicates integration with traditional hospitality.
- Smaller segments like apartment/condo, others (combined 6.0%) offer potential for unique stay experiences.
Uturoa Airbnb Room Capacity Analysis (2026): Bedroom Distribution
Distribution of Listings by Number of Bedrooms
Room Capacity Insights for Uturoa
- The dominant room capacity in Uturoa is 1 bedroom listings, making up 40.9% of the market. This suggests a strong demand for properties suitable for couples or solo travelers.
- Together, 1 bedroom and 3 bedrooms properties represent 54.5% of the active Airbnb listings in Uturoa, indicating a high concentration in these sizes.
- A significant 22.7% of listings offer 3+ bedrooms, catering to larger groups and families seeking more space in Uturoa.
Uturoa Vacation Rental Guest Capacity Trends (2026)
Distribution of Listings by Guest Capacity
Guest Capacity Insights for Uturoa
- The most common guest capacity trend in Uturoa vacation rentals is listings accommodating 2 guests (33.3%). This suggests the primary traveler segment is likely couples or solo travelers.
- Properties designed for 2 guests and 6 guests dominate the Uturoa STR market, accounting for 48.5% of listings.
- 30.4% of properties accommodate 6+ guests, serving the market segment for larger families or group travel in Uturoa.
- On average, properties in Uturoa are equipped to host 3.4 guests.
Uturoa Airbnb Booking Patterns (2026): Available vs. Booked Days
Available Days Distribution
Booked Days Distribution
Booking Pattern Insights for Uturoa
- The most common availability pattern in Uturoa falls within the 271-366 days range, representing 40.9% of listings. This suggests many properties have significant open periods on their calendars.
- Approximately 65.1% of listings show high availability (181+ days open annually), indicating potential for increased bookings or specific owner usage patterns.
- For booked days, the 181-270 days range is most frequent in Uturoa (27.3%), reflecting common guest stay durations or potential owner blocking patterns.
- A notable 36.4% of properties secure long booking periods (181+ days booked per year), highlighting successful long-term rental strategies or significant owner usage.
Uturoa Airbnb Minimum Stay Requirements Analysis
Distribution of Listings by Minimum Night Requirement
1 Night
28 listings
42.4% of total
2 Nights
22 listings
33.3% of total
3 Nights
3 listings
4.5% of total
4-6 Nights
1 listings
1.5% of total
30+ Nights
12 listings
18.2% of total
Key Insights
- The most prevalent minimum stay requirement in Uturoa is 1 Night, adopted by 42.4% of listings. This highlights the market's preference for shorter, flexible bookings.
- A strong majority (75.7%) of the Uturoa Airbnb data shows acceptance of very short stays (1-2 nights), indicating a dynamic, high-turnover market.
- A significant segment (18.2%) caters to monthly stays (30+ nights) in Uturoa, pointing to opportunities in the extended-stay market.
Recommendations
- Align with the market by considering a 1 Night minimum stay, as 42.4% of Uturoa hosts use this setting.
- Explore offering discounts for stays of 30+ nights to attract the 18.2% of the market seeking extended stays.
- Adjust minimum nights based on seasonality – potentially shorter during low season and longer during peak demand periods in Uturoa.
Uturoa Airbnb Cancellation Policy Trends Analysis (2026)
Super Strict 30 Days
2 listings
3% of total
Limited
2 listings
3% of total
Flexible
25 listings
37.9% of total
Moderate
21 listings
31.8% of total
Firm
12 listings
18.2% of total
Strict
4 listings
6.1% of total
Cancellation Policy Insights for Uturoa
- The prevailing Airbnb cancellation policy trend in Uturoa is Flexible, used by 37.9% of listings.
- There's a relatively balanced mix between guest-friendly (69.7%) and stricter (24.3%) policies, offering choices for different guest needs.
- Strict cancellation policies are quite rare (6.1%), potentially making listings with this policy less competitive unless justified by high demand or property type.
Recommendations for Hosts
- Consider adopting a Flexible policy to align with the 37.9% market standard in Uturoa.
- Using a Strict policy might deter some guests, as only 6.1% of listings use it. Evaluate if potential revenue protection outweighs possible lower booking rates.
- Regularly review your cancellation policy against competitors and market demand shifts in Uturoa.
Uturoa STR Booking Lead Time Analysis (2026)
Average Booking Lead Time by Month
Booking Lead Time Insights for Uturoa
- The overall average booking lead time for vacation rentals in Uturoa is 77 days.
- Guests book furthest in advance for stays during July (average 124 days), likely coinciding with peak travel demand or local events.
- The shortest booking windows occur for stays in February (average 51 days), indicating more last-minute travel plans during this time.
- Seasonally, Summer (107 days avg.) sees the longest lead times, while Winter (58 days avg.) has the shortest, reflecting typical travel planning cycles.
Recommendations for Hosts
- Use the overall average lead time (77 days) as a baseline for your pricing and availability strategy in Uturoa.
- For July stays, consider implementing length-of-stay discounts or slightly higher rates for bookings made less than 124 days out to capitalize on advance planning.
- Target marketing efforts for the Summer season well in advance (at least 107 days) to capture early planners.
- Monitor your own booking lead times against these Uturoa averages to identify opportunities for dynamic pricing adjustments.
Popular & Essential Airbnb Amenities in Uturoa (2026)
Amenity Prevalence
Amenity Insights for Uturoa
- Popular amenities like Wifi, Kitchen, Free parking on premises are common but not universal. Offering these can provide a competitive edge.
- Warning: Wifi is not universally provided but is considered essential globally. Ensure reliable Wifi is offered.
Recommendations for Hosts
- Consider adding popular differentiators like Wifi or Kitchen to increase appeal.
- Highlight unique or less common amenities you offer (e.g., hot tub, dedicated workspace, EV charger) in your listing description and photos.
- Regularly check competitor amenities in Uturoa to stay competitive.
Uturoa Airbnb Guest Demographics & Profile Analysis (2026)
Guest Profile Summary for Uturoa
- The typical guest profile for Airbnb in Uturoa consists of a mix of domestic (63%) and international guests, often arriving from nearby Paris, typically belonging to the Post-2000s (Gen Z/Alpha) group (50%), primarily speaking English or French.
- Domestic travelers account for 63.2% of guests.
- Key international markets include France (63.2%) and United States (10.4%).
- Top languages spoken are English (38.2%) followed by French (36.7%).
- A significant demographic segment is the Post-2000s (Gen Z/Alpha) group, representing 50% of guests.
Recommendations for Hosts
- Target domestic marketing efforts towards travelers from Paris and Lyon.
- Tailor amenities and listing descriptions to appeal to the dominant Post-2000s (Gen Z/Alpha) demographic (e.g., highlight fast WiFi, smart home features, local guides).
- Highlight unique local experiences or amenities relevant to the primary guest profile.
- Consider seasonal promotions aligned with peak travel times for key origin markets.
Nearby Short-Term Rental Market Comparison
How does the Uturoa Airbnb market stack up against its neighbors? Compare key performance metrics like average monthly revenue, ADR, and occupancy rates in surrounding areas to understand the broader regional STR landscape.