Haybes Airbnb Market Analysis 2026: Short Term Rental Data & Vacation Rental Statistics in Grand Est, France
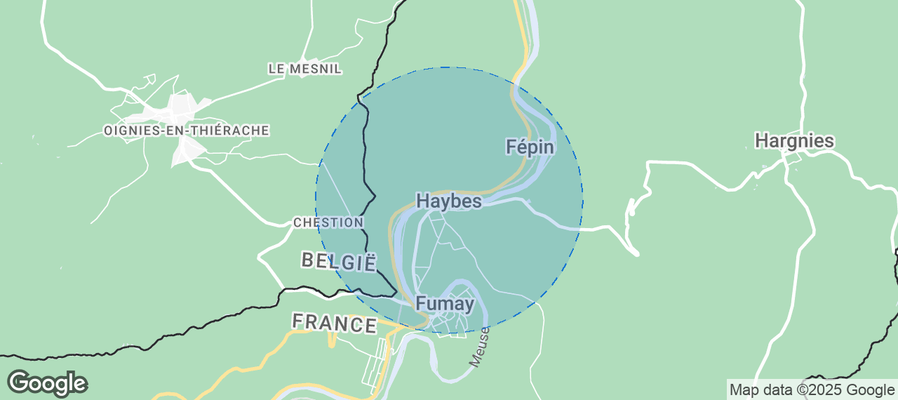
Is Airbnb profitable in Haybes in 2026? Explore comprehensive Airbnb analytics for Haybes, Grand Est, France to uncover income potential. This 2026 STR market report for Haybes, based on AirROI data from February 2025 to January 2026, reveals key trends in the niche market of 23 active listings.
Whether you're considering an Airbnb investment in Haybes, optimizing your existing vacation rental, or exploring rental arbitrage opportunities, understanding the Haybes Airbnb data is crucial. Understanding the local regulations is key to maximizing your short term rental income potential. Let's dive into the specifics.
Key Haybes Airbnb Performance Metrics Overview
Monthly Airbnb Revenue Variations & Income Potential in Haybes (2026)
Understanding the monthly revenue variations for Airbnb listings in Haybes is key to maximizing your short term rental income potential. Seasonality significantly impacts earnings. Our analysis, based on data from the past 12 months, shows that the peak revenue month for STRs in Haybes is typically August, while January often presents the lowest earnings, highlighting opportunities for strategic pricing adjustments during shoulder and low seasons. Explore the typical Airbnb income in Haybes across different performance tiers:
- Best-in-class properties (Top 10%) achieve $2,841+ monthly, often utilizing dynamic pricing and superior guest experiences.
- Strong performing properties (Top 25%) earn $1,989 or more, indicating effective management and desirable locations/amenities.
- Typical properties (Median) generate around $1,297 per month, representing the average market performance.
- Entry-level properties (Bottom 25%) see earnings around $768, often with potential for optimization.
Average Monthly Airbnb Earnings Trend in Haybes
Haybes Airbnb Occupancy Rate Trends (2026)
Maximize your bookings by understanding the Haybes STR occupancy trends. Seasonal demand shifts significantly influence how often properties are booked. Typically, Augustsees the highest demand (peak season occupancy), while January experiences the lowest (low season). Effective strategies, like adjusting minimum stays or offering promotions, can boost occupancy during slower periods. Here's how different property tiers perform in Haybes:
- Best-in-class properties (Top 10%) achieve 76%+ occupancy, indicating high desirability and potentially optimized availability.
- Strong performing properties (Top 25%) maintain 58% or higher occupancy, suggesting good market fit and guest satisfaction.
- Typical properties (Median) have an occupancy rate around 40%.
- Entry-level properties (Bottom 25%) average 26% occupancy, potentially facing higher vacancy.
Average Monthly Occupancy Rate Trend in Haybes
Average Daily Rate (ADR) Airbnb Trends in Haybes (2026)
Effective short term rental pricing strategy in Haybes involves understanding monthly ADR fluctuations. The Average Daily Rate (ADR) for Airbnb in Haybes typically peaks in September and dips lowest during March. Leveraging Airbnb dynamic pricing tools or strategies based on this seasonality can significantly boost revenue. Here's a look at the typical nightly rates achieved:
- Best-in-class properties (Top 10%) command rates of $165+ per night, often due to premium features or locations.
- Strong performing properties (Top 25%) achieve nightly rates of $127 or more.
- Typical properties (Median) charge around $93 per night.
- Entry-level properties (Bottom 25%) earn around $81 per night.
Average Daily Rate (ADR) Trend by Month in Haybes
Get Live Haybes Market Intelligence 👇
Explore Real-time Analytics
Airbnb Seasonality Analysis & Trends in Haybes (2026)
Peak Season (August, October, September)
- Revenue averages $2,777 per month
- Occupancy rates average 63.4%
- Daily rates average $120
Shoulder Season
- Revenue averages $1,576 per month
- Occupancy maintains around 40.4%
- Daily rates hold near $111
Low Season (January, February, November)
- Revenue drops to average $1,032 per month
- Occupancy decreases to average 24.6%
- Daily rates adjust to average $112
Seasonality Insights for Haybes
- The Airbnb seasonality in Haybes shows highly seasonal trends requiring careful strategy. While the sections above show seasonal averages, it's also insightful to look at the extremes:
- During the high season, the absolute peak month showcases Haybes's highest earning potential, with monthly revenues capable of climbing to $2,967, occupancy reaching a high of 75.9%, and ADRs peaking at $122.
- Conversely, the slowest single month of the year, typically falling within the low season, marks the market's lowest point. In this month, revenue might dip to $802, occupancy could drop to 16.6%, and ADRs may adjust down to $101.
- Understanding both the seasonal averages and these monthly peaks and troughs in revenue, occupancy, and ADR is crucial for maximizing your Airbnb profit potential in Haybes.
Seasonal Strategies for Maximizing Profit
- Peak Season: Maximize revenue through premium pricing and potentially longer minimum stays. Ensure high availability.
- Low Season: Offer competitive pricing, special promotions (e.g., extended stay discounts), and flexible cancellation policies. Target off-season travelers like remote workers or budget-conscious guests.
- Shoulder Seasons: Implement dynamic pricing that balances peak and low rates. Target weekend travelers or specific events. Offer slightly more flexible terms than peak season.
- Regularly analyze your own performance against these Haybes seasonality benchmarks and adjust your pricing and availability strategy accordingly.
Best Areas for Airbnb Investment in Haybes (2026)
Exploring the top neighborhoods for short-term rentals in Haybes? This section highlights key areas, outlining why they are attractive for hosts and guests, along with notable local attractions. Consider these locations based on your target guest profile and investment strategy.
| Neighborhood / Area | Why Host Here? (Target Guests & Appeal) | Key Attractions & Landmarks |
|---|---|---|
| City Center Haybes | The heart of Haybes, offering easy access to local shops, cafes, and the beautiful riverside. Ideal for tourists looking to immerse themselves in local culture and charm. | La Meuse River, Local markets, Historic architecture, Walking trails, Nearby parks |
| Les Jardins de la Meuse | A picturesque area with stunning river views and lush greenery, perfect for nature lovers and those seeking tranquility away from the hustle and bustle. | Meuse River promenades, Botanical gardens, Cycling paths, Picnic spots, Wildlife watching |
| Val de Meuse | Known for its stunning landscapes and outdoor activities, this area attracts adventure seekers looking for hiking and cycling opportunities along the scenic routes. | Hiking trails, Cycling paths, Nature reserves, Scenic viewpoints, Wildflower meadows |
| Château de Haybes | A historical landmark that draws visitors interested in the culture and history of the region. The surrounding area offers a mix of history and natural beauty. | Château de Haybes, Historical tours, Cultural events, Scenic picnic areas, Guided tours |
| Rural Retreats | Offering peaceful countryside stays, ideal for families and nature enthusiasts. Guests can enjoy a serene atmosphere and local farm experiences. | Countryside landscapes, Organic farms, Local food tasting, Birdwatching, Star gazing spots |
| Cultural Heritage Sites | Proximity to ancient sites and museums, appealing to history buffs and tourists looking for educational experiences during their stay. | Museums, Cultural landmarks, Historic villages, Art exhibitions, Local artisans |
| Adventure Base Camp | Ideal for active travelers looking for outdoor adventures such as kayaking, climbing, and hiking in the nearby forests and hills. | Kayaking on the Meuse, Rock climbing spots, Adventure parks, Forest trails, Camping sites |
| Winter Sports Hub | Close to areas offering winter sports, including ski resorts and snowboarding, ideal for tourists seeking fun in the snow during winter months. | Ski resorts, Snowboarding areas, Winter hiking, Local winter festivals, Scenic mountain views |
Understanding Airbnb License Requirements & STR Laws in Haybes (2026)
With 22% of listings showing registration in 2026, understanding potential Airbnb license requirements is crucial in Haybes. Always verify the latest short term rental regulations and Airbnb license requirements directly with local government authorities for Haybes to ensure full compliance before hosting.
(Source: AirROI data, 2026, based on 22% licensed listings)
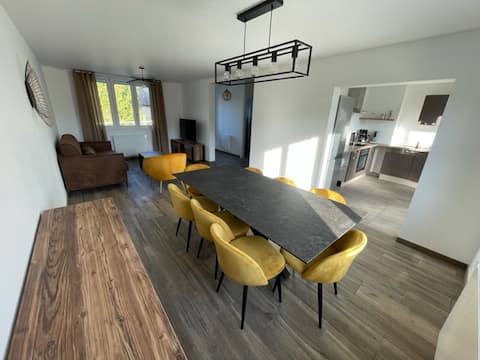
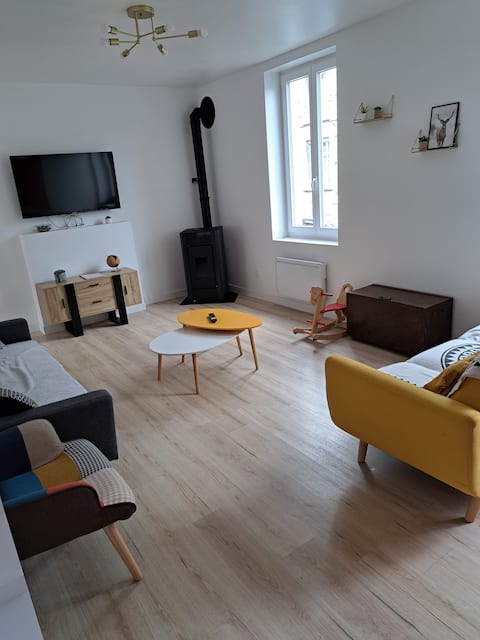
Top Performing Airbnb Properties in Haybes (2026)
Benchmark your potential! Explore examples of top-performing Airbnb properties in Haybesbased on Trailing Twelve Month (TTM) revenue. Analyze their characteristics, revenue, occupancy rate, and ADR to understand what drives success in this market.

Ardennais cottage 18 people "les gronchons"
Entire Place • 6 bedrooms
4 bedroom house with garden
Entire Place • 4 bedrooms
Ardennes gîte for 12 people "Le sachouliot"
Entire Place • 5 bedrooms
Au Val Heureux, 3-star furnished, Clévacances
Entire Place • 3 bedrooms

House by the Meuse "Jolie Rose" (services)
Entire Place • 2 bedrooms

House 8 pers: "Les gronchons"
Entire Place • 3 bedrooms
Note: Performance varies based on location, size, amenities, seasonality, and management quality. Data reflects the past 12 months.
Top Performing Airbnb Hosts in Haybes (2026)
Learn from the best! This table showcases top-performing Airbnb hosts in Haybes based on the number of properties managed and estimated total revenue over the past year. Analyze their scale and performance metrics.
| Host Name | Properties | Grossing Revenue | Stay Reviews | Avg Rating |
|---|---|---|---|---|
| Elodie | 3 | $140,513 | 80 | 4.79/5.0 |
| Les Balcons De La Vallee | 1 | $33,110 | 33 | 4.88/5.0 |
| Céline Denise Françoise | 3 | $31,221 | 40 | 4.89/5.0 |
| Aurore | 1 | $17,965 | 62 | 4.94/5.0 |
| Nicolas | 2 | $17,608 | 133 | 4.87/5.0 |
| Valérie-Anne | 1 | $16,307 | 78 | 4.87/5.0 |
| Claire | 1 | $15,621 | 64 | 4.55/5.0 |
| Céline | 1 | $15,363 | 120 | 4.95/5.0 |
| Via Fb : Griet Je | 1 | $14,188 | 38 | 4.58/5.0 |
| Aude | 1 | $12,678 | 89 | 4.80/5.0 |
Analyzing the strategies of top hosts, such as their property selection, pricing, and guest communication, can offer valuable lessons for optimizing your own Airbnb operations in Haybes.
Dive Deeper: Advanced Haybes STR Market Data (2026)
Ready to unlock more insights? AirROI provides access to advanced metrics and comprehensive Airbnb data for Haybes. Explore detailed analytics beyond this report to refine your investment strategy, optimize pricing, and maximize your vacation rental profits.
Explore Advanced MetricsHaybes Short-Term Rental Market Composition (2026): Property & Room Types
Room Type Distribution
Property Type Distribution
Market Composition Insights for Haybes
- The Haybes Airbnb market composition is heavily skewed towards Entire Home/Apt listings, which make up 100% of the 23 active rentals. This indicates strong guest preference for privacy and space.
- Looking at the property type distribution in Haybes, House properties are the most common (87%), reflecting the local real estate landscape.
- Houses represent a significant 87% portion, catering likely to families or larger groups.
Haybes Airbnb Room Capacity Analysis (2026): Bedroom Distribution
Distribution of Listings by Number of Bedrooms
Room Capacity Insights for Haybes
- The dominant room capacity in Haybes is 3 bedrooms listings, making up 39.1% of the market. This suggests a strong demand for properties suitable for families or small groups.
- Together, 3 bedrooms and 2 bedrooms properties represent 65.2% of the active Airbnb listings in Haybes, indicating a high concentration in these sizes.
- A significant 69.5% of listings offer 3+ bedrooms, catering to larger groups and families seeking more space in Haybes.
Haybes Vacation Rental Guest Capacity Trends (2026)
Distribution of Listings by Guest Capacity
Guest Capacity Insights for Haybes
- The most common guest capacity trend in Haybes vacation rentals is listings accommodating 6 guests (30.4%). This suggests the primary traveler segment is likely larger groups.
- Properties designed for 6 guests and 8+ guests dominate the Haybes STR market, accounting for 56.5% of listings.
- 69.5% of properties accommodate 6+ guests, serving the market segment for larger families or group travel in Haybes.
- On average, properties in Haybes are equipped to host 6.1 guests.
Haybes Airbnb Booking Patterns (2026): Available vs. Booked Days
Available Days Distribution
Booked Days Distribution
Booking Pattern Insights for Haybes
- The most common availability pattern in Haybes falls within the 181-270 days range, representing 56.5% of listings. This suggests many properties have significant open periods on their calendars.
- Approximately 86.9% of listings show high availability (181+ days open annually), indicating potential for increased bookings or specific owner usage patterns.
- For booked days, the 91-180 days range is most frequent in Haybes (56.5%), reflecting common guest stay durations or potential owner blocking patterns.
- A notable 13.0% of properties secure long booking periods (181+ days booked per year), highlighting successful long-term rental strategies or significant owner usage.
Haybes Airbnb Minimum Stay Requirements Analysis
Distribution of Listings by Minimum Night Requirement
1 Night
6 listings
26.1% of total
2 Nights
5 listings
21.7% of total
3 Nights
2 listings
8.7% of total
30+ Nights
10 listings
43.5% of total
Key Insights
- The most prevalent minimum stay requirement in Haybes is 30+ Nights, adopted by 43.5% of listings. This highlights the market's preference for longer commitments.
- A significant segment (43.5%) caters to monthly stays (30+ nights) in Haybes, pointing to opportunities in the extended-stay market.
Recommendations
- Align with the market by considering a 30+ Nights minimum stay, as 43.5% of Haybes hosts use this setting.
- If feasible, allowing 1-night stays, especially midweek or during low season, could capture last-minute bookings, as only 26.1% currently do.
- Explore offering discounts for stays of 30+ nights to attract the 43.5% of the market seeking extended stays.
- Adjust minimum nights based on seasonality – potentially shorter during low season and longer during peak demand periods in Haybes.
Haybes Airbnb Cancellation Policy Trends Analysis (2026)
Super Strict 30 Days
3 listings
13% of total
Flexible
12 listings
52.2% of total
Moderate
7 listings
30.4% of total
Firm
1 listings
4.3% of total
Cancellation Policy Insights for Haybes
- The prevailing Airbnb cancellation policy trend in Haybes is Flexible, used by 52.2% of listings.
- The market strongly favors guest-friendly terms, with 82.6% of listings offering Flexible or Moderate policies. This suggests guests in Haybes may expect booking flexibility.
Recommendations for Hosts
- Consider adopting a Flexible policy to align with the 52.2% market standard in Haybes.
- Given the high prevalence of Flexible policies (52.2%), offering this can enhance booking appeal, especially during shoulder seasons.
- Regularly review your cancellation policy against competitors and market demand shifts in Haybes.
Haybes STR Booking Lead Time Analysis (2026)
Average Booking Lead Time by Month
Booking Lead Time Insights for Haybes
- The overall average booking lead time for vacation rentals in Haybes is 40 days.
- Guests book furthest in advance for stays during December (average 75 days), likely coinciding with peak travel demand or local events.
- The shortest booking windows occur for stays in February (average 17 days), indicating more last-minute travel plans during this time.
- Seasonally, Summer (48 days avg.) sees the longest lead times, while Spring (37 days avg.) has the shortest, reflecting typical travel planning cycles.
Recommendations for Hosts
- Use the overall average lead time (40 days) as a baseline for your pricing and availability strategy in Haybes.
- For December stays, consider implementing length-of-stay discounts or slightly higher rates for bookings made less than 75 days out to capitalize on advance planning.
- Target marketing efforts for the Summer season well in advance (at least 48 days) to capture early planners.
- Monitor your own booking lead times against these Haybes averages to identify opportunities for dynamic pricing adjustments.
Popular & Essential Airbnb Amenities in Haybes (2026)
Amenity Prevalence
Amenity Insights for Haybes
- Essential amenities in Haybes that guests expect include: Heating, Kitchen, Oven, Microwave, TV, Refrigerator. Lacking these (any) could significantly impact bookings.
- Popular amenities like Wifi, Dishes and silverware, Hot water are common but not universal. Offering these can provide a competitive edge.
- Warning: Wifi is not universally provided but is considered essential globally. Ensure reliable Wifi is offered.
Recommendations for Hosts
- Ensure your listing includes all essential amenities for Haybes: Heating, Kitchen, Oven, Microwave, TV, Refrigerator.
- Prioritize adding missing essentials: Oven, Microwave, TV, Refrigerator.
- Consider adding popular differentiators like Wifi or Dishes and silverware to increase appeal.
- Highlight unique or less common amenities you offer (e.g., hot tub, dedicated workspace, EV charger) in your listing description and photos.
- Regularly check competitor amenities in Haybes to stay competitive.
Haybes Airbnb Guest Demographics & Profile Analysis (2026)
Guest Profile Summary for Haybes
- The typical guest profile for Airbnb in Haybes consists of a mix of domestic (50%) and international guests, with top international origins including Belgium, typically belonging to the Post-2000s (Gen Z/Alpha) group (50%), primarily speaking French or English.
- Domestic travelers account for 50.0% of guests.
- Key international markets include France (50%) and Belgium (27.6%).
- Top languages spoken are French (41.4%) followed by English (35.6%).
- A significant demographic segment is the Post-2000s (Gen Z/Alpha) group, representing 50% of guests.
Recommendations for Hosts
- Balance marketing efforts between domestic and international channels based on the guest mix.
- Tailor amenities and listing descriptions to appeal to the dominant Post-2000s (Gen Z/Alpha) demographic (e.g., highlight fast WiFi, smart home features, local guides).
- Highlight unique local experiences or amenities relevant to the primary guest profile.
- Consider seasonal promotions aligned with peak travel times for key origin markets.
Nearby Short-Term Rental Market Comparison
How does the Haybes Airbnb market stack up against its neighbors? Compare key performance metrics like average monthly revenue, ADR, and occupancy rates in surrounding areas to understand the broader regional STR landscape.
| Market | Active Properties | Monthly Revenue | Daily Rate | Avg. Occupancy |
|---|---|---|---|---|
| Raamsdonksveer | 16 | $7,756 | $736.17 | 38% |
| Haghorst | 11 | $5,995 | $480.40 | 40% |
| Mont-de-l'Enclus | 10 | $5,398 | $407.81 | 36% |
| Merksplas | 12 | $5,367 | $356.64 | 43% |
| Zerkegem | 10 | $4,846 | $437.72 | 57% |
| Anzegem | 10 | $4,425 | $460.61 | 35% |
| Incourt | 13 | $4,412 | $303.48 | 52% |
| Wellin | 12 | $4,365 | $446.64 | 42% |
| Aubel | 26 | $4,191 | $283.88 | 46% |
| Dizy | 11 | $4,106 | $250.48 | 49% |