Vendenheim Airbnb Market Analysis 2025: Short Term Rental Data & Vacation Rental Statistics in Grand Est, France
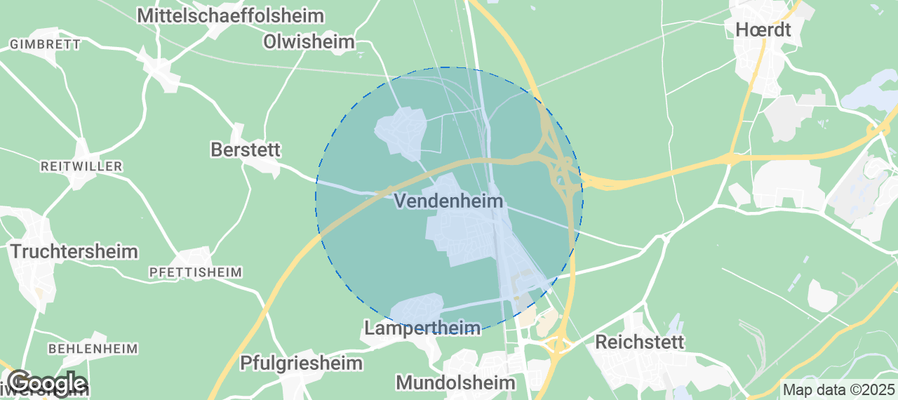
Is Airbnb profitable in Vendenheim in 2025? Explore comprehensive Airbnb analytics for Vendenheim, Grand Est, France to uncover income potential. This 2025 STR market report for Vendenheim, based on AirROI data from November 2024 to October 2025, reveals key trends in the niche market of 17 active listings.
Whether you're considering an Airbnb investment in Vendenheim, optimizing your existing vacation rental, or exploring rental arbitrage opportunities, understanding the Vendenheim Airbnb data is crucial. Leveraging the low regulation environment is key to maximizing your short term rental income potential. Let's dive into the specifics.
Key Vendenheim Airbnb Performance Metrics Overview
Monthly Airbnb Revenue Variations & Income Potential in Vendenheim (2025)
Understanding the monthly revenue variations for Airbnb listings in Vendenheim is key to maximizing your short term rental income potential. Seasonality significantly impacts earnings. Our analysis, based on data from the past 12 months, shows that the peak revenue month for STRs in Vendenheim is typically December, while March often presents the lowest earnings, highlighting opportunities for strategic pricing adjustments during shoulder and low seasons. Explore the typical Airbnb income in Vendenheim across different performance tiers:
- Best-in-class properties (Top 10%) achieve $3,269+ monthly, often utilizing dynamic pricing and superior guest experiences.
- Strong performing properties (Top 25%) earn $2,037 or more, indicating effective management and desirable locations/amenities.
- Typical properties (Median) generate around $1,251 per month, representing the average market performance.
- Entry-level properties (Bottom 25%) see earnings around $627, often with potential for optimization.
Average Monthly Airbnb Earnings Trend in Vendenheim
Vendenheim Airbnb Occupancy Rate Trends (2025)
Maximize your bookings by understanding the Vendenheim STR occupancy trends. Seasonal demand shifts significantly influence how often properties are booked. Typically, Decembersees the highest demand (peak season occupancy), while May experiences the lowest (low season). Effective strategies, like adjusting minimum stays or offering promotions, can boost occupancy during slower periods. Here's how different property tiers perform in Vendenheim:
- Best-in-class properties (Top 10%) achieve 69%+ occupancy, indicating high desirability and potentially optimized availability.
- Strong performing properties (Top 25%) maintain 49% or higher occupancy, suggesting good market fit and guest satisfaction.
- Typical properties (Median) have an occupancy rate around 33%.
- Entry-level properties (Bottom 25%) average 13% occupancy, potentially facing higher vacancy.
Average Monthly Occupancy Rate Trend in Vendenheim
Average Daily Rate (ADR) Airbnb Trends in Vendenheim (2025)
Effective short term rental pricing strategy in Vendenheim involves understanding monthly ADR fluctuations. The Average Daily Rate (ADR) for Airbnb in Vendenheim typically peaks in September and dips lowest during April. Leveraging Airbnb dynamic pricing tools or strategies based on this seasonality can significantly boost revenue. Here's a look at the typical nightly rates achieved:
- Best-in-class properties (Top 10%) command rates of $277+ per night, often due to premium features or locations.
- Strong performing properties (Top 25%) achieve nightly rates of $177 or more.
- Typical properties (Median) charge around $131 per night.
- Entry-level properties (Bottom 25%) earn around $94 per night.
Average Daily Rate (ADR) Trend by Month in Vendenheim
Get Live Vendenheim Market Intelligence 👇
Explore Real-time Analytics
Airbnb Seasonality Analysis & Trends in Vendenheim (2025)
Peak Season (December, July, November)
- Revenue averages $2,389 per month
- Occupancy rates average 43.8%
- Daily rates average $165
Shoulder Season
- Revenue averages $1,360 per month
- Occupancy maintains around 36.0%
- Daily rates hold near $152
Low Season (March, May, September)
- Revenue drops to average $977 per month
- Occupancy decreases to average 25.6%
- Daily rates adjust to average $151
Seasonality Insights for Vendenheim
- The Airbnb seasonality in Vendenheim shows highly seasonal trends requiring careful strategy. While the sections above show seasonal averages, it's also insightful to look at the extremes:
- During the high season, the absolute peak month showcases Vendenheim's highest earning potential, with monthly revenues capable of climbing to $3,393, occupancy reaching a high of 55.9%, and ADRs peaking at $178.
- Conversely, the slowest single month of the year, typically falling within the low season, marks the market's lowest point. In this month, revenue might dip to $873, occupancy could drop to 22.6%, and ADRs may adjust down to $133.
- Understanding both the seasonal averages and these monthly peaks and troughs in revenue, occupancy, and ADR is crucial for maximizing your Airbnb profit potential in Vendenheim.
Seasonal Strategies for Maximizing Profit
- Peak Season: Maximize revenue through premium pricing and potentially longer minimum stays. Ensure high availability.
- Low Season: Offer competitive pricing, special promotions (e.g., extended stay discounts), and flexible cancellation policies. Target off-season travelers like remote workers or budget-conscious guests.
- Shoulder Seasons: Implement dynamic pricing that balances peak and low rates. Target weekend travelers or specific events. Offer slightly more flexible terms than peak season.
- Regularly analyze your own performance against these Vendenheim seasonality benchmarks and adjust your pricing and availability strategy accordingly.
Best Areas for Airbnb Investment in Vendenheim (2025)
Exploring the top neighborhoods for short-term rentals in Vendenheim? This section highlights key areas, outlining why they are attractive for hosts and guests, along with notable local attractions. Consider these locations based on your target guest profile and investment strategy.
| Neighborhood / Area | Why Host Here? (Target Guests & Appeal) | Key Attractions & Landmarks |
|---|---|---|
| Vendenheim Center | Centrally located with easy access to public transport and amenities, making it a convenient spot for travelers. | Place du Marché, Église Saint-Martin, Parc des Écrivains, Vendenheim Market, Local bakeries and cafes |
| Strasbourg Proximity | Close to Strasbourg, a popular tourist destination with rich history and culture. Perfect for visitors wanting to explore the city and return to a quieter area. | Strasbourg Cathedral, La Petite France, European Parliament, Parc de l'Europe, Historical Museums |
| Cultural Quarter | An area rich in local culture and history, attracting visitors interested in the local heritage and traditions of Vendenheim. | Cultural festivals, Local art exhibitions, Wine tasting events, Historical architecture, Heritage walks |
| Nature Lovers' Haven | Surrounded by natural parks and walking trails, ideal for guests looking for a nature retreat while being close to urban conveniences. | Parc de l'European, Hiking trails, Cycling routes, Nature observation spots, Picnic areas |
| Family-Friendly Zone | Safe and welcoming area with family-friendly activities, attracting tourists traveling with children. | Local playgrounds, Family-friendly restaurants, Educational workshops, Community events, Nearby recreational facilities |
| Business Hub | Attracts business travelers due to its proximity to business centers and meeting venues, suitable for short stays. | Business conferences, Corporate events, Nearby hotels with meeting spaces, Networking opportunities, Transport links |
| Historical Sites District | Rich in history with several significant landmarks, appealing to history buffs and cultural tourists. | Old local estates, Historical landmarks, Guided city tours, Local museums, Historical reenactments |
| Gastronomy Street | Known for traditional Alsace cuisine and local dining options, attracting foodies and culinary tourists. | Local restaurants, Market days featuring local produce, Wine tasting events, Culinary festivals, Cooking classes |
Understanding Airbnb License Requirements & STR Laws in Vendenheim (2025)
While Vendenheim, Grand Est, France currently shows low STR regulations, specific Airbnb license requirements might still exist or change. Always verify the latest short term rental regulations and Airbnb license requirements directly with local government authorities for Vendenheim to ensure full compliance before hosting.
(Source: AirROI data, 2025, based on 6% licensed listings)
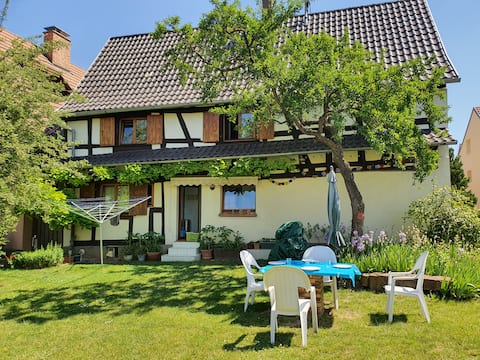
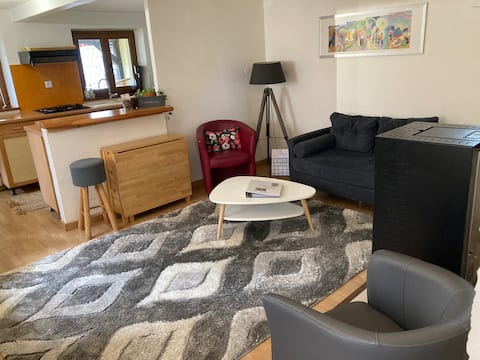
Top Performing Airbnb Properties in Vendenheim (2025)
Benchmark your potential! Explore examples of top-performing Airbnb properties in Vendenheimbased on Trailing Twelve Month (TTM) revenue. Analyze their characteristics, revenue, occupancy rate, and ADR to understand what drives success in this market.

The hairdresser's house Charming apartment
Entire Place • 1 bedroom
Alsatian house - Vendenheim, near Strasbourg
Entire Place • 3 bedrooms
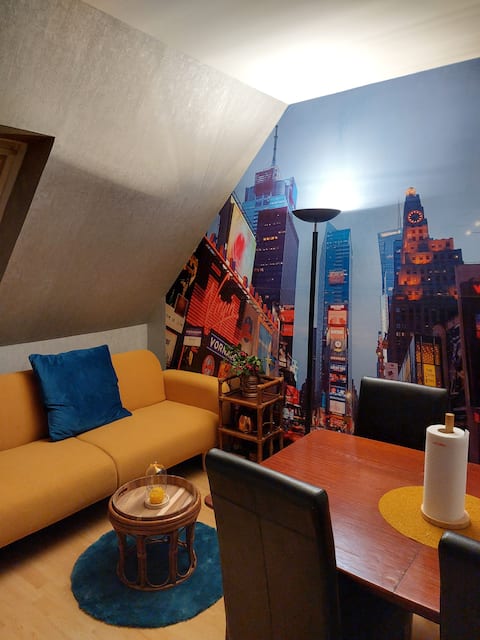
Large 2P cozy at the gates of Strasbourg
Entire Place • 2 bedrooms
House+garden, quiet, 10 min from Strasbourg
Entire Place • 2 bedrooms
Luxury villa for families, events and seminars
Entire Place • 4 bedrooms

comfortable 2 bedroom apartment
Entire Place • 1 bedroom
Note: Performance varies based on location, size, amenities, seasonality, and management quality. Data reflects the past 12 months.
Top Performing Airbnb Hosts in Vendenheim (2025)
Learn from the best! This table showcases top-performing Airbnb hosts in Vendenheim based on the number of properties managed and estimated total revenue over the past year. Analyze their scale and performance metrics.
| Host Name | Properties | Grossing Revenue | Stay Reviews | Avg Rating |
|---|---|---|---|---|
| Véronique | 1 | $23,451 | 10 | 5.00/5.0 |
| Lea | 1 | $23,094 | 19 | 4.89/5.0 |
| Nancy | 1 | $21,742 | 60 | 4.95/5.0 |
| Nadya | 2 | $20,875 | 44 | 4.75/5.0 |
| Bruno | 2 | $20,700 | 208 | 4.77/5.0 |
| Cécile | 1 | $20,347 | 16 | 4.88/5.0 |
| Nadine | 1 | $13,764 | 13 | 5.00/5.0 |
| Olivier | 1 | $12,217 | 2 | Not Rated |
| Fabrice | 1 | $10,618 | 60 | 4.48/5.0 |
| Agathe | 1 | $4,279 | 2 | Not Rated |
Analyzing the strategies of top hosts, such as their property selection, pricing, and guest communication, can offer valuable lessons for optimizing your own Airbnb operations in Vendenheim.
Dive Deeper: Advanced Vendenheim STR Market Data (2025)
Ready to unlock more insights? AirROI provides access to advanced metrics and comprehensive Airbnb data for Vendenheim. Explore detailed analytics beyond this report to refine your investment strategy, optimize pricing, and maximize your vacation rental profits.
Explore Advanced MetricsVendenheim Short-Term Rental Market Composition (2025): Property & Room Types
Room Type Distribution
Property Type Distribution
Market Composition Insights for Vendenheim
- The Vendenheim Airbnb market composition is heavily skewed towards Entire Home/Apt listings, which make up 88.2% of the 17 active rentals. This indicates strong guest preference for privacy and space.
- Looking at the property type distribution in Vendenheim, Apartment/Condo properties are the most common (52.9%), reflecting the local real estate landscape.
- Houses represent a significant 47.1% portion, catering likely to families or larger groups.
Vendenheim Airbnb Room Capacity Analysis (2025): Bedroom Distribution
Distribution of Listings by Number of Bedrooms
Room Capacity Insights for Vendenheim
- The dominant room capacity in Vendenheim is 2 bedrooms listings, making up 41.2% of the market. This suggests a strong demand for properties suitable for couples or solo travelers.
- Together, 2 bedrooms and 3 bedrooms properties represent 58.8% of the active Airbnb listings in Vendenheim, indicating a high concentration in these sizes.
- A significant 23.5% of listings offer 3+ bedrooms, catering to larger groups and families seeking more space in Vendenheim.
Vendenheim Vacation Rental Guest Capacity Trends (2025)
Distribution of Listings by Guest Capacity
Guest Capacity Insights for Vendenheim
- The most common guest capacity trend in Vendenheim vacation rentals is listings accommodating 6 guests (17.6%). This suggests the primary traveler segment is likely larger groups.
- Properties designed for 6 guests and 4 guests dominate the Vendenheim STR market, accounting for 35.2% of listings.
- 29.4% of properties accommodate 6+ guests, serving the market segment for larger families or group travel in Vendenheim.
- On average, properties in Vendenheim are equipped to host 4.2 guests.
Vendenheim Airbnb Booking Patterns (2025): Available vs. Booked Days
Available Days Distribution
Booked Days Distribution
Booking Pattern Insights for Vendenheim
- The most common availability pattern in Vendenheim falls within the 271-366 days range, representing 64.7% of listings. This suggests many properties have significant open periods on their calendars.
- Approximately 94.1% of listings show high availability (181+ days open annually), indicating potential for increased bookings or specific owner usage patterns.
- For booked days, the 31-90 days range is most frequent in Vendenheim (35.3%), reflecting common guest stay durations or potential owner blocking patterns.
- A notable 11.8% of properties secure long booking periods (181+ days booked per year), highlighting successful long-term rental strategies or significant owner usage.
Vendenheim Airbnb Minimum Stay Requirements Analysis
Distribution of Listings by Minimum Night Requirement
1 Night
3 listings
17.6% of total
2 Nights
8 listings
47.1% of total
30+ Nights
6 listings
35.3% of total
Key Insights
- The most prevalent minimum stay requirement in Vendenheim is 2 Nights, adopted by 47.1% of listings. This highlights the market's preference for shorter, flexible bookings.
- A strong majority (64.7%) of the Vendenheim Airbnb data shows acceptance of very short stays (1-2 nights), indicating a dynamic, high-turnover market.
- A significant segment (35.3%) caters to monthly stays (30+ nights) in Vendenheim, pointing to opportunities in the extended-stay market.
Recommendations
- Align with the market by considering a 2 Nights minimum stay, as 47.1% of Vendenheim hosts use this setting.
- If feasible, allowing 1-night stays, especially midweek or during low season, could capture last-minute bookings, as only 17.6% currently do.
- A 2-night minimum appears standard (47.1%). Consider this for weekends or peak periods.
- Explore offering discounts for stays of 30+ nights to attract the 35.3% of the market seeking extended stays.
- Adjust minimum nights based on seasonality – potentially shorter during low season and longer during peak demand periods in Vendenheim.
Vendenheim Airbnb Cancellation Policy Trends Analysis (2025)
Flexible
5 listings
29.4% of total
Moderate
4 listings
23.5% of total
Firm
6 listings
35.3% of total
Strict
2 listings
11.8% of total
Cancellation Policy Insights for Vendenheim
- The prevailing Airbnb cancellation policy trend in Vendenheim is Firm, used by 35.3% of listings.
- There's a relatively balanced mix between guest-friendly (52.9%) and stricter (47.1%) policies, offering choices for different guest needs.
Recommendations for Hosts
- Consider adopting a Firm policy to align with the 35.3% market standard in Vendenheim.
- Using a Strict policy might deter some guests, as only 11.8% of listings use it. Evaluate if potential revenue protection outweighs possible lower booking rates.
- Regularly review your cancellation policy against competitors and market demand shifts in Vendenheim.
Vendenheim STR Booking Lead Time Analysis (2025)
Average Booking Lead Time by Month
Booking Lead Time Insights for Vendenheim
- The overall average booking lead time for vacation rentals in Vendenheim is 36 days.
- Guests book furthest in advance for stays during December (average 64 days), likely coinciding with peak travel demand or local events.
- The shortest booking windows occur for stays in February (average 7 days), indicating more last-minute travel plans during this time.
- Seasonally, Summer (41 days avg.) sees the longest lead times, while Fall (28 days avg.) has the shortest, reflecting typical travel planning cycles.
Recommendations for Hosts
- Use the overall average lead time (36 days) as a baseline for your pricing and availability strategy in Vendenheim.
- For December stays, consider implementing length-of-stay discounts or slightly higher rates for bookings made less than 64 days out to capitalize on advance planning.
- During February, focus on last-minute booking availability and promotions, as guests book with very short notice (7 days avg.).
- Target marketing efforts for the Summer season well in advance (at least 41 days) to capture early planners.
- Monitor your own booking lead times against these Vendenheim averages to identify opportunities for dynamic pricing adjustments.
Popular & Essential Airbnb Amenities in Vendenheim (2025)
Amenity Prevalence
Amenity Insights for Vendenheim
- Essential amenities in Vendenheim that guests expect include: Heating, Hot water. Lacking these (any) could significantly impact bookings.
- Popular amenities like Smoke alarm, Cooking basics, Hangers are common but not universal. Offering these can provide a competitive edge.
- Warning: Wifi is not universally provided but is considered essential globally. Ensure reliable Wifi is offered.
Recommendations for Hosts
- Ensure your listing includes all essential amenities for Vendenheim: Heating, Hot water.
- Consider adding popular differentiators like Smoke alarm or Cooking basics to increase appeal.
- Highlight unique or less common amenities you offer (e.g., hot tub, dedicated workspace, EV charger) in your listing description and photos.
- Regularly check competitor amenities in Vendenheim to stay competitive.
Vendenheim Airbnb Guest Demographics & Profile Analysis (2025)
Guest Profile Summary for Vendenheim
- The typical guest profile for Airbnb in Vendenheim consists of primarily domestic travelers (66%), often arriving from nearby Paris, typically belonging to the Post-2000s (Gen Z/Alpha) group (50%), primarily speaking French or English.
- Domestic travelers account for 65.5% of guests.
- Key international markets include France (65.5%) and Germany (8.6%).
- Top languages spoken are French (43.2%) followed by English (29.5%).
- A significant demographic segment is the Post-2000s (Gen Z/Alpha) group, representing 50% of guests.
Recommendations for Hosts
- Target domestic marketing efforts towards travelers from Paris and Stuttgart.
- Tailor amenities and listing descriptions to appeal to the dominant Post-2000s (Gen Z/Alpha) demographic (e.g., highlight fast WiFi, smart home features, local guides).
- Highlight unique local experiences or amenities relevant to the primary guest profile.
- Consider seasonal promotions aligned with peak travel times for key origin markets.
Nearby Short-Term Rental Market Comparison
How does the Vendenheim Airbnb market stack up against its neighbors? Compare key performance metrics like average monthly revenue, ADR, and occupancy rates in surrounding areas to understand the broader regional STR landscape.
| Market | Active Properties | Monthly Revenue | Daily Rate | Avg. Occupancy |
|---|---|---|---|---|
| Rothenburg | 11 | $6,193 | $312.43 | 64% |
| Furdenheim | 15 | $5,806 | $428.67 | 45% |
| Ittenheim | 19 | $5,472 | $327.49 | 43% |
| Bassersdorf | 17 | $5,437 | $412.12 | 47% |
| Vitznau | 31 | $4,583 | $427.56 | 46% |
| Lucerne | 322 | $4,241 | $302.74 | 52% |
| Le Valtin | 13 | $3,940 | $406.23 | 43% |
| Sattel | 12 | $3,457 | $223.20 | 58% |
| Weggis | 54 | $3,413 | $276.04 | 46% |
| La Forge | 13 | $3,405 | $364.29 | 41% |