Wittenheim Airbnb Market Analysis 2026: Short Term Rental Data & Vacation Rental Statistics in Grand Est, France
Is Airbnb profitable in Wittenheim in 2026? Explore comprehensive Airbnb analytics for Wittenheim, Grand Est, France to uncover income potential. This 2026 STR market report for Wittenheim, based on AirROI data from February 2025 to January 2026, reveals key trends in the niche market of 18 active listings.
Whether you're considering an Airbnb investment in Wittenheim, optimizing your existing vacation rental, or exploring rental arbitrage opportunities, understanding the Wittenheim Airbnb data is crucial. Leveraging the low regulation environment is key to maximizing your short term rental income potential. Let's dive into the specifics.
Key Wittenheim Airbnb Performance Metrics Overview
Monthly Airbnb Revenue Variations & Income Potential in Wittenheim (2026)
Understanding the monthly revenue variations for Airbnb listings in Wittenheim is key to maximizing your short term rental income potential. Seasonality significantly impacts earnings. Our analysis, based on data from the past 12 months, shows that the peak revenue month for STRs in Wittenheim is typically December, while May often presents the lowest earnings, highlighting opportunities for strategic pricing adjustments during shoulder and low seasons. Explore the typical Airbnb income in Wittenheim across different performance tiers:
- Best-in-class properties (Top 10%) achieve $2,499+ monthly, often utilizing dynamic pricing and superior guest experiences.
- Strong performing properties (Top 25%) earn $1,497 or more, indicating effective management and desirable locations/amenities.
- Typical properties (Median) generate around $976 per month, representing the average market performance.
- Entry-level properties (Bottom 25%) see earnings around $540, often with potential for optimization.
Average Monthly Airbnb Earnings Trend in Wittenheim
Wittenheim Airbnb Occupancy Rate Trends (2026)
Maximize your bookings by understanding the Wittenheim STR occupancy trends. Seasonal demand shifts significantly influence how often properties are booked. Typically, Augustsees the highest demand (peak season occupancy), while January experiences the lowest (low season). Effective strategies, like adjusting minimum stays or offering promotions, can boost occupancy during slower periods. Here's how different property tiers perform in Wittenheim:
- Best-in-class properties (Top 10%) achieve 76%+ occupancy, indicating high desirability and potentially optimized availability.
- Strong performing properties (Top 25%) maintain 64% or higher occupancy, suggesting good market fit and guest satisfaction.
- Typical properties (Median) have an occupancy rate around 42%.
- Entry-level properties (Bottom 25%) average 23% occupancy, potentially facing higher vacancy.
Average Monthly Occupancy Rate Trend in Wittenheim
Average Daily Rate (ADR) Airbnb Trends in Wittenheim (2026)
Effective short term rental pricing strategy in Wittenheim involves understanding monthly ADR fluctuations. The Average Daily Rate (ADR) for Airbnb in Wittenheim typically peaks in December and dips lowest during March. Leveraging Airbnb dynamic pricing tools or strategies based on this seasonality can significantly boost revenue. Here's a look at the typical nightly rates achieved:
- Best-in-class properties (Top 10%) command rates of $143+ per night, often due to premium features or locations.
- Strong performing properties (Top 25%) achieve nightly rates of $115 or more.
- Typical properties (Median) charge around $72 per night.
- Entry-level properties (Bottom 25%) earn around $48 per night.
Average Daily Rate (ADR) Trend by Month in Wittenheim
Get Live Wittenheim Market Intelligence 👇
Explore Real-time Analytics
Airbnb Seasonality Analysis & Trends in Wittenheim (2026)
Peak Season (December, August, July)
- Revenue averages $1,559 per month
- Occupancy rates average 53.5%
- Daily rates average $91
Shoulder Season
- Revenue averages $1,153 per month
- Occupancy maintains around 42.9%
- Daily rates hold near $92
Low Season (March, April, May)
- Revenue drops to average $936 per month
- Occupancy decreases to average 35.4%
- Daily rates adjust to average $78
Seasonality Insights for Wittenheim
- The Airbnb seasonality in Wittenheim shows moderate seasonality with distinct peak and low periods. While the sections above show seasonal averages, it's also insightful to look at the extremes:
- During the high season, the absolute peak month showcases Wittenheim's highest earning potential, with monthly revenues capable of climbing to $1,675, occupancy reaching a high of 61.3%, and ADRs peaking at $108.
- Conversely, the slowest single month of the year, typically falling within the low season, marks the market's lowest point. In this month, revenue might dip to $909, occupancy could drop to 27.6%, and ADRs may adjust down to $77.
- Understanding both the seasonal averages and these monthly peaks and troughs in revenue, occupancy, and ADR is crucial for maximizing your Airbnb profit potential in Wittenheim.
Seasonal Strategies for Maximizing Profit
- Peak Season: Maximize revenue through premium pricing and potentially longer minimum stays. Ensure high availability.
- Low Season: Offer competitive pricing, special promotions (e.g., extended stay discounts), and flexible cancellation policies. Target off-season travelers like remote workers or budget-conscious guests.
- Shoulder Seasons: Implement dynamic pricing that balances peak and low rates. Target weekend travelers or specific events. Offer slightly more flexible terms than peak season.
- Regularly analyze your own performance against these Wittenheim seasonality benchmarks and adjust your pricing and availability strategy accordingly.
Best Areas for Airbnb Investment in Wittenheim (2026)
Exploring the top neighborhoods for short-term rentals in Wittenheim? This section highlights key areas, outlining why they are attractive for hosts and guests, along with notable local attractions. Consider these locations based on your target guest profile and investment strategy.
| Neighborhood / Area | Why Host Here? (Target Guests & Appeal) | Key Attractions & Landmarks |
|---|---|---|
| City Center | The vibrant heart of Wittenheim with easy access to public transport, shopping, and dining. Ideal for tourists and business travelers who want to be in the middle of the action. | Wittenheim Market, Cultural events, Local eateries, Public parks, Library |
| Parc du Petit Prince | A beautiful park that attracts families and nature lovers. Hosting an Airbnb here appeals to those seeking relaxation and outdoor activities. | Parc du Petit Prince, Walking trails, Playgrounds, Picnic areas |
| Les Murailles | A residential area known for its charming homes and friendly community feel. Great for long-term stays for families and professionals. | Local shops, Community parks, Nearby schools |
| Route de Cernay | A well-connected area with easy access to nearby cities and attractions. Suitable for business travelers and visitors exploring the Alsace region. | Proximity to Cernay, Transport links, Local dining options |
| Église Saint-Louis | A historical area with cultural significance. Attracts tourists interested in history, architecture, and local culture. | Église Saint-Louis, Cultural heritage sites, Local festivals |
| Les Quatre Routes | A growing area with new developments and amenities. Popular among young professionals and families looking for modern conveniences. | New shopping centers, Dining options, Community activities |
| Wittenheim’s Industrial Area | Close to major industrial and tech hubs, appealing to business travelers and employees in the area. Great for short to medium stays. | Proximity to industries, Business parks, Transport access |
| Cottage Area | A quiet neighborhood known for its scenic views and countryside feel. Perfect for guests looking to escape the hustle of city life. | Scenic landscapes, Nearby farms, Outdoor activities |
Understanding Airbnb License Requirements & STR Laws in Wittenheim (2026)
While Wittenheim, Grand Est, France currently shows low STR regulations, specific Airbnb license requirements might still exist or change. Always verify the latest short term rental regulations and Airbnb license requirements directly with local government authorities for Wittenheim to ensure full compliance before hosting.
(Source: AirROI data, 2026, based on 6% licensed listings)
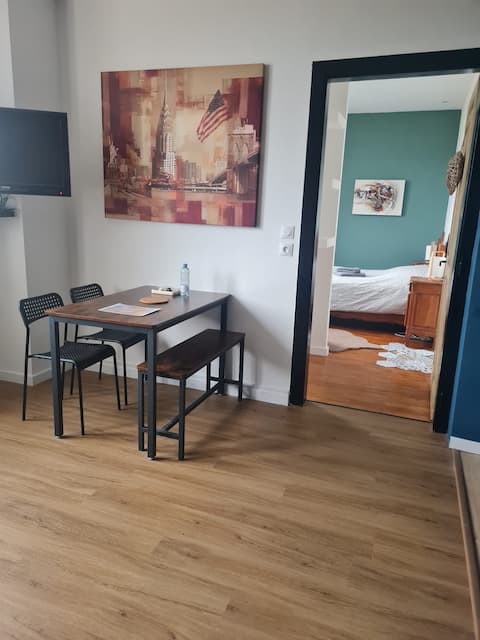
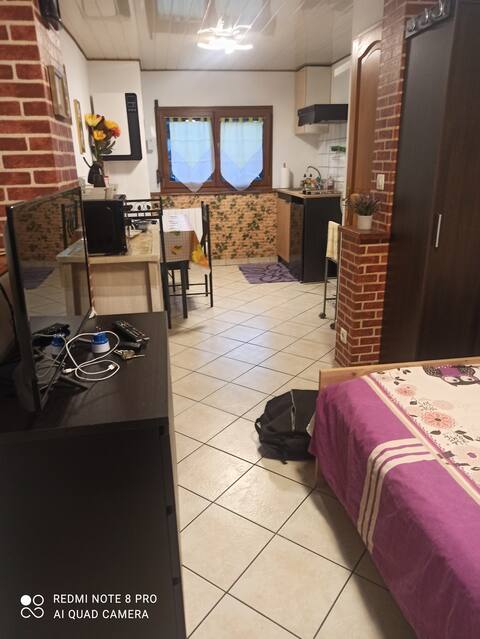
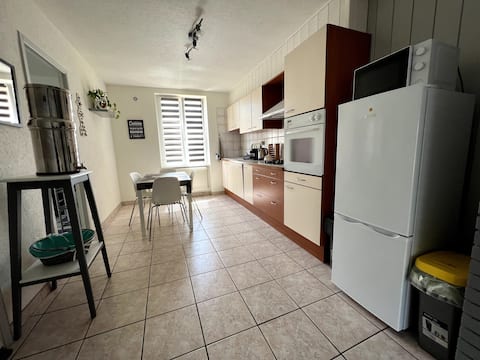
Top Performing Airbnb Properties in Wittenheim (2026)
Benchmark your potential! Explore examples of top-performing Airbnb properties in Wittenheimbased on Trailing Twelve Month (TTM) revenue. Analyze their characteristics, revenue, occupancy rate, and ADR to understand what drives success in this market.
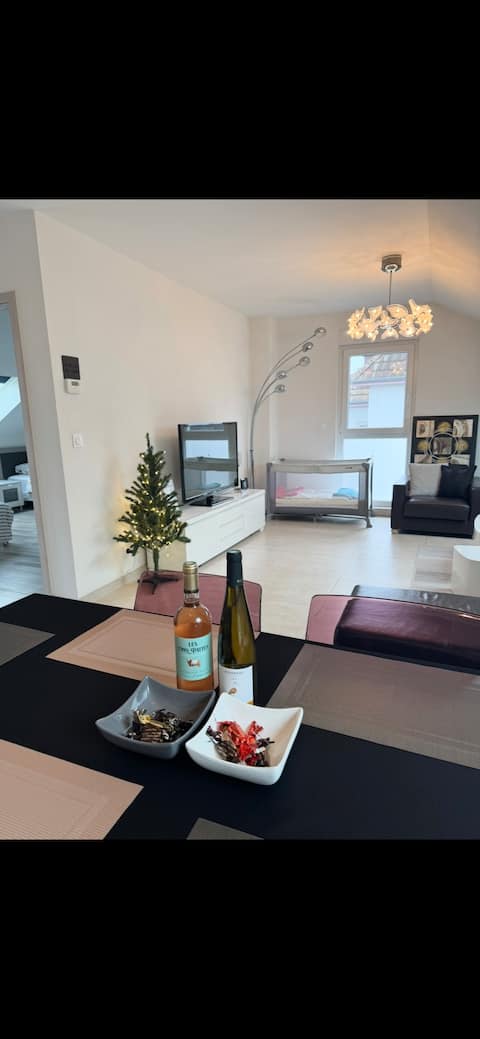
New penthouse with comfort
Entire Place • 3 bedrooms
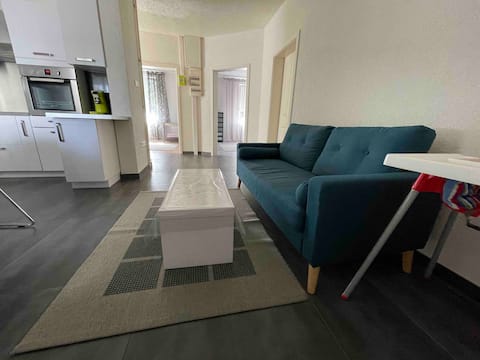
Cozy apartment with separate entrance.
Entire Place • 3 bedrooms
studio for 4 people near tourist attractions
Entire Place • 1 bedroom
f2 fully equipped on Wittenheim
Entire Place • 1 bedroom
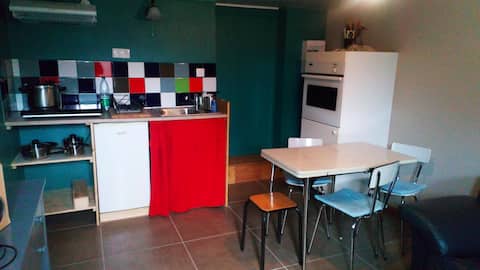
fully equipped single-storey apartment
Entire Place • 1 bedroom
Very well located apartment in Wittenheim.
Entire Place • 1 bedroom
Note: Performance varies based on location, size, amenities, seasonality, and management quality. Data reflects the past 12 months.
Top Performing Airbnb Hosts in Wittenheim (2026)
Learn from the best! This table showcases top-performing Airbnb hosts in Wittenheim based on the number of properties managed and estimated total revenue over the past year. Analyze their scale and performance metrics.
| Host Name | Properties | Grossing Revenue | Stay Reviews | Avg Rating |
|---|---|---|---|---|
| Bes | 2 | $54,538 | 59 | 4.69/5.0 |
| Richardot | 2 | $18,451 | 191 | 4.88/5.0 |
| Patricia | 1 | $13,937 | 222 | 4.82/5.0 |
| CATHY Et MIKE | 1 | $13,715 | 17 | 4.71/5.0 |
| Raphaël | 1 | $12,195 | 67 | 4.99/5.0 |
| Dominique | 1 | $10,170 | 70 | 4.81/5.0 |
| Jessica | 1 | $9,100 | 3 | 5.00/5.0 |
| Josiane | 1 | $8,507 | 31 | 4.81/5.0 |
| Astral | 1 | $7,079 | 25 | 4.72/5.0 |
| Marie Paule | 1 | $6,753 | 12 | 4.92/5.0 |
Analyzing the strategies of top hosts, such as their property selection, pricing, and guest communication, can offer valuable lessons for optimizing your own Airbnb operations in Wittenheim.
Dive Deeper: Advanced Wittenheim STR Market Data (2026)
Ready to unlock more insights? AirROI provides access to advanced metrics and comprehensive Airbnb data for Wittenheim. Explore detailed analytics beyond this report to refine your investment strategy, optimize pricing, and maximize your vacation rental profits.
Explore Advanced MetricsWittenheim Short-Term Rental Market Composition (2026): Property & Room Types
Room Type Distribution
Property Type Distribution
Market Composition Insights for Wittenheim
- The Wittenheim Airbnb market composition is heavily skewed towards Entire Home/Apt listings, which make up 77.8% of the 18 active rentals. This indicates strong guest preference for privacy and space.
- Looking at the property type distribution in Wittenheim, Apartment/Condo properties are the most common (44.4%), reflecting the local real estate landscape.
- Houses represent a significant 44.4% portion, catering likely to families or larger groups.
- The presence of 5.6% Hotel/Boutique listings indicates integration with traditional hospitality.
Wittenheim Airbnb Room Capacity Analysis (2026): Bedroom Distribution
Distribution of Listings by Number of Bedrooms
Room Capacity Insights for Wittenheim
- The dominant room capacity in Wittenheim is 1 bedroom listings, making up 38.9% of the market. This suggests a strong demand for properties suitable for couples or solo travelers.
- Together, 1 bedroom and 2 bedrooms properties represent 72.2% of the active Airbnb listings in Wittenheim, indicating a high concentration in these sizes.
Wittenheim Vacation Rental Guest Capacity Trends (2026)
Distribution of Listings by Guest Capacity
Guest Capacity Insights for Wittenheim
- The most common guest capacity trend in Wittenheim vacation rentals is listings accommodating 4 guests (38.9%). This suggests the primary traveler segment is likely small families or groups.
- Properties designed for 4 guests and 5 guests dominate the Wittenheim STR market, accounting for 50.0% of listings.
- 16.7% of properties accommodate 6+ guests, serving the market segment for larger families or group travel in Wittenheim.
- On average, properties in Wittenheim are equipped to host 3.8 guests.
Wittenheim Airbnb Booking Patterns (2026): Available vs. Booked Days
Available Days Distribution
Booked Days Distribution
Booking Pattern Insights for Wittenheim
- The most common availability pattern in Wittenheim falls within the 181-270 days range, representing 38.9% of listings. This suggests many properties have significant open periods on their calendars.
- Approximately 77.8% of listings show high availability (181+ days open annually), indicating potential for increased bookings or specific owner usage patterns.
- For booked days, the 91-180 days range is most frequent in Wittenheim (38.9%), reflecting common guest stay durations or potential owner blocking patterns.
- A notable 22.3% of properties secure long booking periods (181+ days booked per year), highlighting successful long-term rental strategies or significant owner usage.
Wittenheim Airbnb Minimum Stay Requirements Analysis
Distribution of Listings by Minimum Night Requirement
1 Night
7 listings
38.9% of total
2 Nights
4 listings
22.2% of total
4-6 Nights
1 listings
5.6% of total
7-29 Nights
1 listings
5.6% of total
30+ Nights
5 listings
27.8% of total
Key Insights
- The most prevalent minimum stay requirement in Wittenheim is 1 Night, adopted by 38.9% of listings. This highlights the market's preference for shorter, flexible bookings.
- A strong majority (61.1%) of the Wittenheim Airbnb data shows acceptance of very short stays (1-2 nights), indicating a dynamic, high-turnover market.
- A significant segment (27.8%) caters to monthly stays (30+ nights) in Wittenheim, pointing to opportunities in the extended-stay market.
Recommendations
- Align with the market by considering a 1 Night minimum stay, as 38.9% of Wittenheim hosts use this setting.
- Explore offering discounts for stays of 30+ nights to attract the 27.8% of the market seeking extended stays.
- Adjust minimum nights based on seasonality – potentially shorter during low season and longer during peak demand periods in Wittenheim.
Wittenheim Airbnb Cancellation Policy Trends Analysis (2026)
Flexible
10 listings
55.6% of total
Moderate
5 listings
27.8% of total
Firm
3 listings
16.7% of total
Cancellation Policy Insights for Wittenheim
- The prevailing Airbnb cancellation policy trend in Wittenheim is Flexible, used by 55.6% of listings.
- The market strongly favors guest-friendly terms, with 83.4% of listings offering Flexible or Moderate policies. This suggests guests in Wittenheim may expect booking flexibility.
Recommendations for Hosts
- Consider adopting a Flexible policy to align with the 55.6% market standard in Wittenheim.
- Given the high prevalence of Flexible policies (55.6%), offering this can enhance booking appeal, especially during shoulder seasons.
- Regularly review your cancellation policy against competitors and market demand shifts in Wittenheim.
Wittenheim STR Booking Lead Time Analysis (2026)
Average Booking Lead Time by Month
Booking Lead Time Insights for Wittenheim
- The overall average booking lead time for vacation rentals in Wittenheim is 49 days.
- Guests book furthest in advance for stays during July (average 63 days), likely coinciding with peak travel demand or local events.
- The shortest booking windows occur for stays in February (average 21 days), indicating more last-minute travel plans during this time.
- Seasonally, Summer (59 days avg.) sees the longest lead times, while Winter (37 days avg.) has the shortest, reflecting typical travel planning cycles.
Recommendations for Hosts
- Use the overall average lead time (49 days) as a baseline for your pricing and availability strategy in Wittenheim.
- For July stays, consider implementing length-of-stay discounts or slightly higher rates for bookings made less than 63 days out to capitalize on advance planning.
- Target marketing efforts for the Summer season well in advance (at least 59 days) to capture early planners.
- Monitor your own booking lead times against these Wittenheim averages to identify opportunities for dynamic pricing adjustments.
Popular & Essential Airbnb Amenities in Wittenheim (2026)
Amenity Prevalence
Amenity Insights for Wittenheim
- Popular amenities like Heating, Microwave, Hangers are common but not universal. Offering these can provide a competitive edge.
- Warning: Wifi is not universally provided but is considered essential globally. Ensure reliable Wifi is offered.
Recommendations for Hosts
- Consider adding popular differentiators like Heating or Microwave to increase appeal.
- Highlight unique or less common amenities you offer (e.g., hot tub, dedicated workspace, EV charger) in your listing description and photos.
- Regularly check competitor amenities in Wittenheim to stay competitive.
Wittenheim Airbnb Guest Demographics & Profile Analysis (2026)
Guest Profile Summary for Wittenheim
- The typical guest profile for Airbnb in Wittenheim consists of primarily domestic travelers (69%), often arriving from nearby Strasbourg, typically belonging to the Post-2000s (Gen Z/Alpha) group (50%), primarily speaking French or English.
- Domestic travelers account for 68.7% of guests.
- Key international markets include France (68.7%) and Germany (7.8%).
- Top languages spoken are French (33.1%) followed by English (29.1%).
- A significant demographic segment is the Post-2000s (Gen Z/Alpha) group, representing 50% of guests.
Recommendations for Hosts
- Target domestic marketing efforts towards travelers from Strasbourg and Paris.
- Tailor amenities and listing descriptions to appeal to the dominant Post-2000s (Gen Z/Alpha) demographic (e.g., highlight fast WiFi, smart home features, local guides).
- Highlight unique local experiences or amenities relevant to the primary guest profile.
- Consider seasonal promotions aligned with peak travel times for key origin markets.
Nearby Short-Term Rental Market Comparison
How does the Wittenheim Airbnb market stack up against its neighbors? Compare key performance metrics like average monthly revenue, ADR, and occupancy rates in surrounding areas to understand the broader regional STR landscape.
| Market | Active Properties | Monthly Revenue | Daily Rate | Avg. Occupancy |
|---|---|---|---|---|
| Brienzwiler | 11 | $7,335 | $514.27 | 60% |
| Ittenheim | 20 | $6,532 | $404.34 | 42% |
| Niederried bei Interlaken | 19 | $6,267 | $552.03 | 44% |
| Lauterbrunnen | 552 | $6,108 | $487.83 | 51% |
| Furdenheim | 14 | $6,054 | $470.22 | 50% |
| Matten bei Interlaken | 64 | $5,607 | $336.51 | 59% |
| Grindelwald | 513 | $5,587 | $396.62 | 56% |
| Bassersdorf | 16 | $5,337 | $431.59 | 46% |
| Wengen | 12 | $5,115 | $595.38 | 46% |
| Oberhofen am Thunersee | 25 | $5,051 | $329.28 | 51% |