Bondues Airbnb Market Analysis 2025: Short Term Rental Data & Vacation Rental Statistics in Hauts-de-France, France
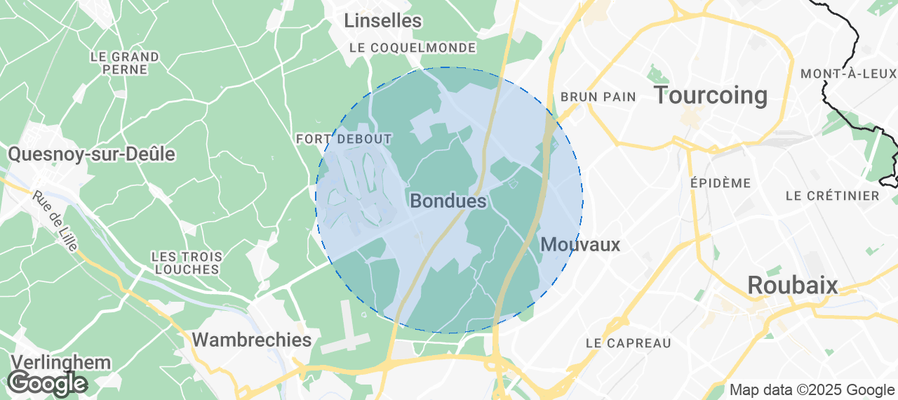
Is Airbnb profitable in Bondues in 2025? Explore comprehensive Airbnb analytics for Bondues, Hauts-de-France, France to uncover income potential. This 2025 STR market report for Bondues, based on AirROI data from July 2024 to June 2025, reveals key trends in the niche market of 18 active listings.
Whether you're considering an Airbnb investment in Bondues, optimizing your existing vacation rental, or exploring rental arbitrage opportunities, understanding the Bondues Airbnb data is crucial. Leveraging the low regulation environment is key to maximizing your short term rental income potential. Let's dive into the specifics.
Key Bondues Airbnb Performance Metrics Overview
Monthly Airbnb Revenue Variations & Income Potential in Bondues (2025)
Understanding the monthly revenue variations for Airbnb listings in Bondues is key to maximizing your short term rental income potential. Seasonality significantly impacts earnings. Our analysis, based on data from the past 12 months, shows that the peak revenue month for STRs in Bondues is typically July, while April often presents the lowest earnings, highlighting opportunities for strategic pricing adjustments during shoulder and low seasons. Explore the typical Airbnb income in Bondues across different performance tiers:
- Best-in-class properties (Top 10%) achieve $5,083+ monthly, often utilizing dynamic pricing and superior guest experiences.
- Strong performing properties (Top 25%) earn $2,810 or more, indicating effective management and desirable locations/amenities.
- Typical properties (Median) generate around $1,309 per month, representing the average market performance.
- Entry-level properties (Bottom 25%) see earnings around $757, often with potential for optimization.
Average Monthly Airbnb Earnings Trend in Bondues
Bondues Airbnb Occupancy Rate Trends (2025)
Maximize your bookings by understanding the Bondues STR occupancy trends. Seasonal demand shifts significantly influence how often properties are booked. Typically, Augustsees the highest demand (peak season occupancy), while March experiences the lowest (low season). Effective strategies, like adjusting minimum stays or offering promotions, can boost occupancy during slower periods. Here's how different property tiers perform in Bondues:
- Best-in-class properties (Top 10%) achieve 78%+ occupancy, indicating high desirability and potentially optimized availability.
- Strong performing properties (Top 25%) maintain 62% or higher occupancy, suggesting good market fit and guest satisfaction.
- Typical properties (Median) have an occupancy rate around 34%.
- Entry-level properties (Bottom 25%) average 21% occupancy, potentially facing higher vacancy.
Average Monthly Occupancy Rate Trend in Bondues
Average Daily Rate (ADR) Airbnb Trends in Bondues (2025)
Effective short term rental pricing strategy in Bondues involves understanding monthly ADR fluctuations. The Average Daily Rate (ADR) for Airbnb in Bondues typically peaks in August and dips lowest during November. Leveraging Airbnb dynamic pricing tools or strategies based on this seasonality can significantly boost revenue. Here's a look at the typical nightly rates achieved:
- Best-in-class properties (Top 10%) command rates of $587+ per night, often due to premium features or locations.
- Strong performing properties (Top 25%) achieve nightly rates of $318 or more.
- Typical properties (Median) charge around $173 per night.
- Entry-level properties (Bottom 25%) earn around $119 per night.
Average Daily Rate (ADR) Trend by Month in Bondues
Get Live Bondues Market Intelligence 👇
Explore Real-time Analytics
Airbnb Seasonality Analysis & Trends in Bondues (2025)
Peak Season (July, August, December)
- Revenue averages $3,641 per month
- Occupancy rates average 50.9%
- Daily rates average $259
Shoulder Season
- Revenue averages $1,870 per month
- Occupancy maintains around 43.0%
- Daily rates hold near $255
Low Season (February, March, April)
- Revenue drops to average $1,124 per month
- Occupancy decreases to average 28.6%
- Daily rates adjust to average $261
Seasonality Insights for Bondues
- The Airbnb seasonality in Bondues shows highly seasonal trends requiring careful strategy. While the sections above show seasonal averages, it's also insightful to look at the extremes:
- During the high season, the absolute peak month showcases Bondues's highest earning potential, with monthly revenues capable of climbing to $4,126, occupancy reaching a high of 54.9%, and ADRs peaking at $275.
- Conversely, the slowest single month of the year, typically falling within the low season, marks the market's lowest point. In this month, revenue might dip to $1,092, occupancy could drop to 24.6%, and ADRs may adjust down to $242.
- Understanding both the seasonal averages and these monthly peaks and troughs in revenue, occupancy, and ADR is crucial for maximizing your Airbnb profit potential in Bondues.
Seasonal Strategies for Maximizing Profit
- Peak Season: Maximize revenue through premium pricing and potentially longer minimum stays. Ensure high availability.
- Low Season: Offer competitive pricing, special promotions (e.g., extended stay discounts), and flexible cancellation policies. Target off-season travelers like remote workers or budget-conscious guests.
- Shoulder Seasons: Implement dynamic pricing that balances peak and low rates. Target weekend travelers or specific events. Offer slightly more flexible terms than peak season.
- Regularly analyze your own performance against these Bondues seasonality benchmarks and adjust your pricing and availability strategy accordingly.
Best Areas for Airbnb Investment in Bondues (2025)
Exploring the top neighborhoods for short-term rentals in Bondues? This section highlights key areas, outlining why they are attractive for hosts and guests, along with notable local attractions. Consider these locations based on your target guest profile and investment strategy.
| Neighborhood / Area | Why Host Here? (Target Guests & Appeal) | Key Attractions & Landmarks |
|---|---|---|
| Bondues Center | The charming center of Bondues, close to shops, cafés, and restaurants. Ideal for visitors looking to experience local culture and amenities. | Bondues Church, Local Cafés, Shopping District, Parc de la Deûle |
| La Scarpe | A tranquil area known for its beautiful parks and nature views. Perfect for families and nature lovers seeking a peaceful stay. | Parc du Héron, La Scarpe River, Nature Trails, Picnic Areas |
| Golf de Bondues | Home to a renowned golf course, attracting golf enthusiasts and those interested in outdoor activities. A great place for sport-oriented guests. | Golf de Bondues, Driving Range, Clubhouse, Golf Lessons |
| Lille | Just a short distance from Bondues, Lille offers vibrant urban living with rich history and entertainment. Ideal for tourists who want nearby city amenities. | Grand Place, Lille Zoo, Palais des Beaux-Arts, Old Lille |
| Roubaix | Nearby Roubaix combines history and modernity with its art scene and textile heritage. Appeals to artistic travelers and those curious about local history. | La Piscine Museum, Roubaix Market, Villa Cavrois, Contemporary Art |
| Cysoing | A quiet suburb with a village feel, perfect for visitors wanting a peaceful retreat while still being close to urban areas. Offers a relaxed atmosphere. | Parc Naturel, Cycling Routes, Local Markets, Village Center |
| Mouvaux | A charming town with beautiful streets and parks, attracting families and those looking for a safe residential feel during their stay. | Mouvaux Town Center, Local Parks, Community Events, Historical Buildings |
| Bondues Historical Homes | This area features historical homes and architecture, providing a unique backdrop for visitors interested in history and culture. | Historical Architecture, Cultural Tours, Local Museums, Art Exhibitions |
Understanding Airbnb License Requirements & STR Laws in Bondues (2025)
While Bondues, Hauts-de-France, France currently shows low STR regulations, specific Airbnb license requirements might still exist or change. Always verify the latest short term rental regulations and Airbnb license requirements directly with local government authorities for Bondues to ensure full compliance before hosting.
(Source: AirROI data, 2025, finding no licensed listings among those analyzed)
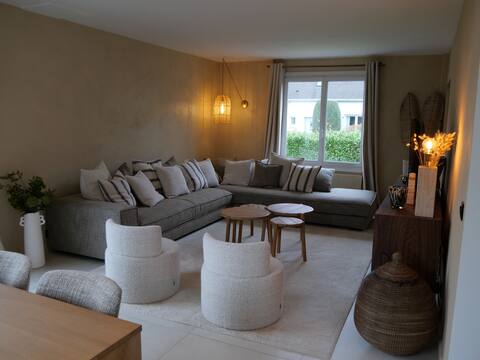
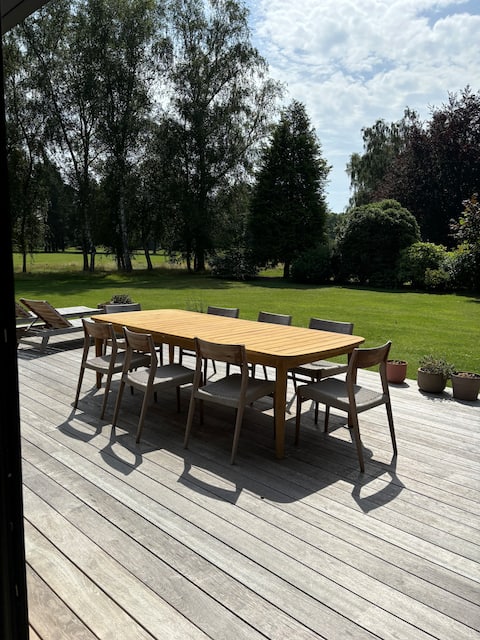
Top Performing Airbnb Properties in Bondues (2025)
Benchmark your potential! Explore examples of top-performing Airbnb properties in Bonduesbased on Trailing Twelve Month (TTM) revenue. Analyze their characteristics, revenue, occupancy rate, and ADR to understand what drives success in this market.

House with garden in Bondues
Entire Place • 5 bedrooms

Family house with garden and pool
Entire Place • 3 bedrooms

Family home with garden
Entire Place • 3 bedrooms
House with garden, near center & golf course
Entire Place • 3 bedrooms

Architect designed House
Entire Place • 4 bedrooms
House at the foot of the golf course
Entire Place • 4 bedrooms
Note: Performance varies based on location, size, amenities, seasonality, and management quality. Data reflects the past 12 months.
Top Performing Airbnb Hosts in Bondues (2025)
Learn from the best! This table showcases top-performing Airbnb hosts in Bondues based on the number of properties managed and estimated total revenue over the past year. Analyze their scale and performance metrics.
| Host Name | Properties | Grossing Revenue | Stay Reviews | Avg Rating |
|---|---|---|---|---|
| Gilles | 1 | $56,005 | 105 | 4.94/5.0 |
| Candice | 1 | $32,660 | 1 | Not Rated |
| Perrine | 1 | $28,498 | 9 | 5.00/5.0 |
| Alexis | 1 | $23,975 | 5 | 4.60/5.0 |
| Stephanie | 1 | $18,204 | 11 | 4.82/5.0 |
| Melanie | 1 | $15,152 | 1 | Not Rated |
| Louis | 1 | $12,951 | 6 | 5.00/5.0 |
| Jérôme | 1 | $12,054 | 94 | 4.90/5.0 |
| Marie | 1 | $11,622 | 43 | 4.88/5.0 |
| Alain | 1 | $11,376 | 5 | 5.00/5.0 |
Analyzing the strategies of top hosts, such as their property selection, pricing, and guest communication, can offer valuable lessons for optimizing your own Airbnb operations in Bondues.
Dive Deeper: Advanced Bondues STR Market Data (2025)
Ready to unlock more insights? AirROI provides access to advanced metrics and comprehensive Airbnb data for Bondues. Explore detailed analytics beyond this report to refine your investment strategy, optimize pricing, and maximize your vacation rental profits.
Explore Advanced MetricsBondues Short-Term Rental Market Composition (2025): Property & Room Types
Room Type Distribution
Property Type Distribution
Market Composition Insights for Bondues
- The Bondues Airbnb market composition is heavily skewed towards Entire Home/Apt listings, which make up 100% of the 18 active rentals. This indicates strong guest preference for privacy and space.
- Looking at the property type distribution in Bondues, House properties are the most common (88.9%), reflecting the local real estate landscape.
- Houses represent a significant 88.9% portion, catering likely to families or larger groups.
Bondues Airbnb Room Capacity Analysis (2025): Bedroom Distribution
Distribution of Listings by Number of Bedrooms
Room Capacity Insights for Bondues
- The dominant room capacity in Bondues is 3 bedrooms listings, making up 33.3% of the market. This suggests a strong demand for properties suitable for families or small groups.
- Together, 3 bedrooms and 4 bedrooms properties represent 50.0% of the active Airbnb listings in Bondues, indicating a high concentration in these sizes.
- A significant 61.1% of listings offer 3+ bedrooms, catering to larger groups and families seeking more space in Bondues.
Bondues Vacation Rental Guest Capacity Trends (2025)
Distribution of Listings by Guest Capacity
Guest Capacity Insights for Bondues
- The most common guest capacity trend in Bondues vacation rentals is listings accommodating 4 guests (27.8%). This suggests the primary traveler segment is likely small families or groups.
- Properties designed for 4 guests and 8+ guests dominate the Bondues STR market, accounting for 50.0% of listings.
- 44.4% of properties accommodate 6+ guests, serving the market segment for larger families or group travel in Bondues.
- On average, properties in Bondues are equipped to host 5.2 guests.
Bondues Airbnb Booking Patterns (2025): Available vs. Booked Days
Available Days Distribution
Booked Days Distribution
Booking Pattern Insights for Bondues
- The most common availability pattern in Bondues falls within the 271-366 days range, representing 61.1% of listings. This suggests many properties have significant open periods on their calendars.
- Approximately 88.9% of listings show high availability (181+ days open annually), indicating potential for increased bookings or specific owner usage patterns.
- For booked days, the 91-180 days range is most frequent in Bondues (33.3%), reflecting common guest stay durations or potential owner blocking patterns.
- A notable 11.2% of properties secure long booking periods (181+ days booked per year), highlighting successful long-term rental strategies or significant owner usage.
Bondues Airbnb Minimum Stay Requirements Analysis
Distribution of Listings by Minimum Night Requirement
1 Night
2 listings
12.5% of total
2 Nights
8 listings
50% of total
3 Nights
4 listings
25% of total
4-6 Nights
1 listings
6.3% of total
30+ Nights
1 listings
6.3% of total
Key Insights
- The most prevalent minimum stay requirement in Bondues is 2 Nights, adopted by 50% of listings. This highlights the market's preference for shorter, flexible bookings.
- A strong majority (62.5%) of the Bondues Airbnb data shows acceptance of very short stays (1-2 nights), indicating a dynamic, high-turnover market.
Recommendations
- Align with the market by considering a 2 Nights minimum stay, as 50% of Bondues hosts use this setting.
- If feasible, allowing 1-night stays, especially midweek or during low season, could capture last-minute bookings, as only 12.5% currently do.
- A 2-night minimum appears standard (50%). Consider this for weekends or peak periods.
- Explore offering discounts for stays of 30+ nights to attract the 6.3% of the market seeking extended stays.
- Adjust minimum nights based on seasonality – potentially shorter during low season and longer during peak demand periods in Bondues.
Bondues Airbnb Cancellation Policy Trends Analysis (2025)
Flexible
6 listings
33.3% of total
Moderate
5 listings
27.8% of total
Firm
3 listings
16.7% of total
Strict
4 listings
22.2% of total
Cancellation Policy Insights for Bondues
- The prevailing Airbnb cancellation policy trend in Bondues is Flexible, used by 33.3% of listings.
- There's a relatively balanced mix between guest-friendly (61.1%) and stricter (38.9%) policies, offering choices for different guest needs.
Recommendations for Hosts
- Consider adopting a Flexible policy to align with the 33.3% market standard in Bondues.
- Regularly review your cancellation policy against competitors and market demand shifts in Bondues.
Bondues STR Booking Lead Time Analysis (2025)
Average Booking Lead Time by Month
Booking Lead Time Insights for Bondues
- The overall average booking lead time for vacation rentals in Bondues is 35 days.
- Guests book furthest in advance for stays during May (average 75 days), likely coinciding with peak travel demand or local events.
- The shortest booking windows occur for stays in January (average 14 days), indicating more last-minute travel plans during this time.
- Seasonally, Spring (50 days avg.) sees the longest lead times, while Winter (26 days avg.) has the shortest, reflecting typical travel planning cycles.
Recommendations for Hosts
- Use the overall average lead time (35 days) as a baseline for your pricing and availability strategy in Bondues.
- For May stays, consider implementing length-of-stay discounts or slightly higher rates for bookings made less than 75 days out to capitalize on advance planning.
- During January, focus on last-minute booking availability and promotions, as guests book with very short notice (14 days avg.).
- Target marketing efforts for the Spring season well in advance (at least 50 days) to capture early planners.
- Monitor your own booking lead times against these Bondues averages to identify opportunities for dynamic pricing adjustments.
Popular & Essential Airbnb Amenities in Bondues (2025)
Amenity data is currently unavailable for Bondues.
Bondues Airbnb Guest Demographics & Profile Analysis (2025)
Guest Profile Summary for Bondues
- The typical guest profile for Airbnb in Bondues consists of primarily domestic travelers (77%), often arriving from nearby Paris, typically belonging to the Post-2000s (Gen Z/Alpha) group (50%), primarily speaking French or English.
- Domestic travelers account for 77.3% of guests.
- Key international markets include France (77.3%) and United Kingdom (9.1%).
- Top languages spoken are French (42.9%) followed by English (32.9%).
- A significant demographic segment is the Post-2000s (Gen Z/Alpha) group, representing 50% of guests.
Recommendations for Hosts
- Target domestic marketing efforts towards travelers from Paris and Lille.
- Tailor amenities and listing descriptions to appeal to the dominant Post-2000s (Gen Z/Alpha) demographic (e.g., highlight fast WiFi, smart home features, local guides).
- Highlight unique local experiences or amenities relevant to the primary guest profile.
- Consider seasonal promotions aligned with peak travel times for key origin markets.
Nearby Short-Term Rental Market Comparison
How does the Bondues Airbnb market stack up against its neighbors? Compare key performance metrics like average monthly revenue, ADR, and occupancy rates in surrounding areas to understand the broader regional STR landscape.
| Market | Active Properties | Monthly Revenue | Daily Rate | Avg. Occupancy |
|---|---|---|---|---|
| Merksplas | 11 | $6,282 | $357.33 | 47% |
| Lo-Reninge | 13 | $5,882 | $436.63 | 46% |
| Raamsdonksveer | 13 | $5,656 | $570.33 | 43% |
| Morienval | 12 | $4,931 | $374.68 | 30% |
| Dion | 12 | $4,682 | $277.19 | 57% |
| Incourt | 11 | $4,232 | $338.50 | 42% |
| Zerkegem | 10 | $4,206 | $429.87 | 51% |
| Rosoy-en-Multien | 14 | $4,067 | $358.69 | 56% |
| Beernem | 20 | $4,036 | $315.56 | 44% |
| Jemeppe-sur-Sambre | 10 | $3,970 | $489.35 | 45% |