Rety Airbnb Market Analysis 2025: Short Term Rental Data & Vacation Rental Statistics in Hauts-de-France, France
Is Airbnb profitable in Rety in 2025? Explore comprehensive Airbnb analytics for Rety, Hauts-de-France, France to uncover income potential. This 2025 STR market report for Rety, based on AirROI data from July 2024 to June 2025, reveals key trends in the niche market of 18 active listings.
Whether you're considering an Airbnb investment in Rety, optimizing your existing vacation rental, or exploring rental arbitrage opportunities, understanding the Rety Airbnb data is crucial. Leveraging the low regulation environment is key to maximizing your short term rental income potential. Let's dive into the specifics.
Key Rety Airbnb Performance Metrics Overview
Monthly Airbnb Revenue Variations & Income Potential in Rety (2025)
Understanding the monthly revenue variations for Airbnb listings in Rety is key to maximizing your short term rental income potential. Seasonality significantly impacts earnings. Our analysis, based on data from the past 12 months, shows that the peak revenue month for STRs in Rety is typically August, while January often presents the lowest earnings, highlighting opportunities for strategic pricing adjustments during shoulder and low seasons. Explore the typical Airbnb income in Rety across different performance tiers:
- Best-in-class properties (Top 10%) achieve $4,926+ monthly, often utilizing dynamic pricing and superior guest experiences.
- Strong performing properties (Top 25%) earn $2,988 or more, indicating effective management and desirable locations/amenities.
- Typical properties (Median) generate around $1,627 per month, representing the average market performance.
- Entry-level properties (Bottom 25%) see earnings around $947, often with potential for optimization.
Average Monthly Airbnb Earnings Trend in Rety
Rety Airbnb Occupancy Rate Trends (2025)
Maximize your bookings by understanding the Rety STR occupancy trends. Seasonal demand shifts significantly influence how often properties are booked. Typically, Augustsees the highest demand (peak season occupancy), while January experiences the lowest (low season). Effective strategies, like adjusting minimum stays or offering promotions, can boost occupancy during slower periods. Here's how different property tiers perform in Rety:
- Best-in-class properties (Top 10%) achieve 60%+ occupancy, indicating high desirability and potentially optimized availability.
- Strong performing properties (Top 25%) maintain 54% or higher occupancy, suggesting good market fit and guest satisfaction.
- Typical properties (Median) have an occupancy rate around 32%.
- Entry-level properties (Bottom 25%) average 23% occupancy, potentially facing higher vacancy.
Average Monthly Occupancy Rate Trend in Rety
Average Daily Rate (ADR) Airbnb Trends in Rety (2025)
Effective short term rental pricing strategy in Rety involves understanding monthly ADR fluctuations. The Average Daily Rate (ADR) for Airbnb in Rety typically peaks in June and dips lowest during January. Leveraging Airbnb dynamic pricing tools or strategies based on this seasonality can significantly boost revenue. Here's a look at the typical nightly rates achieved:
- Best-in-class properties (Top 10%) command rates of $374+ per night, often due to premium features or locations.
- Strong performing properties (Top 25%) achieve nightly rates of $196 or more.
- Typical properties (Median) charge around $136 per night.
- Entry-level properties (Bottom 25%) earn around $99 per night.
Average Daily Rate (ADR) Trend by Month in Rety
Get Live Rety Market Intelligence 👇
Explore Real-time Analytics
Airbnb Seasonality Analysis & Trends in Rety (2025)
Peak Season (August, July, May)
- Revenue averages $3,958 per month
- Occupancy rates average 58.4%
- Daily rates average $191
Shoulder Season
- Revenue averages $2,564 per month
- Occupancy maintains around 36.6%
- Daily rates hold near $190
Low Season (January, February, March)
- Revenue drops to average $1,228 per month
- Occupancy decreases to average 19.0%
- Daily rates adjust to average $193
Seasonality Insights for Rety
- The Airbnb seasonality in Rety shows highly seasonal trends requiring careful strategy. While the sections above show seasonal averages, it's also insightful to look at the extremes:
- During the high season, the absolute peak month showcases Rety's highest earning potential, with monthly revenues capable of climbing to $4,411, occupancy reaching a high of 69.5%, and ADRs peaking at $221.
- Conversely, the slowest single month of the year, typically falling within the low season, marks the market's lowest point. In this month, revenue might dip to $838, occupancy could drop to 10.6%, and ADRs may adjust down to $175.
- Understanding both the seasonal averages and these monthly peaks and troughs in revenue, occupancy, and ADR is crucial for maximizing your Airbnb profit potential in Rety.
Seasonal Strategies for Maximizing Profit
- Peak Season: Maximize revenue through premium pricing and potentially longer minimum stays. Ensure high availability.
- Low Season: Offer competitive pricing, special promotions (e.g., extended stay discounts), and flexible cancellation policies. Target off-season travelers like remote workers or budget-conscious guests.
- Shoulder Seasons: Implement dynamic pricing that balances peak and low rates. Target weekend travelers or specific events. Offer slightly more flexible terms than peak season.
- Regularly analyze your own performance against these Rety seasonality benchmarks and adjust your pricing and availability strategy accordingly.
Best Areas for Airbnb Investment in Rety (2025)
Exploring the top neighborhoods for short-term rentals in Rety? This section highlights key areas, outlining why they are attractive for hosts and guests, along with notable local attractions. Consider these locations based on your target guest profile and investment strategy.
| Neighborhood / Area | Why Host Here? (Target Guests & Appeal) | Key Attractions & Landmarks |
|---|---|---|
| Lille | As the capital of Hauts-de-France, Lille is a vibrant city with rich history, culture and architecture. It's a popular destination for tourists and business travelers alike, boasting a thriving art scene and numerous events throughout the year. | Vieux Lille, Palais des Beaux-Arts, La Vieille Bourse, Lille Zoo, Grand Place |
| Amiens | Known for its stunning cathedral and picturesque canals, Amiens is a charming city that attracts visitors for its historical significance and cultural events. It's great for hosting tourists looking for a mixture of history and beauty. | Amiens Cathedral, Les Hortillonnages, Saint-Leu district, Zénith d'Amiens, Musee de Picardie |
| Arras | Famous for its magnificent squares and history during World War I, Arras attracts history buffs and culture enthusiasts. The town center is a UNESCO World Heritage Site, making it a great spot for short-term rentals. | Place des Héros, Arras Citadel, Carrière Wellington, High Street, Belfry of Arras |
| Beauvais | A charming city often overlooked, Beauvais offers stunning architecture and is close to Paris, making it appealing to those who want a quieter stay with easy access to the capital. It's excellent for travelers seeking a more local experience. | Beauvais Cathedral, Château de Beauvais, Parc Marcel Dassault, The Mudo Museum |
| Saint-Quentin | Known for its beautiful architecture and rich history, Saint-Quentin is a quiet city that attracts those looking to explore the Picardy region. The town offers a peaceful environment for tourists. | Saint-Quentin Basilica, Vauban Park, Royal Square, Museum of the Second Picardy, La Garranelle |
| Douai | A historical city with a rich industrial past, Douai has interesting sights and is a great location for tourists interested in the region's history and culture, providing a cozy place for short stays. | Douai Historical Museum, Belfry of Douai, Place d'Esquerchin, Church of Saint Jacques |
| Lens | Home to the Louvre-Lens Museum, Lens is favored by art lovers and those interested in mining history. It's a unique city that draws visitors interested in both culture and history. | Louvre-Lens Museum, Mining History Centre, Stade Bollaert-Delelis, Canadian National Vimy Memorial |
| Saw | A lesser-known village, Saw can appeal to tourists searching for rural getaways and nature experiences. Its countryside setting offers a different perspective of Hauts-de-France. | Local hiking trails, Charming countryside views, Cultural heritage sites, Close proximity to greater urban areas |
Understanding Airbnb License Requirements & STR Laws in Rety (2025)
While Rety, Hauts-de-France, France currently shows low STR regulations, specific Airbnb license requirements might still exist or change. Always verify the latest short term rental regulations and Airbnb license requirements directly with local government authorities for Rety to ensure full compliance before hosting.
(Source: AirROI data, 2025, finding no licensed listings among those analyzed)
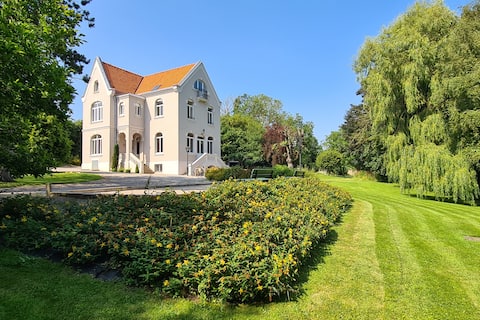
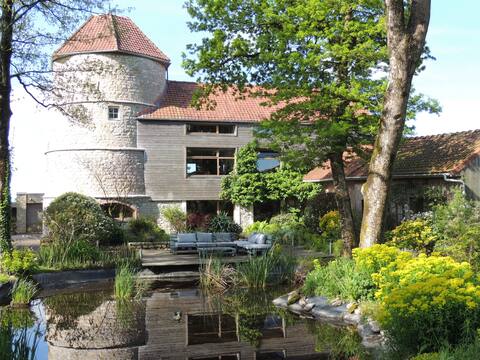
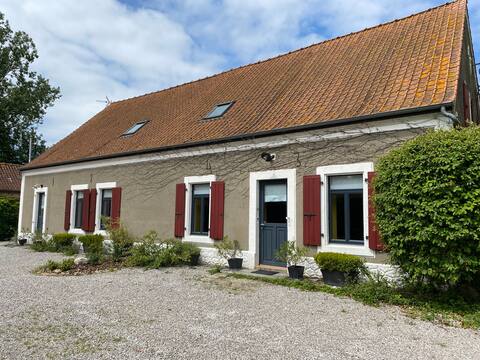
Top Performing Airbnb Properties in Rety (2025)
Benchmark your potential! Explore examples of top-performing Airbnb properties in Retybased on Trailing Twelve Month (TTM) revenue. Analyze their characteristics, revenue, occupancy rate, and ADR to understand what drives success in this market.
PROMO Domaine de La Gontherie Côte d'Opale Gîte
Entire Place • 7 bedrooms
Windmill on the Opal Coast: Atypical Charm
Entire Place • 4 bedrooms

Gîte de la Providence with Spa 8 to 10 people
Entire Place • 3 bedrooms

Ferme de la Chapelle Bis, between land and sea
Entire Place • 3 bedrooms
Ferme de la Chapelle & Bis Double Gîte
Entire Place • 5 bedrooms
Peaceful retro-style cottage
Entire Place • 2 bedrooms
Note: Performance varies based on location, size, amenities, seasonality, and management quality. Data reflects the past 12 months.
Top Performing Airbnb Hosts in Rety (2025)
Learn from the best! This table showcases top-performing Airbnb hosts in Rety based on the number of properties managed and estimated total revenue over the past year. Analyze their scale and performance metrics.
| Host Name | Properties | Grossing Revenue | Stay Reviews | Avg Rating |
|---|---|---|---|---|
| Céline | 1 | $121,530 | 121 | 4.88/5.0 |
| Anne | 3 | $69,736 | 103 | 4.95/5.0 |
| Jean | 1 | $53,049 | 29 | 4.93/5.0 |
| Hélène | 2 | $49,739 | 72 | 4.80/5.0 |
| Anne | 1 | $20,481 | 15 | 5.00/5.0 |
| Eugene | 4 | $19,626 | 57 | 4.52/5.0 |
| Patrick Et Sabine | 1 | $17,078 | 184 | 4.86/5.0 |
| Brigitte | 1 | $13,976 | 50 | 4.92/5.0 |
| Hélène | 1 | $7,184 | 33 | 4.91/5.0 |
| Marie Pierre | 1 | $5,504 | 122 | 4.93/5.0 |
Analyzing the strategies of top hosts, such as their property selection, pricing, and guest communication, can offer valuable lessons for optimizing your own Airbnb operations in Rety.
Dive Deeper: Advanced Rety STR Market Data (2025)
Ready to unlock more insights? AirROI provides access to advanced metrics and comprehensive Airbnb data for Rety. Explore detailed analytics beyond this report to refine your investment strategy, optimize pricing, and maximize your vacation rental profits.
Explore Advanced MetricsRety Short-Term Rental Market Composition (2025): Property & Room Types
Room Type Distribution
Property Type Distribution
Market Composition Insights for Rety
- The Rety Airbnb market composition is heavily skewed towards Entire Home/Apt listings, which make up 77.8% of the 18 active rentals. This indicates strong guest preference for privacy and space.
- Looking at the property type distribution in Rety, House properties are the most common (100%), reflecting the local real estate landscape.
- Houses represent a significant 100% portion, catering likely to families or larger groups.
Rety Airbnb Room Capacity Analysis (2025): Bedroom Distribution
Distribution of Listings by Number of Bedrooms
Room Capacity Insights for Rety
- The dominant room capacity in Rety is 3 bedrooms listings, making up 50% of the market. This suggests a strong demand for properties suitable for families or small groups.
- Together, 3 bedrooms and 2 bedrooms properties represent 66.7% of the active Airbnb listings in Rety, indicating a high concentration in these sizes.
- A significant 72.2% of listings offer 3+ bedrooms, catering to larger groups and families seeking more space in Rety.
Rety Vacation Rental Guest Capacity Trends (2025)
Distribution of Listings by Guest Capacity
Guest Capacity Insights for Rety
- The most common guest capacity trend in Rety vacation rentals is listings accommodating 8+ guests (33.3%). This suggests the primary traveler segment is likely larger groups.
- Properties designed for 8+ guests and 6 guests dominate the Rety STR market, accounting for 55.5% of listings.
- 61.1% of properties accommodate 6+ guests, serving the market segment for larger families or group travel in Rety.
- On average, properties in Rety are equipped to host 5.1 guests.
Rety Airbnb Booking Patterns (2025): Available vs. Booked Days
Available Days Distribution
Booked Days Distribution
Booking Pattern Insights for Rety
- The most common availability pattern in Rety falls within the 181-270 days range, representing 55.6% of listings. This suggests many properties have significant open periods on their calendars.
- Approximately 100.0% of listings show high availability (181+ days open annually), indicating potential for increased bookings or specific owner usage patterns.
- For booked days, the 91-180 days range is most frequent in Rety (44.4%), reflecting common guest stay durations or potential owner blocking patterns.
- A notable 11.1% of properties secure long booking periods (181+ days booked per year), highlighting successful long-term rental strategies or significant owner usage.
Rety Airbnb Minimum Stay Requirements Analysis
Distribution of Listings by Minimum Night Requirement
1 Night
2 listings
11.8% of total
2 Nights
7 listings
41.2% of total
3 Nights
2 listings
11.8% of total
4-6 Nights
1 listings
5.9% of total
7-29 Nights
1 listings
5.9% of total
30+ Nights
4 listings
23.5% of total
Key Insights
- The most prevalent minimum stay requirement in Rety is 2 Nights, adopted by 41.2% of listings. This highlights the market's preference for shorter, flexible bookings.
- A significant segment (23.5%) caters to monthly stays (30+ nights) in Rety, pointing to opportunities in the extended-stay market.
Recommendations
- Align with the market by considering a 2 Nights minimum stay, as 41.2% of Rety hosts use this setting.
- If feasible, allowing 1-night stays, especially midweek or during low season, could capture last-minute bookings, as only 11.8% currently do.
- A 2-night minimum appears standard (41.2%). Consider this for weekends or peak periods.
- Explore offering discounts for stays of 30+ nights to attract the 23.5% of the market seeking extended stays.
- Adjust minimum nights based on seasonality – potentially shorter during low season and longer during peak demand periods in Rety.
Rety Airbnb Cancellation Policy Trends Analysis (2025)
Flexible
3 listings
16.7% of total
Moderate
1 listings
5.6% of total
Firm
6 listings
33.3% of total
Strict
8 listings
44.4% of total
Cancellation Policy Insights for Rety
- The prevailing Airbnb cancellation policy trend in Rety is Strict, used by 44.4% of listings.
- A majority (77.7%) of hosts in Rety utilize Firm or Strict policies, indicating a market where hosts prioritize booking security.
Recommendations for Hosts
- Consider adopting a Strict policy to align with the 44.4% market standard in Rety.
- With 44.4% using Strict terms, this is a viable option in Rety, particularly for high-value properties or during peak demand periods.
- Regularly review your cancellation policy against competitors and market demand shifts in Rety.
Rety STR Booking Lead Time Analysis (2025)
Average Booking Lead Time by Month
Booking Lead Time Insights for Rety
- The overall average booking lead time for vacation rentals in Rety is 59 days.
- Guests book furthest in advance for stays during June (average 95 days), likely coinciding with peak travel demand or local events.
- The shortest booking windows occur for stays in February (average 11 days), indicating more last-minute travel plans during this time.
- Seasonally, Spring (77 days avg.) sees the longest lead times, while Fall (51 days avg.) has the shortest, reflecting typical travel planning cycles.
Recommendations for Hosts
- Use the overall average lead time (59 days) as a baseline for your pricing and availability strategy in Rety.
- For June stays, consider implementing length-of-stay discounts or slightly higher rates for bookings made less than 95 days out to capitalize on advance planning.
- During February, focus on last-minute booking availability and promotions, as guests book with very short notice (11 days avg.).
- Target marketing efforts for the Spring season well in advance (at least 77 days) to capture early planners.
- Monitor your own booking lead times against these Rety averages to identify opportunities for dynamic pricing adjustments.
Popular & Essential Airbnb Amenities in Rety (2025)
Amenity data is currently unavailable for Rety.
Rety Airbnb Guest Demographics & Profile Analysis (2025)
Guest Profile Summary for Rety
- The typical guest profile for Airbnb in Rety consists of a mix of domestic (46%) and international guests, with top international origins including Belgium, typically belonging to the Post-2000s (Gen Z/Alpha) group (50%), primarily speaking English or French.
- Domestic travelers account for 45.5% of guests.
- Key international markets include France (45.5%) and Belgium (27.3%).
- Top languages spoken are English (35.7%) followed by French (34.7%).
- A significant demographic segment is the Post-2000s (Gen Z/Alpha) group, representing 50% of guests.
Recommendations for Hosts
- Balance marketing efforts between domestic and international channels based on the guest mix.
- Tailor amenities and listing descriptions to appeal to the dominant Post-2000s (Gen Z/Alpha) demographic (e.g., highlight fast WiFi, smart home features, local guides).
- Highlight unique local experiences or amenities relevant to the primary guest profile.
- Consider seasonal promotions aligned with peak travel times for key origin markets.
Nearby Short-Term Rental Market Comparison
How does the Rety Airbnb market stack up against its neighbors? Compare key performance metrics like average monthly revenue, ADR, and occupancy rates in surrounding areas to understand the broader regional STR landscape.
| Market | Active Properties | Monthly Revenue | Daily Rate | Avg. Occupancy |
|---|---|---|---|---|
| Lo-Reninge | 13 | $5,882 | $436.63 | 46% |
| Morienval | 12 | $4,931 | $374.68 | 30% |
| La Poterie-Cap-d'Antifer | 13 | $4,242 | $273.50 | 47% |
| Rosoy-en-Multien | 14 | $4,067 | $358.69 | 56% |
| Caumont | 11 | $3,530 | $303.08 | 48% |
| Saint-Étienne-la-Thillaye | 24 | $3,229 | $364.55 | 36% |
| Muids | 14 | $3,160 | $378.20 | 38% |
| Surville | 10 | $3,155 | $290.28 | 42% |
| Aix-en-Issart | 10 | $2,992 | $274.74 | 39% |
| Sevenoaks | 178 | $2,864 | $269.14 | 44% |