Charenton-le-Pont Airbnb Market Analysis 2026: Short Term Rental Data & Vacation Rental Statistics in Ile-de-France, France
Is Airbnb profitable in Charenton-le-Pont in 2026? Explore comprehensive Airbnb analytics for Charenton-le-Pont, Ile-de-France, France to uncover income potential. This 2026 STR market report for Charenton-le-Pont, based on AirROI data from February 2025 to January 2026, reveals key trends in the niche market of 134 active listings.
Whether you're considering an Airbnb investment in Charenton-le-Pont, optimizing your existing vacation rental, or exploring rental arbitrage opportunities, understanding the Charenton-le-Pont Airbnb data is crucial. Navigating the high regulation landscape is key to maximizing your short term rental income potential. Let's dive into the specifics.
Key Charenton-le-Pont Airbnb Performance Metrics Overview
Monthly Airbnb Revenue Variations & Income Potential in Charenton-le-Pont (2026)
Understanding the monthly revenue variations for Airbnb listings in Charenton-le-Pont is key to maximizing your short term rental income potential. Seasonality significantly impacts earnings. Our analysis, based on data from the past 12 months, shows that the peak revenue month for STRs in Charenton-le-Pont is typically October, while January often presents the lowest earnings, highlighting opportunities for strategic pricing adjustments during shoulder and low seasons. Explore the typical Airbnb income in Charenton-le-Pont across different performance tiers:
- Best-in-class properties (Top 10%) achieve $3,666+ monthly, often utilizing dynamic pricing and superior guest experiences.
- Strong performing properties (Top 25%) earn $2,690 or more, indicating effective management and desirable locations/amenities.
- Typical properties (Median) generate around $1,829 per month, representing the average market performance.
- Entry-level properties (Bottom 25%) see earnings around $1,059, often with potential for optimization.
Average Monthly Airbnb Earnings Trend in Charenton-le-Pont
Charenton-le-Pont Airbnb Occupancy Rate Trends (2026)
Maximize your bookings by understanding the Charenton-le-Pont STR occupancy trends. Seasonal demand shifts significantly influence how often properties are booked. Typically, Octobersees the highest demand (peak season occupancy), while January experiences the lowest (low season). Effective strategies, like adjusting minimum stays or offering promotions, can boost occupancy during slower periods. Here's how different property tiers perform in Charenton-le-Pont:
- Best-in-class properties (Top 10%) achieve 88%+ occupancy, indicating high desirability and potentially optimized availability.
- Strong performing properties (Top 25%) maintain 76% or higher occupancy, suggesting good market fit and guest satisfaction.
- Typical properties (Median) have an occupancy rate around 56%.
- Entry-level properties (Bottom 25%) average 32% occupancy, potentially facing higher vacancy.
Average Monthly Occupancy Rate Trend in Charenton-le-Pont
Average Daily Rate (ADR) Airbnb Trends in Charenton-le-Pont (2026)
Effective short term rental pricing strategy in Charenton-le-Pont involves understanding monthly ADR fluctuations. The Average Daily Rate (ADR) for Airbnb in Charenton-le-Pont typically peaks in December and dips lowest during February. Leveraging Airbnb dynamic pricing tools or strategies based on this seasonality can significantly boost revenue. Here's a look at the typical nightly rates achieved:
- Best-in-class properties (Top 10%) command rates of $233+ per night, often due to premium features or locations.
- Strong performing properties (Top 25%) achieve nightly rates of $156 or more.
- Typical properties (Median) charge around $112 per night.
- Entry-level properties (Bottom 25%) earn around $87 per night.
Average Daily Rate (ADR) Trend by Month in Charenton-le-Pont
Get Live Charenton-le-Pont Market Intelligence 👇

Explore Real-time Analytics
Airbnb Seasonality Analysis & Trends in Charenton-le-Pont (2026)
Peak Season (October, September, June)
- Revenue averages $2,621 per month
- Occupancy rates average 64.2%
- Daily rates average $144
Shoulder Season
- Revenue averages $2,004 per month
- Occupancy maintains around 54.1%
- Daily rates hold near $138
Low Season (January, February, August)
- Revenue drops to average $1,582 per month
- Occupancy decreases to average 42.7%
- Daily rates adjust to average $137
Seasonality Insights for Charenton-le-Pont
- The Airbnb seasonality in Charenton-le-Pont shows moderate seasonality with distinct peak and low periods. While the sections above show seasonal averages, it's also insightful to look at the extremes:
- During the high season, the absolute peak month showcases Charenton-le-Pont's highest earning potential, with monthly revenues capable of climbing to $2,786, occupancy reaching a high of 67.2%, and ADRs peaking at $147.
- Conversely, the slowest single month of the year, typically falling within the low season, marks the market's lowest point. In this month, revenue might dip to $1,397, occupancy could drop to 35.6%, and ADRs may adjust down to $130.
- Understanding both the seasonal averages and these monthly peaks and troughs in revenue, occupancy, and ADR is crucial for maximizing your Airbnb profit potential in Charenton-le-Pont.
Seasonal Strategies for Maximizing Profit
- Peak Season: Maximize revenue through premium pricing and potentially longer minimum stays. Ensure high availability.
- Low Season: Offer competitive pricing, special promotions (e.g., extended stay discounts), and flexible cancellation policies. Target off-season travelers like remote workers or budget-conscious guests.
- Shoulder Seasons: Implement dynamic pricing that balances peak and low rates. Target weekend travelers or specific events. Offer slightly more flexible terms than peak season.
- Regularly analyze your own performance against these Charenton-le-Pont seasonality benchmarks and adjust your pricing and availability strategy accordingly.
Best Areas for Airbnb Investment in Charenton-le-Pont (2026)
Exploring the top neighborhoods for short-term rentals in Charenton-le-Pont? This section highlights key areas, outlining why they are attractive for hosts and guests, along with notable local attractions. Consider these locations based on your target guest profile and investment strategy.
| Neighborhood / Area | Why Host Here? (Target Guests & Appeal) | Key Attractions & Landmarks |
|---|---|---|
| Centre-Ville | The heart of Charenton-le-Pont with access to shops, restaurants, and local culture. It's ideal for tourists wanting a genuine local experience while being close to Paris. | Parc de Bercy, Église Saint-Louis, Marché de Charenton, Les Ponts de Charenton, Bois de Vincennes |
| Vincennes Park Area | Located near the Château de Vincennes and the expansive Bois de Vincennes, this area is perfect for nature lovers and families. Great for leisure and outdoor activities. | Château de Vincennes, Bois de Vincennes, Parc Zoologique de Paris, Les Jardins de Bercy, Bercy Village |
| Metro Line 8 Access | Close proximity to Metro Line 8 makes it easy to reach central Paris. It attracts business travelers and tourists who want quick access to the city. | Metro stations, Shopping centers, Cafés, Restaurants, Theatre de Bercy |
| La Marne Riverfront | Charming waterfront area ideal for those who enjoy scenic views and outdoor activities. Popular with couples and families. | La Marne River, L'Île de Charenton, La Promenade des Bords de Marne, Restaurants by the river, Boat rides |
| Cultural Sites | Home to several cultural landmarks and museums, great for art lovers and history enthusiasts. | Musée de l'Histoire de France, La Maison des Arts de Créteil, Theatre de Charenton, Historic buildings, Local art galleries |
| Shopping District | Vibrant area with a variety of shops and markets that appeal to locals and tourists alike looking for unique finds and local delicacies. | Local markets, Shops, Restaurants, Cafés, Boutiques |
| Residential Neighborhoods | Quieter, family-friendly neighborhoods that provide a local feel while still being accessible to city attractions. | Local parks, Playgrounds, Community centers, Family-friendly venues, Local history tours |
| Sports and Leisure | Area known for sports facilities and leisure activities, attracting visitors interested in active pursuits. | Stadiums, Gyms, Leisure centers, Running paths, Cycling routes |
Understanding Airbnb License Requirements & STR Laws in Charenton-le-Pont (2026)
Yes, Charenton-le-Pont, Ile-de-France, France enforces high STR regulations. Obtaining a license and ensuring compliance is almost certainly required according to current 2026 STR laws. Always verify the latest short term rental regulations and Airbnb license requirements directly with local government authorities for Charenton-le-Pont to ensure full compliance before hosting.
(Source: AirROI data, 2026, based on 81% licensed listings)
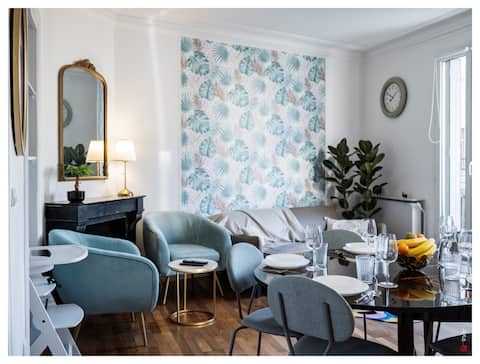
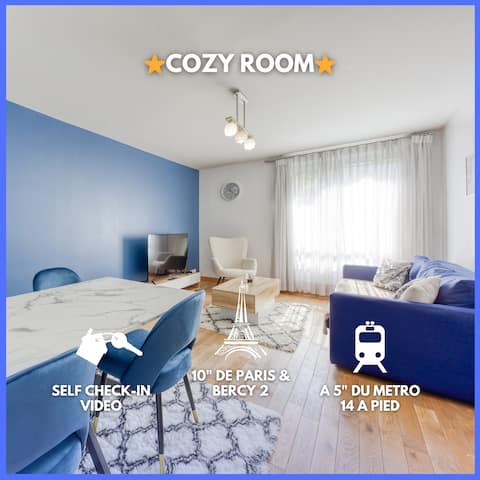
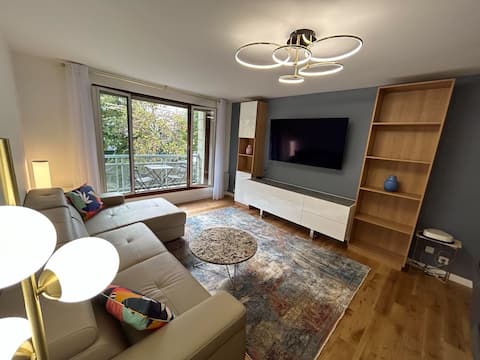
Top Performing Airbnb Properties in Charenton-le-Pont (2026)
Benchmark your potential! Explore examples of top-performing Airbnb properties in Charenton-le-Pontbased on Trailing Twelve Month (TTM) revenue. Analyze their characteristics, revenue, occupancy rate, and ADR to understand what drives success in this market.
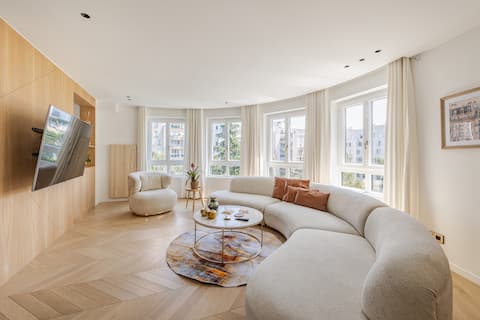
Luxury & spacious near Accor Arena & Bastille
Entire Place • 5 bedrooms
4P Terrace - 16 min Paris/Bois de Vincennes 700 m
Entire Place • 3 bedrooms
Appartement Proche Paris & Bercy 2 - Cozy Houses
Entire Place • 2 bedrooms
Splendid 92m2 Renovated, 4 Rooms
Entire Place • 3 bedrooms

Spacious, family-friendly, bright apartment with a view of Paris
Entire Place • 3 bedrooms

Comfortable apartment, Notre Dame 30 minutes away
Entire Place • 2 bedrooms
Note: Performance varies based on location, size, amenities, seasonality, and management quality. Data reflects the past 12 months.
Top Performing Airbnb Hosts in Charenton-le-Pont (2026)
Learn from the best! This table showcases top-performing Airbnb hosts in Charenton-le-Pont based on the number of properties managed and estimated total revenue over the past year. Analyze their scale and performance metrics.
| Host Name | Properties | Grossing Revenue | Stay Reviews | Avg Rating |
|---|---|---|---|---|
| DoubleCheck | 17 | $234,817 | 375 | 4.29/5.0 |
| Dario | 2 | $159,490 | 106 | 4.68/5.0 |
| Eric | 2 | $62,206 | 196 | 4.75/5.0 |
| Weekly | 1 | $58,378 | 106 | 4.85/5.0 |
| Cozy Houses | 1 | $50,653 | 68 | 4.79/5.0 |
| Maria | 1 | $49,924 | 33 | 4.97/5.0 |
| Sandie-Come À La Maison | 1 | $48,017 | 15 | 4.80/5.0 |
| Alain | 1 | $44,660 | 85 | 4.95/5.0 |
| Gerard | 2 | $44,345 | 680 | 4.77/5.0 |
| Victoria | 1 | $43,785 | 10 | 4.90/5.0 |
Analyzing the strategies of top hosts, such as their property selection, pricing, and guest communication, can offer valuable lessons for optimizing your own Airbnb operations in Charenton-le-Pont.
Dive Deeper: Advanced Charenton-le-Pont STR Market Data (2026)
Ready to unlock more insights? AirROI provides access to advanced metrics and comprehensive Airbnb data for Charenton-le-Pont. Explore detailed analytics beyond this report to refine your investment strategy, optimize pricing, and maximize your vacation rental profits.
Explore Advanced MetricsCharenton-le-Pont Short-Term Rental Market Composition (2026): Property & Room Types
Room Type Distribution
Property Type Distribution
Market Composition Insights for Charenton-le-Pont
- The Charenton-le-Pont Airbnb market composition is heavily skewed towards Entire Home/Apt listings, which make up 88.8% of the 134 active rentals. This indicates strong guest preference for privacy and space.
- Looking at the property type distribution in Charenton-le-Pont, Apartment/Condo properties are the most common (95.5%), reflecting the local real estate landscape.
- Smaller segments like house, others (combined 4.5%) offer potential for unique stay experiences.
Charenton-le-Pont Airbnb Room Capacity Analysis (2026): Bedroom Distribution
Distribution of Listings by Number of Bedrooms
Room Capacity Insights for Charenton-le-Pont
- The dominant room capacity in Charenton-le-Pont is 1 bedroom listings, making up 56% of the market. This suggests a strong demand for properties suitable for couples or solo travelers.
- Together, 1 bedroom and 2 bedrooms properties represent 76.1% of the active Airbnb listings in Charenton-le-Pont, indicating a high concentration in these sizes.
- With over half the market (56%) consisting of studios or 1-bedroom units, Charenton-le-Pont is particularly well-suited for individuals or couples.
- Listings with 3+ bedrooms (8.2%) represent a smaller niche, potentially indicating an underserved market for larger group accommodations in Charenton-le-Pont.
Charenton-le-Pont Vacation Rental Guest Capacity Trends (2026)
Distribution of Listings by Guest Capacity
Guest Capacity Insights for Charenton-le-Pont
- The most common guest capacity trend in Charenton-le-Pont vacation rentals is listings accommodating 2 guests (36.6%). This suggests the primary traveler segment is likely couples or solo travelers.
- Properties designed for 2 guests and 4 guests dominate the Charenton-le-Pont STR market, accounting for 67.2% of listings.
- 13.4% of properties accommodate 6+ guests, serving the market segment for larger families or group travel in Charenton-le-Pont.
- On average, properties in Charenton-le-Pont are equipped to host 3.2 guests.
Charenton-le-Pont Airbnb Booking Patterns (2026): Available vs. Booked Days
Available Days Distribution
Booked Days Distribution
Booking Pattern Insights for Charenton-le-Pont
- The most common availability pattern in Charenton-le-Pont falls within the 271-366 days range, representing 37.3% of listings. This suggests many properties have significant open periods on their calendars.
- Approximately 65.7% of listings show high availability (181+ days open annually), indicating potential for increased bookings or specific owner usage patterns.
- For booked days, the 91-180 days range is most frequent in Charenton-le-Pont (29.1%), reflecting common guest stay durations or potential owner blocking patterns.
- A notable 35.8% of properties secure long booking periods (181+ days booked per year), highlighting successful long-term rental strategies or significant owner usage.
Charenton-le-Pont Airbnb Minimum Stay Requirements Analysis
Distribution of Listings by Minimum Night Requirement
1 Night
17 listings
12.7% of total
2 Nights
36 listings
26.9% of total
3 Nights
13 listings
9.7% of total
4-6 Nights
14 listings
10.4% of total
7-29 Nights
5 listings
3.7% of total
30+ Nights
49 listings
36.6% of total
Key Insights
- The most prevalent minimum stay requirement in Charenton-le-Pont is 30+ Nights, adopted by 36.6% of listings. This highlights the market's preference for longer commitments.
- A significant segment (36.6%) caters to monthly stays (30+ nights) in Charenton-le-Pont, pointing to opportunities in the extended-stay market.
Recommendations
- Align with the market by considering a 30+ Nights minimum stay, as 36.6% of Charenton-le-Pont hosts use this setting.
- If feasible, allowing 1-night stays, especially midweek or during low season, could capture last-minute bookings, as only 12.7% currently do.
- Explore offering discounts for stays of 30+ nights to attract the 36.6% of the market seeking extended stays.
- Adjust minimum nights based on seasonality – potentially shorter during low season and longer during peak demand periods in Charenton-le-Pont.
Charenton-le-Pont Airbnb Cancellation Policy Trends Analysis (2026)
Flexible
25 listings
18.7% of total
Moderate
58 listings
43.3% of total
Firm
40 listings
29.9% of total
Strict
11 listings
8.2% of total
Cancellation Policy Insights for Charenton-le-Pont
- The prevailing Airbnb cancellation policy trend in Charenton-le-Pont is Moderate, used by 43.3% of listings.
- There's a relatively balanced mix between guest-friendly (62.0%) and stricter (38.1%) policies, offering choices for different guest needs.
- Strict cancellation policies are quite rare (8.2%), potentially making listings with this policy less competitive unless justified by high demand or property type.
Recommendations for Hosts
- Consider adopting a Moderate policy to align with the 43.3% market standard in Charenton-le-Pont.
- Using a Strict policy might deter some guests, as only 8.2% of listings use it. Evaluate if potential revenue protection outweighs possible lower booking rates.
- Regularly review your cancellation policy against competitors and market demand shifts in Charenton-le-Pont.
Charenton-le-Pont STR Booking Lead Time Analysis (2026)
Average Booking Lead Time by Month
Booking Lead Time Insights for Charenton-le-Pont
- The overall average booking lead time for vacation rentals in Charenton-le-Pont is 43 days.
- Guests book furthest in advance for stays during August (average 55 days), likely coinciding with peak travel demand or local events.
- The shortest booking windows occur for stays in January (average 32 days), indicating more last-minute travel plans during this time.
- Seasonally, Summer (52 days avg.) sees the longest lead times, while Winter (38 days avg.) has the shortest, reflecting typical travel planning cycles.
Recommendations for Hosts
- Use the overall average lead time (43 days) as a baseline for your pricing and availability strategy in Charenton-le-Pont.
- For August stays, consider implementing length-of-stay discounts or slightly higher rates for bookings made less than 55 days out to capitalize on advance planning.
- Target marketing efforts for the Summer season well in advance (at least 52 days) to capture early planners.
- Monitor your own booking lead times against these Charenton-le-Pont averages to identify opportunities for dynamic pricing adjustments.
Popular & Essential Airbnb Amenities in Charenton-le-Pont (2026)
Amenity Prevalence
Amenity Insights for Charenton-le-Pont
- Essential amenities in Charenton-le-Pont that guests expect include: Kitchen. Lacking these (this) could significantly impact bookings.
- Popular amenities like Wifi, Heating, Bed linens are common but not universal. Offering these can provide a competitive edge.
- Warning: Wifi is not universally provided but is considered essential globally. Ensure reliable Wifi is offered.
Recommendations for Hosts
- Ensure your listing includes all essential amenities for Charenton-le-Pont: Kitchen.
- Prioritize adding missing essentials: Kitchen.
- Consider adding popular differentiators like Wifi or Heating to increase appeal.
- Highlight unique or less common amenities you offer (e.g., hot tub, dedicated workspace, EV charger) in your listing description and photos.
- Regularly check competitor amenities in Charenton-le-Pont to stay competitive.
Charenton-le-Pont Airbnb Guest Demographics & Profile Analysis (2026)
Guest Profile Summary for Charenton-le-Pont
- The typical guest profile for Airbnb in Charenton-le-Pont consists of a mix of domestic (43%) and international guests, with top international origins including United States, typically belonging to the Post-2000s (Gen Z/Alpha) group (50%), primarily speaking English or French.
- Domestic travelers account for 43.4% of guests.
- Key international markets include France (43.4%) and United States (6.3%).
- Top languages spoken are English (38.9%) followed by French (26.1%).
- A significant demographic segment is the Post-2000s (Gen Z/Alpha) group, representing 50% of guests.
Recommendations for Hosts
- Balance marketing efforts between domestic and international channels based on the guest mix.
- Tailor amenities and listing descriptions to appeal to the dominant Post-2000s (Gen Z/Alpha) demographic (e.g., highlight fast WiFi, smart home features, local guides).
- Highlight unique local experiences or amenities relevant to the primary guest profile.
- Consider seasonal promotions aligned with peak travel times for key origin markets.
Nearby Short-Term Rental Market Comparison
How does the Charenton-le-Pont Airbnb market stack up against its neighbors? Compare key performance metrics like average monthly revenue, ADR, and occupancy rates in surrounding areas to understand the broader regional STR landscape.
| Market | Active Properties | Monthly Revenue | Daily Rate | Avg. Occupancy |
|---|---|---|---|---|
| Égreville | 12 | $4,969 | $447.83 | 40% |
| Dizy | 11 | $4,106 | $250.48 | 49% |
| La Couture-Boussey | 11 | $4,086 | $464.04 | 28% |
| Menetou-Râtel | 10 | $3,844 | $353.11 | 34% |
| Rosoy-en-Multien | 15 | $3,680 | $347.93 | 47% |
| Morienval | 12 | $3,308 | $372.82 | 30% |
| Achères-la-Forêt | 35 | $3,136 | $348.74 | 44% |
| Mesnils-sur-Iton | 24 | $3,099 | $348.65 | 41% |
| Paris | 39,295 | $3,085 | $257.47 | 52% |
| Maslives | 17 | $2,994 | $317.61 | 39% |