Bonneville-sur-Touques Airbnb Market Analysis 2026: Short Term Rental Data & Vacation Rental Statistics in Normandy, France
Is Airbnb profitable in Bonneville-sur-Touques in 2026? Explore comprehensive Airbnb analytics for Bonneville-sur-Touques, Normandy, France to uncover income potential. This 2026 STR market report for Bonneville-sur-Touques, based on AirROI data from February 2025 to January 2026, reveals key trends in the niche market of 26 active listings.
Whether you're considering an Airbnb investment in Bonneville-sur-Touques, optimizing your existing vacation rental, or exploring rental arbitrage opportunities, understanding the Bonneville-sur-Touques Airbnb data is crucial. Leveraging the low regulation environment is key to maximizing your short term rental income potential. Let's dive into the specifics.
Key Bonneville-sur-Touques Airbnb Performance Metrics Overview
Monthly Airbnb Revenue Variations & Income Potential in Bonneville-sur-Touques (2026)
Understanding the monthly revenue variations for Airbnb listings in Bonneville-sur-Touques is key to maximizing your short term rental income potential. Seasonality significantly impacts earnings. Our analysis, based on data from the past 12 months, shows that the peak revenue month for STRs in Bonneville-sur-Touques is typically August, while February often presents the lowest earnings, highlighting opportunities for strategic pricing adjustments during shoulder and low seasons. Explore the typical Airbnb income in Bonneville-sur-Touques across different performance tiers:
- Best-in-class properties (Top 10%) achieve $10,543+ monthly, often utilizing dynamic pricing and superior guest experiences.
- Strong performing properties (Top 25%) earn $5,656 or more, indicating effective management and desirable locations/amenities.
- Typical properties (Median) generate around $1,715 per month, representing the average market performance.
- Entry-level properties (Bottom 25%) see earnings around $972, often with potential for optimization.
Average Monthly Airbnb Earnings Trend in Bonneville-sur-Touques
Bonneville-sur-Touques Airbnb Occupancy Rate Trends (2026)
Maximize your bookings by understanding the Bonneville-sur-Touques STR occupancy trends. Seasonal demand shifts significantly influence how often properties are booked. Typically, Augustsees the highest demand (peak season occupancy), while February experiences the lowest (low season). Effective strategies, like adjusting minimum stays or offering promotions, can boost occupancy during slower periods. Here's how different property tiers perform in Bonneville-sur-Touques:
- Best-in-class properties (Top 10%) achieve 60%+ occupancy, indicating high desirability and potentially optimized availability.
- Strong performing properties (Top 25%) maintain 42% or higher occupancy, suggesting good market fit and guest satisfaction.
- Typical properties (Median) have an occupancy rate around 25%.
- Entry-level properties (Bottom 25%) average 14% occupancy, potentially facing higher vacancy.
Average Monthly Occupancy Rate Trend in Bonneville-sur-Touques
Average Daily Rate (ADR) Airbnb Trends in Bonneville-sur-Touques (2026)
Effective short term rental pricing strategy in Bonneville-sur-Touques involves understanding monthly ADR fluctuations. The Average Daily Rate (ADR) for Airbnb in Bonneville-sur-Touques typically peaks in July and dips lowest during March. Leveraging Airbnb dynamic pricing tools or strategies based on this seasonality can significantly boost revenue. Here's a look at the typical nightly rates achieved:
- Best-in-class properties (Top 10%) command rates of $1,000+ per night, often due to premium features or locations.
- Strong performing properties (Top 25%) achieve nightly rates of $533 or more.
- Typical properties (Median) charge around $259 per night.
- Entry-level properties (Bottom 25%) earn around $145 per night.
Average Daily Rate (ADR) Trend by Month in Bonneville-sur-Touques
Get Live Bonneville-sur-Touques Market Intelligence 👇

Explore Real-time Analytics
Airbnb Seasonality Analysis & Trends in Bonneville-sur-Touques (2026)
Peak Season (August, July, April)
- Revenue averages $6,860 per month
- Occupancy rates average 50.9%
- Daily rates average $431
Shoulder Season
- Revenue averages $3,468 per month
- Occupancy maintains around 26.1%
- Daily rates hold near $407
Low Season (January, February, November)
- Revenue drops to average $1,913 per month
- Occupancy decreases to average 20.6%
- Daily rates adjust to average $392
Seasonality Insights for Bonneville-sur-Touques
- The Airbnb seasonality in Bonneville-sur-Touques shows highly seasonal trends requiring careful strategy. While the sections above show seasonal averages, it's also insightful to look at the extremes:
- During the high season, the absolute peak month showcases Bonneville-sur-Touques's highest earning potential, with monthly revenues capable of climbing to $7,701, occupancy reaching a high of 59.8%, and ADRs peaking at $451.
- Conversely, the slowest single month of the year, typically falling within the low season, marks the market's lowest point. In this month, revenue might dip to $1,584, occupancy could drop to 18.6%, and ADRs may adjust down to $371.
- Understanding both the seasonal averages and these monthly peaks and troughs in revenue, occupancy, and ADR is crucial for maximizing your Airbnb profit potential in Bonneville-sur-Touques.
Seasonal Strategies for Maximizing Profit
- Peak Season: Maximize revenue through premium pricing and potentially longer minimum stays. Ensure high availability.
- Low Season: Offer competitive pricing, special promotions (e.g., extended stay discounts), and flexible cancellation policies. Target off-season travelers like remote workers or budget-conscious guests.
- Shoulder Seasons: Implement dynamic pricing that balances peak and low rates. Target weekend travelers or specific events. Offer slightly more flexible terms than peak season.
- Regularly analyze your own performance against these Bonneville-sur-Touques seasonality benchmarks and adjust your pricing and availability strategy accordingly.
Best Areas for Airbnb Investment in Bonneville-sur-Touques (2026)
Exploring the top neighborhoods for short-term rentals in Bonneville-sur-Touques? This section highlights key areas, outlining why they are attractive for hosts and guests, along with notable local attractions. Consider these locations based on your target guest profile and investment strategy.
| Neighborhood / Area | Why Host Here? (Target Guests & Appeal) | Key Attractions & Landmarks |
|---|---|---|
| Centre de Bonneville-sur-Touques | The heart of Bonneville-sur-Touques with charming streets, local bakeries, and a traditional French vibe. Ideal for guests who want to experience the local culture and cuisine. | Église Saint-Michel, Château de la Couronne, Local markets, French bistros, Scenic countryside walks |
| Seaside near Deauville | A short distance from Deauville's famous beach, this area attracts summer vacationers and those looking for luxury and leisure. | Plage de Deauville, Casino de Deauville, Promenade des Planches, Deauville Marina, Horse racing at Deauville |
| Honfleur nearby | Proximity to the picturesque town of Honfleur, known for its harbor and rich art history. Great for tourists exploring Normandy's cultural gems. | Vieux Bassin, Saint-Catherine's Church, Museums of Honfleur, Art galleries, Local seafood restaurants |
| Trouville-sur-Mer | Just across the water from Deauville, Trouville-sur-Mer is known for its vibrant beach and seafood restaurants, appealing to families and beachgoers. | Trouville Beach, Promenade des Planches, Fish market, Cultural events and festivals, Deauville's attractions |
| Golf resorts | The region features several prestigious golf courses, attracting golfing enthusiasts from around the world, especially during the summer months. | Golf Barrière Deauville, Montgomery Golf Course, Scenic landscapes, Golf tournaments, Clubhouses and amenities |
| Countryside retreats | The serene Normandy countryside, perfect for nature lovers and those seeking a peaceful retreat. Ideal for weekend getaways. | Normandy farms, Biking trails, D-Day beaches, Countryside vineyards, Local festivals |
| Cultural excursions | Close to historical sites of Normandy, this area is perfect for those interested in World War II history and French culture. | D-Day landing beaches, Abbaye aux Hommes, Caen Memorial Museum, Historical tours, Château de Caen |
| Local markets and fairs | This area frequently hosts local markets and fairs, providing a vibrant community atmosphere and an engaging experience for visitors. | Weekly farmer's markets, Craft fairs, Food festivals, Artisan shops, Community events |
Understanding Airbnb License Requirements & STR Laws in Bonneville-sur-Touques (2026)
While Bonneville-sur-Touques, Normandy, France currently shows low STR regulations, specific Airbnb license requirements might still exist or change. Always verify the latest short term rental regulations and Airbnb license requirements directly with local government authorities for Bonneville-sur-Touques to ensure full compliance before hosting.
(Source: AirROI data, 2026, based on 4% licensed listings)
Top Performing Airbnb Properties in Bonneville-sur-Touques (2026)
Benchmark your potential! Explore examples of top-performing Airbnb properties in Bonneville-sur-Touquesbased on Trailing Twelve Month (TTM) revenue. Analyze their characteristics, revenue, occupancy rate, and ADR to understand what drives success in this market.

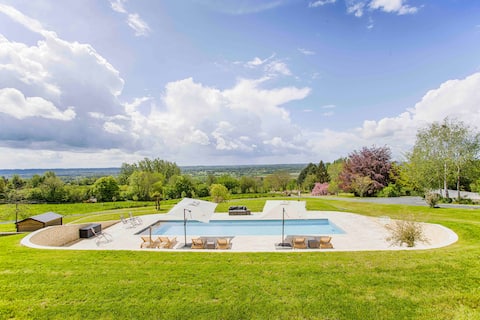
Luxurious residence with a heated swimming pool
Entire Place • 5 bedrooms

Villa with pool, sea and countryside views.
Entire Place • 5 bedrooms
La Mamana – Deauville – Pool – Tennis
Entire Place • 5 bedrooms

Exceptional Villa Deauv Hills, Deauville
Entire Place • 5 bedrooms

House Deauville - Trouville heated pool
Entire Place • 4 bedrooms

La Cabane des Princesses
Entire Place • 3 bedrooms
Note: Performance varies based on location, size, amenities, seasonality, and management quality. Data reflects the past 12 months.
Top Performing Airbnb Hosts in Bonneville-sur-Touques (2026)
Learn from the best! This table showcases top-performing Airbnb hosts in Bonneville-sur-Touques based on the number of properties managed and estimated total revenue over the past year. Analyze their scale and performance metrics.
| Host Name | Properties | Grossing Revenue | Stay Reviews | Avg Rating |
|---|---|---|---|---|
| Emilie | 1 | $127,220 | 65 | 4.55/5.0 |
| Emma | 1 | $121,753 | 75 | 4.95/5.0 |
| Stéphanie | 2 | $99,408 | 175 | 4.98/5.0 |
| Brigitte | 1 | $97,212 | 20 | 4.65/5.0 |
| Elie | 1 | $77,705 | 9 | 5.00/5.0 |
| Stephanie | 1 | $59,610 | 63 | 4.81/5.0 |
| Maison Blanche | 1 | $36,906 | 16 | 4.88/5.0 |
| Sabine Et Sébastien | 1 | $31,370 | 15 | 4.60/5.0 |
| Marion | 1 | $27,239 | 2 | Not Rated |
| Laurent | 2 | $23,202 | 20 | 4.83/5.0 |
Analyzing the strategies of top hosts, such as their property selection, pricing, and guest communication, can offer valuable lessons for optimizing your own Airbnb operations in Bonneville-sur-Touques.
Dive Deeper: Advanced Bonneville-sur-Touques STR Market Data (2026)
Ready to unlock more insights? AirROI provides access to advanced metrics and comprehensive Airbnb data for Bonneville-sur-Touques. Explore detailed analytics beyond this report to refine your investment strategy, optimize pricing, and maximize your vacation rental profits.
Explore Advanced MetricsBonneville-sur-Touques Short-Term Rental Market Composition (2026): Property & Room Types
Room Type Distribution
Property Type Distribution
Market Composition Insights for Bonneville-sur-Touques
- The Bonneville-sur-Touques Airbnb market composition is heavily skewed towards Entire Home/Apt listings, which make up 84.6% of the 26 active rentals. This indicates strong guest preference for privacy and space.
- Looking at the property type distribution in Bonneville-sur-Touques, House properties are the most common (80.8%), reflecting the local real estate landscape.
- Houses represent a significant 80.8% portion, catering likely to families or larger groups.
- Smaller segments like hotel/boutique (combined 3.8%) offer potential for unique stay experiences.
Bonneville-sur-Touques Airbnb Room Capacity Analysis (2026): Bedroom Distribution
Distribution of Listings by Number of Bedrooms
Room Capacity Insights for Bonneville-sur-Touques
- The dominant room capacity in Bonneville-sur-Touques is 1 bedroom listings, making up 26.9% of the market. This suggests a strong demand for properties suitable for couples or solo travelers.
- Together, 1 bedroom and 5+ bedrooms properties represent 50.0% of the active Airbnb listings in Bonneville-sur-Touques, indicating a high concentration in these sizes.
- A significant 46.2% of listings offer 3+ bedrooms, catering to larger groups and families seeking more space in Bonneville-sur-Touques.
Bonneville-sur-Touques Vacation Rental Guest Capacity Trends (2026)
Distribution of Listings by Guest Capacity
Guest Capacity Insights for Bonneville-sur-Touques
- The most common guest capacity trend in Bonneville-sur-Touques vacation rentals is listings accommodating 8+ guests (34.6%). This suggests the primary traveler segment is likely larger groups.
- Properties designed for 8+ guests and 4 guests dominate the Bonneville-sur-Touques STR market, accounting for 57.7% of listings.
- 42.2% of properties accommodate 6+ guests, serving the market segment for larger families or group travel in Bonneville-sur-Touques.
- On average, properties in Bonneville-sur-Touques are equipped to host 4.8 guests.
Bonneville-sur-Touques Airbnb Booking Patterns (2026): Available vs. Booked Days
Available Days Distribution
Booked Days Distribution
Booking Pattern Insights for Bonneville-sur-Touques
- The most common availability pattern in Bonneville-sur-Touques falls within the 271-366 days range, representing 69.2% of listings. This suggests many properties have significant open periods on their calendars.
- Approximately 96.1% of listings show high availability (181+ days open annually), indicating potential for increased bookings or specific owner usage patterns.
- For booked days, the 31-90 days range is most frequent in Bonneville-sur-Touques (42.3%), reflecting common guest stay durations or potential owner blocking patterns.
- A notable 7.7% of properties secure long booking periods (181+ days booked per year), highlighting successful long-term rental strategies or significant owner usage.
Bonneville-sur-Touques Airbnb Minimum Stay Requirements Analysis
Distribution of Listings by Minimum Night Requirement
1 Night
4 listings
15.4% of total
2 Nights
6 listings
23.1% of total
4-6 Nights
3 listings
11.5% of total
30+ Nights
13 listings
50% of total
Key Insights
- The most prevalent minimum stay requirement in Bonneville-sur-Touques is 30+ Nights, adopted by 50% of listings. This highlights the market's preference for longer commitments.
- A significant segment (50%) caters to monthly stays (30+ nights) in Bonneville-sur-Touques, pointing to opportunities in the extended-stay market.
Recommendations
- Align with the market by considering a 30+ Nights minimum stay, as 50% of Bonneville-sur-Touques hosts use this setting.
- If feasible, allowing 1-night stays, especially midweek or during low season, could capture last-minute bookings, as only 15.4% currently do.
- Explore offering discounts for stays of 30+ nights to attract the 50% of the market seeking extended stays.
- Adjust minimum nights based on seasonality – potentially shorter during low season and longer during peak demand periods in Bonneville-sur-Touques.
Bonneville-sur-Touques Airbnb Cancellation Policy Trends Analysis (2026)
Super Strict 30 Days
1 listings
3.8% of total
Flexible
4 listings
15.4% of total
Moderate
8 listings
30.8% of total
Firm
9 listings
34.6% of total
Strict
4 listings
15.4% of total
Cancellation Policy Insights for Bonneville-sur-Touques
- The prevailing Airbnb cancellation policy trend in Bonneville-sur-Touques is Firm, used by 34.6% of listings.
- There's a relatively balanced mix between guest-friendly (46.2%) and stricter (50.0%) policies, offering choices for different guest needs.
Recommendations for Hosts
- Consider adopting a Firm policy to align with the 34.6% market standard in Bonneville-sur-Touques.
- Regularly review your cancellation policy against competitors and market demand shifts in Bonneville-sur-Touques.
Bonneville-sur-Touques STR Booking Lead Time Analysis (2026)
Average Booking Lead Time by Month
Booking Lead Time Insights for Bonneville-sur-Touques
- The overall average booking lead time for vacation rentals in Bonneville-sur-Touques is 40 days.
- Guests book furthest in advance for stays during April (average 51 days), likely coinciding with peak travel demand or local events.
- The shortest booking windows occur for stays in January (average 14 days), indicating more last-minute travel plans during this time.
- Seasonally, Summer (47 days avg.) sees the longest lead times, while Winter (26 days avg.) has the shortest, reflecting typical travel planning cycles.
Recommendations for Hosts
- Use the overall average lead time (40 days) as a baseline for your pricing and availability strategy in Bonneville-sur-Touques.
- For April stays, consider implementing length-of-stay discounts or slightly higher rates for bookings made less than 51 days out to capitalize on advance planning.
- During January, focus on last-minute booking availability and promotions, as guests book with very short notice (14 days avg.).
- Target marketing efforts for the Summer season well in advance (at least 47 days) to capture early planners.
- Monitor your own booking lead times against these Bonneville-sur-Touques averages to identify opportunities for dynamic pricing adjustments.
Popular & Essential Airbnb Amenities in Bonneville-sur-Touques (2026)
Amenity Prevalence
Amenity Insights for Bonneville-sur-Touques
- Essential amenities in Bonneville-sur-Touques that guests expect include: Free parking on premises, TV. Lacking these (any) could significantly impact bookings.
- Popular amenities like Heating, Kitchen, Dishes and silverware are common but not universal. Offering these can provide a competitive edge.
- Warning: Wifi is not universally provided but is considered essential globally. Ensure reliable Wifi is offered.
Recommendations for Hosts
- Ensure your listing includes all essential amenities for Bonneville-sur-Touques: Free parking on premises, TV.
- Prioritize adding missing essentials: TV.
- Consider adding popular differentiators like Heating or Kitchen to increase appeal.
- Highlight unique or less common amenities you offer (e.g., hot tub, dedicated workspace, EV charger) in your listing description and photos.
- Regularly check competitor amenities in Bonneville-sur-Touques to stay competitive.
Bonneville-sur-Touques Airbnb Guest Demographics & Profile Analysis (2026)
Guest Profile Summary for Bonneville-sur-Touques
- The typical guest profile for Airbnb in Bonneville-sur-Touques consists of primarily domestic travelers (76%), often arriving from nearby Paris, typically belonging to the Post-2000s (Gen Z/Alpha) group (50%), primarily speaking English or French.
- Domestic travelers account for 76.0% of guests.
- Key international markets include France (76%) and Netherlands (6.7%).
- Top languages spoken are English (34.8%) followed by French (31.5%).
- A significant demographic segment is the Post-2000s (Gen Z/Alpha) group, representing 50% of guests.
Recommendations for Hosts
- Target domestic marketing efforts towards travelers from Paris and London.
- Tailor amenities and listing descriptions to appeal to the dominant Post-2000s (Gen Z/Alpha) demographic (e.g., highlight fast WiFi, smart home features, local guides).
- Highlight unique local experiences or amenities relevant to the primary guest profile.
- Consider seasonal promotions aligned with peak travel times for key origin markets.
Nearby Short-Term Rental Market Comparison
How does the Bonneville-sur-Touques Airbnb market stack up against its neighbors? Compare key performance metrics like average monthly revenue, ADR, and occupancy rates in surrounding areas to understand the broader regional STR landscape.
| Market | Active Properties | Monthly Revenue | Daily Rate | Avg. Occupancy |
|---|---|---|---|---|
| La Couture-Boussey | 11 | $4,086 | $464.04 | 28% |
| La Poterie-Cap-d'Antifer | 15 | $3,878 | $273.66 | 48% |
| Saint-Étienne-la-Thillaye | 23 | $3,486 | $390.94 | 35% |
| Roedean | 52 | $3,379 | $273.40 | 45% |
| Saint-Pierre-du-Val | 15 | $3,257 | $343.84 | 38% |
| Petiville | 13 | $3,232 | $379.66 | 33% |
| Rugles | 11 | $3,164 | $308.65 | 32% |
| Mesnils-sur-Iton | 24 | $3,099 | $348.65 | 41% |
| Charencey | 11 | $3,030 | $245.41 | 41% |
| Tourouvre au Perche | 31 | $3,003 | $254.65 | 39% |