Monceaux-en-Bessin Airbnb Market Analysis 2026: Short Term Rental Data & Vacation Rental Statistics in Normandy, France
Is Airbnb profitable in Monceaux-en-Bessin in 2026? Explore comprehensive Airbnb analytics for Monceaux-en-Bessin, Normandy, France to uncover income potential. This 2026 STR market report for Monceaux-en-Bessin, based on AirROI data from February 2025 to January 2026, reveals key trends in the niche market of 20 active listings.
Whether you're considering an Airbnb investment in Monceaux-en-Bessin, optimizing your existing vacation rental, or exploring rental arbitrage opportunities, understanding the Monceaux-en-Bessin Airbnb data is crucial. Understanding the local regulations is key to maximizing your short term rental income potential. Let's dive into the specifics.
Key Monceaux-en-Bessin Airbnb Performance Metrics Overview
Monthly Airbnb Revenue Variations & Income Potential in Monceaux-en-Bessin (2026)
Understanding the monthly revenue variations for Airbnb listings in Monceaux-en-Bessin is key to maximizing your short term rental income potential. Seasonality significantly impacts earnings. Our analysis, based on data from the past 12 months, shows that the peak revenue month for STRs in Monceaux-en-Bessin is typically August, while November often presents the lowest earnings, highlighting opportunities for strategic pricing adjustments during shoulder and low seasons. Explore the typical Airbnb income in Monceaux-en-Bessin across different performance tiers:
- Best-in-class properties (Top 10%) achieve $4,419+ monthly, often utilizing dynamic pricing and superior guest experiences.
- Strong performing properties (Top 25%) earn $2,662 or more, indicating effective management and desirable locations/amenities.
- Typical properties (Median) generate around $1,546 per month, representing the average market performance.
- Entry-level properties (Bottom 25%) see earnings around $762, often with potential for optimization.
Average Monthly Airbnb Earnings Trend in Monceaux-en-Bessin
Monceaux-en-Bessin Airbnb Occupancy Rate Trends (2026)
Maximize your bookings by understanding the Monceaux-en-Bessin STR occupancy trends. Seasonal demand shifts significantly influence how often properties are booked. Typically, Augustsees the highest demand (peak season occupancy), while November experiences the lowest (low season). Effective strategies, like adjusting minimum stays or offering promotions, can boost occupancy during slower periods. Here's how different property tiers perform in Monceaux-en-Bessin:
- Best-in-class properties (Top 10%) achieve 81%+ occupancy, indicating high desirability and potentially optimized availability.
- Strong performing properties (Top 25%) maintain 61% or higher occupancy, suggesting good market fit and guest satisfaction.
- Typical properties (Median) have an occupancy rate around 37%.
- Entry-level properties (Bottom 25%) average 21% occupancy, potentially facing higher vacancy.
Average Monthly Occupancy Rate Trend in Monceaux-en-Bessin
Average Daily Rate (ADR) Airbnb Trends in Monceaux-en-Bessin (2026)
Effective short term rental pricing strategy in Monceaux-en-Bessin involves understanding monthly ADR fluctuations. The Average Daily Rate (ADR) for Airbnb in Monceaux-en-Bessin typically peaks in June and dips lowest during February. Leveraging Airbnb dynamic pricing tools or strategies based on this seasonality can significantly boost revenue. Here's a look at the typical nightly rates achieved:
- Best-in-class properties (Top 10%) command rates of $331+ per night, often due to premium features or locations.
- Strong performing properties (Top 25%) achieve nightly rates of $270 or more.
- Typical properties (Median) charge around $107 per night.
- Entry-level properties (Bottom 25%) earn around $85 per night.
Average Daily Rate (ADR) Trend by Month in Monceaux-en-Bessin
Get Live Monceaux-en-Bessin Market Intelligence 👇

Explore Real-time Analytics
Airbnb Seasonality Analysis & Trends in Monceaux-en-Bessin (2026)
Peak Season (August, July, June)
- Revenue averages $3,036 per month
- Occupancy rates average 58.8%
- Daily rates average $176
Shoulder Season
- Revenue averages $1,876 per month
- Occupancy maintains around 39.1%
- Daily rates hold near $168
Low Season (February, March, November)
- Revenue drops to average $1,157 per month
- Occupancy decreases to average 36.7%
- Daily rates adjust to average $156
Seasonality Insights for Monceaux-en-Bessin
- The Airbnb seasonality in Monceaux-en-Bessin shows highly seasonal trends requiring careful strategy. While the sections above show seasonal averages, it's also insightful to look at the extremes:
- During the high season, the absolute peak month showcases Monceaux-en-Bessin's highest earning potential, with monthly revenues capable of climbing to $3,436, occupancy reaching a high of 67.9%, and ADRs peaking at $182.
- Conversely, the slowest single month of the year, typically falling within the low season, marks the market's lowest point. In this month, revenue might dip to $1,011, occupancy could drop to 32.1%, and ADRs may adjust down to $150.
- Understanding both the seasonal averages and these monthly peaks and troughs in revenue, occupancy, and ADR is crucial for maximizing your Airbnb profit potential in Monceaux-en-Bessin.
Seasonal Strategies for Maximizing Profit
- Peak Season: Maximize revenue through premium pricing and potentially longer minimum stays. Ensure high availability.
- Low Season: Offer competitive pricing, special promotions (e.g., extended stay discounts), and flexible cancellation policies. Target off-season travelers like remote workers or budget-conscious guests.
- Shoulder Seasons: Implement dynamic pricing that balances peak and low rates. Target weekend travelers or specific events. Offer slightly more flexible terms than peak season.
- Regularly analyze your own performance against these Monceaux-en-Bessin seasonality benchmarks and adjust your pricing and availability strategy accordingly.
Best Areas for Airbnb Investment in Monceaux-en-Bessin (2026)
Exploring the top neighborhoods for short-term rentals in Monceaux-en-Bessin? This section highlights key areas, outlining why they are attractive for hosts and guests, along with notable local attractions. Consider these locations based on your target guest profile and investment strategy.
| Neighborhood / Area | Why Host Here? (Target Guests & Appeal) | Key Attractions & Landmarks |
|---|---|---|
| Villedieu-les-Poêles | Famous for its bell foundry and copper craft, this historic town offers cultural experiences and attracts tourists interested in heritage and craftsmanship. | Villedieu-les-Poêles Bell Foundry, Les Grands Thermes, Abbey of Saint-Pierre, Cider Museum, Château de Gratot |
| Bayeux | Home to the famous Bayeux Tapestry, this town offers rich history, beautiful architecture, and is a hub for tourists visiting Normandy heritage sites. | Bayeux Tapestry Museum, Cathédrale Notre-Dame, La British Cemetery, Museum of the Battle of Normandy, Bayeux Botanical Garden |
| Arromanches-les-Bains | A key location during D-Day, this coastal town attracts history buffs and tourists interested in WWII memorials and beaches. | Arromanches 360 Circular Cinema, Gold Beach, Mulberry Harbour, D-Day Museum, British Normandy Memorial |
| Saint-Lô | Known as the capital of the Manche, it features a rich history and is a strategic location for exploring nearby Normandy landmarks. | Saint-Lô War Museum, Saint-Lô Château, Le Parc de la mairie, La Poterie Museum, Porte des Cordeliers |
| Carentan | Close to Utah Beach, this town is steeped in WWII history and attracts visitors interested in the historic landings and local culture. | D-Day Experience, Utah Beach Museum, Carentan Market, Basilique de Carentan, Historical Museum of the Landing in Normandy |
| Cherbourg-en-Cotentin | A major port city with a rich maritime history, it offers cultural attractions and beautiful coastal landscapes. | Cité de la Mer, La Gallery d'Arte, Cherbourg Harbour, Batterie Tragique, Mountain of the Holy Spirit |
| Grandcamp-Maisy | A picturesque fishing village close to key D-Day sites, perfect for those seeking a peaceful coastal retreat with historical significance. | Maisy Battery, Grandcamp-Maisy Market, Seafood Restaurants, D-Day beaches, La Pointe du Hoc |
| Colleville-sur-Mer | Famous for the American Cemetery, this location attracts visitors looking for reflective historical experiences and coastal beauty. | American Cemetery and Memorial, Omaha Beach, German Cemetery, Museum Overlord, Point du Hoc |
Understanding Airbnb License Requirements & STR Laws in Monceaux-en-Bessin (2026)
With 15% of listings showing registration in 2026, understanding potential Airbnb license requirements is crucial in Monceaux-en-Bessin. Always verify the latest short term rental regulations and Airbnb license requirements directly with local government authorities for Monceaux-en-Bessin to ensure full compliance before hosting.
(Source: AirROI data, 2026, based on 15% licensed listings)
Top Performing Airbnb Properties in Monceaux-en-Bessin (2026)
Benchmark your potential! Explore examples of top-performing Airbnb properties in Monceaux-en-Bessinbased on Trailing Twelve Month (TTM) revenue. Analyze their characteristics, revenue, occupancy rate, and ADR to understand what drives success in this market.

La Maison de la Ferme - Les Maisons des Pommiers -
Entire Place • 5 bedrooms
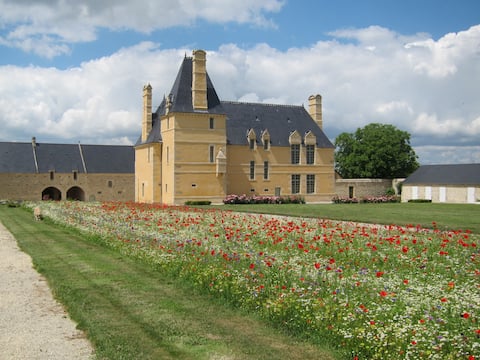
Manoir des Equerres: Your story in History
Entire Place • 2 bedrooms

Le Manoir des Equerres – Le Gîte du Jardinier
Entire Place • 2 bedrooms
The Barn - The Apple Tree Houses - Bayeux
Entire Place • 3 bedrooms

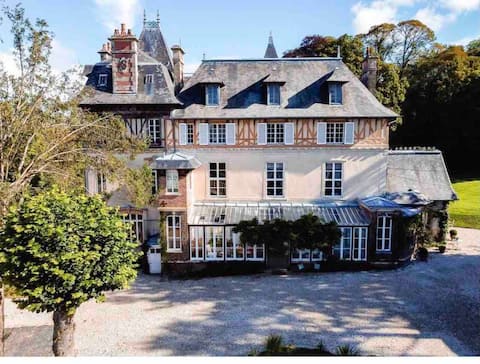
Château de Monceaux - South Wing - 5 min from Bayeux
Entire Place • 3 bedrooms
At the Manor Farm
Entire Place • 3 bedrooms
Note: Performance varies based on location, size, amenities, seasonality, and management quality. Data reflects the past 12 months.
Top Performing Airbnb Hosts in Monceaux-en-Bessin (2026)
Learn from the best! This table showcases top-performing Airbnb hosts in Monceaux-en-Bessin based on the number of properties managed and estimated total revenue over the past year. Analyze their scale and performance metrics.
| Host Name | Properties | Grossing Revenue | Stay Reviews | Avg Rating |
|---|---|---|---|---|
| Emmanuelle | 4 | $116,732 | 35 | 4.97/5.0 |
| Marie | 4 | $97,185 | 986 | 4.91/5.0 |
| Laurence | 2 | $33,894 | 26 | 4.89/5.0 |
| Christophe | 2 | $28,212 | 132 | 4.81/5.0 |
| Jeanne | 3 | $25,804 | 149 | 4.69/5.0 |
| David | 1 | $15,815 | 30 | 4.83/5.0 |
| Sylvie | 1 | $9,025 | 22 | 4.95/5.0 |
| Dominique | 1 | $8,830 | 31 | 4.87/5.0 |
| Léa | 1 | $4,214 | 11 | 4.91/5.0 |
| Joel | 1 | $1,771 | 22 | 4.64/5.0 |
Analyzing the strategies of top hosts, such as their property selection, pricing, and guest communication, can offer valuable lessons for optimizing your own Airbnb operations in Monceaux-en-Bessin.
Dive Deeper: Advanced Monceaux-en-Bessin STR Market Data (2026)
Ready to unlock more insights? AirROI provides access to advanced metrics and comprehensive Airbnb data for Monceaux-en-Bessin. Explore detailed analytics beyond this report to refine your investment strategy, optimize pricing, and maximize your vacation rental profits.
Explore Advanced MetricsMonceaux-en-Bessin Short-Term Rental Market Composition (2026): Property & Room Types
Room Type Distribution
Property Type Distribution
Market Composition Insights for Monceaux-en-Bessin
- The Monceaux-en-Bessin Airbnb market composition is heavily skewed towards Entire Home/Apt listings, which make up 80% of the 20 active rentals. This indicates strong guest preference for privacy and space.
- Looking at the property type distribution in Monceaux-en-Bessin, House properties are the most common (70%), reflecting the local real estate landscape.
- Houses represent a significant 70% portion, catering likely to families or larger groups.
Monceaux-en-Bessin Airbnb Room Capacity Analysis (2026): Bedroom Distribution
Distribution of Listings by Number of Bedrooms
Room Capacity Insights for Monceaux-en-Bessin
- The dominant room capacity in Monceaux-en-Bessin is 3 bedrooms listings, making up 40% of the market. This suggests a strong demand for properties suitable for families or small groups.
- Together, 3 bedrooms and 1 bedroom properties represent 60.0% of the active Airbnb listings in Monceaux-en-Bessin, indicating a high concentration in these sizes.
- A significant 50.0% of listings offer 3+ bedrooms, catering to larger groups and families seeking more space in Monceaux-en-Bessin.
Monceaux-en-Bessin Vacation Rental Guest Capacity Trends (2026)
Distribution of Listings by Guest Capacity
Guest Capacity Insights for Monceaux-en-Bessin
- The most common guest capacity trend in Monceaux-en-Bessin vacation rentals is listings accommodating 8+ guests (25%). This suggests the primary traveler segment is likely larger groups.
- Properties designed for 8+ guests and 4 guests dominate the Monceaux-en-Bessin STR market, accounting for 50.0% of listings.
- 40.0% of properties accommodate 6+ guests, serving the market segment for larger families or group travel in Monceaux-en-Bessin.
- On average, properties in Monceaux-en-Bessin are equipped to host 4.5 guests.
Monceaux-en-Bessin Airbnb Booking Patterns (2026): Available vs. Booked Days
Available Days Distribution
Booked Days Distribution
Booking Pattern Insights for Monceaux-en-Bessin
- The most common availability pattern in Monceaux-en-Bessin falls within the 271-366 days range, representing 50% of listings. This suggests many properties have significant open periods on their calendars.
- Approximately 80.0% of listings show high availability (181+ days open annually), indicating potential for increased bookings or specific owner usage patterns.
- For booked days, the 91-180 days range is most frequent in Monceaux-en-Bessin (35%), reflecting common guest stay durations or potential owner blocking patterns.
- A notable 20.0% of properties secure long booking periods (181+ days booked per year), highlighting successful long-term rental strategies or significant owner usage.
Monceaux-en-Bessin Airbnb Minimum Stay Requirements Analysis
Distribution of Listings by Minimum Night Requirement
1 Night
5 listings
25% of total
2 Nights
5 listings
25% of total
3 Nights
4 listings
20% of total
4-6 Nights
1 listings
5% of total
7-29 Nights
1 listings
5% of total
30+ Nights
4 listings
20% of total
Key Insights
- The most prevalent minimum stay requirement in Monceaux-en-Bessin is 1 Night, adopted by 25% of listings. This highlights the market's preference for shorter, flexible bookings.
- A significant segment (20%) caters to monthly stays (30+ nights) in Monceaux-en-Bessin, pointing to opportunities in the extended-stay market.
Recommendations
- Align with the market by considering a 1 Night minimum stay, as 25% of Monceaux-en-Bessin hosts use this setting.
- If feasible, allowing 1-night stays, especially midweek or during low season, could capture last-minute bookings, as only 25% currently do.
- Explore offering discounts for stays of 30+ nights to attract the 20% of the market seeking extended stays.
- Adjust minimum nights based on seasonality – potentially shorter during low season and longer during peak demand periods in Monceaux-en-Bessin.
Monceaux-en-Bessin Airbnb Cancellation Policy Trends Analysis (2026)
Flexible
6 listings
33.3% of total
Moderate
4 listings
22.2% of total
Firm
6 listings
33.3% of total
Strict
2 listings
11.1% of total
Cancellation Policy Insights for Monceaux-en-Bessin
- The prevailing Airbnb cancellation policy trend in Monceaux-en-Bessin is Flexible, used by 33.3% of listings.
- There's a relatively balanced mix between guest-friendly (55.5%) and stricter (44.4%) policies, offering choices for different guest needs.
Recommendations for Hosts
- Consider adopting a Flexible policy to align with the 33.3% market standard in Monceaux-en-Bessin.
- Using a Strict policy might deter some guests, as only 11.1% of listings use it. Evaluate if potential revenue protection outweighs possible lower booking rates.
- Regularly review your cancellation policy against competitors and market demand shifts in Monceaux-en-Bessin.
Monceaux-en-Bessin STR Booking Lead Time Analysis (2026)
Average Booking Lead Time by Month
Booking Lead Time Insights for Monceaux-en-Bessin
- The overall average booking lead time for vacation rentals in Monceaux-en-Bessin is 89 days.
- Guests book furthest in advance for stays during June (average 131 days), likely coinciding with peak travel demand or local events.
- The shortest booking windows occur for stays in October (average 43 days), indicating more last-minute travel plans during this time.
- Seasonally, Summer (102 days avg.) sees the longest lead times, while Fall (67 days avg.) has the shortest, reflecting typical travel planning cycles.
Recommendations for Hosts
- Use the overall average lead time (89 days) as a baseline for your pricing and availability strategy in Monceaux-en-Bessin.
- For June stays, consider implementing length-of-stay discounts or slightly higher rates for bookings made less than 131 days out to capitalize on advance planning.
- Target marketing efforts for the Summer season well in advance (at least 102 days) to capture early planners.
- Monitor your own booking lead times against these Monceaux-en-Bessin averages to identify opportunities for dynamic pricing adjustments.
Popular & Essential Airbnb Amenities in Monceaux-en-Bessin (2026)
Amenity Prevalence
Amenity Insights for Monceaux-en-Bessin
- Essential amenities in Monceaux-en-Bessin that guests expect include: Free parking on premises, Heating, Hot water, Dishes and silverware, Coffee maker. Lacking these (any) could significantly impact bookings.
- Popular amenities like Smoke alarm, Microwave, Hangers are common but not universal. Offering these can provide a competitive edge.
- Warning: Wifi is not universally provided but is considered essential globally. Ensure reliable Wifi is offered.
Recommendations for Hosts
- Ensure your listing includes all essential amenities for Monceaux-en-Bessin: Free parking on premises, Heating, Hot water, Dishes and silverware, Coffee maker.
- Prioritize adding missing essentials: Hot water, Dishes and silverware, Coffee maker.
- Consider adding popular differentiators like Smoke alarm or Microwave to increase appeal.
- Highlight unique or less common amenities you offer (e.g., hot tub, dedicated workspace, EV charger) in your listing description and photos.
- Regularly check competitor amenities in Monceaux-en-Bessin to stay competitive.
Monceaux-en-Bessin Airbnb Guest Demographics & Profile Analysis (2026)
Guest Profile Summary for Monceaux-en-Bessin
- The typical guest profile for Airbnb in Monceaux-en-Bessin consists of predominantly international visitors (72%), with top international origins including France, typically belonging to the Post-2000s (Gen Z/Alpha) group (50%), primarily speaking English or French.
- Domestic travelers account for 28.0% of guests.
- Key international markets include United States (31.9%) and France (28%).
- Top languages spoken are English (46.9%) followed by French (20.4%).
- A significant demographic segment is the Post-2000s (Gen Z/Alpha) group, representing 50% of guests.
Recommendations for Hosts
- Focus marketing internationally, particularly towards travelers from France.
- Tailor amenities and listing descriptions to appeal to the dominant Post-2000s (Gen Z/Alpha) demographic (e.g., highlight fast WiFi, smart home features, local guides).
- Highlight unique local experiences or amenities relevant to the primary guest profile.
- Consider seasonal promotions aligned with peak travel times for key origin markets.
Nearby Short-Term Rental Market Comparison
How does the Monceaux-en-Bessin Airbnb market stack up against its neighbors? Compare key performance metrics like average monthly revenue, ADR, and occupancy rates in surrounding areas to understand the broader regional STR landscape.
| Market | Active Properties | Monthly Revenue | Daily Rate | Avg. Occupancy |
|---|---|---|---|---|
| Furzehill | 10 | $4,680 | $287.32 | 49% |
| La Poterie-Cap-d'Antifer | 15 | $3,878 | $273.66 | 48% |
| Studland | 14 | $3,854 | $374.89 | 44% |
| Nettlestone | 22 | $3,843 | $413.42 | 42% |
| Shorwell | 27 | $3,557 | $297.12 | 44% |
| Shalfleet | 13 | $3,538 | $377.86 | 38% |
| Saint-Étienne-la-Thillaye | 23 | $3,486 | $390.94 | 35% |
| Roedean | 52 | $3,379 | $273.40 | 45% |
| Saint-Pierre-du-Val | 15 | $3,257 | $343.84 | 38% |
| Whitwell | 16 | $3,245 | $223.39 | 48% |