Saint-Hymer Airbnb Market Analysis 2026: Short Term Rental Data & Vacation Rental Statistics in Normandy, France
Is Airbnb profitable in Saint-Hymer in 2026? Explore comprehensive Airbnb analytics for Saint-Hymer, Normandy, France to uncover income potential. This 2026 STR market report for Saint-Hymer, based on AirROI data from February 2025 to January 2026, reveals key trends in the niche market of 24 active listings.
Whether you're considering an Airbnb investment in Saint-Hymer, optimizing your existing vacation rental, or exploring rental arbitrage opportunities, understanding the Saint-Hymer Airbnb data is crucial. Leveraging the low regulation environment is key to maximizing your short term rental income potential. Let's dive into the specifics.
Key Saint-Hymer Airbnb Performance Metrics Overview
Monthly Airbnb Revenue Variations & Income Potential in Saint-Hymer (2026)
Understanding the monthly revenue variations for Airbnb listings in Saint-Hymer is key to maximizing your short term rental income potential. Seasonality significantly impacts earnings. Our analysis, based on data from the past 12 months, shows that the peak revenue month for STRs in Saint-Hymer is typically August, while February often presents the lowest earnings, highlighting opportunities for strategic pricing adjustments during shoulder and low seasons. Explore the typical Airbnb income in Saint-Hymer across different performance tiers:
- Best-in-class properties (Top 10%) achieve $6,833+ monthly, often utilizing dynamic pricing and superior guest experiences.
- Strong performing properties (Top 25%) earn $3,478 or more, indicating effective management and desirable locations/amenities.
- Typical properties (Median) generate around $1,353 per month, representing the average market performance.
- Entry-level properties (Bottom 25%) see earnings around $606, often with potential for optimization.
Average Monthly Airbnb Earnings Trend in Saint-Hymer
Saint-Hymer Airbnb Occupancy Rate Trends (2026)
Maximize your bookings by understanding the Saint-Hymer STR occupancy trends. Seasonal demand shifts significantly influence how often properties are booked. Typically, Augustsees the highest demand (peak season occupancy), while February experiences the lowest (low season). Effective strategies, like adjusting minimum stays or offering promotions, can boost occupancy during slower periods. Here's how different property tiers perform in Saint-Hymer:
- Best-in-class properties (Top 10%) achieve 54%+ occupancy, indicating high desirability and potentially optimized availability.
- Strong performing properties (Top 25%) maintain 36% or higher occupancy, suggesting good market fit and guest satisfaction.
- Typical properties (Median) have an occupancy rate around 22%.
- Entry-level properties (Bottom 25%) average 12% occupancy, potentially facing higher vacancy.
Average Monthly Occupancy Rate Trend in Saint-Hymer
Average Daily Rate (ADR) Airbnb Trends in Saint-Hymer (2026)
Effective short term rental pricing strategy in Saint-Hymer involves understanding monthly ADR fluctuations. The Average Daily Rate (ADR) for Airbnb in Saint-Hymer typically peaks in July and dips lowest during February. Leveraging Airbnb dynamic pricing tools or strategies based on this seasonality can significantly boost revenue. Here's a look at the typical nightly rates achieved:
- Best-in-class properties (Top 10%) command rates of $578+ per night, often due to premium features or locations.
- Strong performing properties (Top 25%) achieve nightly rates of $391 or more.
- Typical properties (Median) charge around $208 per night.
- Entry-level properties (Bottom 25%) earn around $105 per night.
Average Daily Rate (ADR) Trend by Month in Saint-Hymer
Get Live Saint-Hymer Market Intelligence 👇

Explore Real-time Analytics
Airbnb Seasonality Analysis & Trends in Saint-Hymer (2026)
Peak Season (August, July, June)
- Revenue averages $4,452 per month
- Occupancy rates average 44.7%
- Daily rates average $289
Shoulder Season
- Revenue averages $2,379 per month
- Occupancy maintains around 23.2%
- Daily rates hold near $273
Low Season (February, October, December)
- Revenue drops to average $1,258 per month
- Occupancy decreases to average 14.6%
- Daily rates adjust to average $267
Seasonality Insights for Saint-Hymer
- The Airbnb seasonality in Saint-Hymer shows highly seasonal trends requiring careful strategy. While the sections above show seasonal averages, it's also insightful to look at the extremes:
- During the high season, the absolute peak month showcases Saint-Hymer's highest earning potential, with monthly revenues capable of climbing to $5,136, occupancy reaching a high of 55.6%, and ADRs peaking at $293.
- Conversely, the slowest single month of the year, typically falling within the low season, marks the market's lowest point. In this month, revenue might dip to $608, occupancy could drop to 9.7%, and ADRs may adjust down to $257.
- Understanding both the seasonal averages and these monthly peaks and troughs in revenue, occupancy, and ADR is crucial for maximizing your Airbnb profit potential in Saint-Hymer.
Seasonal Strategies for Maximizing Profit
- Peak Season: Maximize revenue through premium pricing and potentially longer minimum stays. Ensure high availability.
- Low Season: Offer competitive pricing, special promotions (e.g., extended stay discounts), and flexible cancellation policies. Target off-season travelers like remote workers or budget-conscious guests.
- Shoulder Seasons: Implement dynamic pricing that balances peak and low rates. Target weekend travelers or specific events. Offer slightly more flexible terms than peak season.
- Regularly analyze your own performance against these Saint-Hymer seasonality benchmarks and adjust your pricing and availability strategy accordingly.
Best Areas for Airbnb Investment in Saint-Hymer (2026)
Exploring the top neighborhoods for short-term rentals in Saint-Hymer? This section highlights key areas, outlining why they are attractive for hosts and guests, along with notable local attractions. Consider these locations based on your target guest profile and investment strategy.
| Neighborhood / Area | Why Host Here? (Target Guests & Appeal) | Key Attractions & Landmarks |
|---|---|---|
| Saint-Hymer Town Center | The central area of Saint-Hymer is vibrant with local shops, bakeries, and cafes. It offers a charming atmosphere with easy access to amenities, making it appealing for tourists seeking a local experience. | Saint-Hymer Church, Local bakeries, Cafe de la Gare, Saint-Hymer market, Artisan shops |
| Nearby Beaches | Saint-Hymer is only a short drive from the beautiful beaches of Normandy, making it attractive for those looking to enjoy sun and sea while having a quiet retreat to come back to in Saint-Hymer. | Deauville Beach, Trouville Beach, Cabourg Beach, Blonville-sur-Mer |
| Historical Sites | The region is rich in history and culture, with access to several historical sites that draw history enthusiasts and tourists. | D-Day Landing Beaches, Bayeux Tapestry, Caen Memorial Museum, Falaise Castle |
| Countryside Retreats | Saint-Hymer is set in the picturesque Normandy countryside, providing scenic options for those seeking relaxation away from city life. | Calvados Cider Route, Normandy Countryside, Horse riding trails, Hiking paths |
| Cultural Activities | The area hosts various cultural events and festivals throughout the year, attracting visitors interested in local culture and traditions. | Saint-Hymer Festival, Local art exhibitions, Food and wine tasting events |
| Golf Courses | With several golf courses in close proximity, this area appeals to vacationers who are also golf enthusiasts looking for leisure and relaxation. | Golf de Deauville-Saint-Gatien, Golf de Cabourg-Le Home, Saint-Julien Golf Club |
| Wine and Cider Tasting | Normandy is famous for its cider and vineyards. Tourists flock to the region for tasting tours and local produce, making it a great area for Airbnb hosts. | Cider houses, Local vineyards, Tasting tours, Normandy cheese shops |
| Proximity to Larger Cities | Saint-Hymer is conveniently located near larger cities like Deauville and Trouville, providing easy access to urban amenities while remaining in a quieter location. | Deauville Casino, Shopping in Trouville, Dining on the waterfront, Cultural events in Deauville |
Understanding Airbnb License Requirements & STR Laws in Saint-Hymer (2026)
While Saint-Hymer, Normandy, France currently shows low STR regulations, specific Airbnb license requirements might still exist or change. Always verify the latest short term rental regulations and Airbnb license requirements directly with local government authorities for Saint-Hymer to ensure full compliance before hosting.
(Source: AirROI data, 2026, finding no licensed listings among those analyzed)
Top Performing Airbnb Properties in Saint-Hymer (2026)
Benchmark your potential! Explore examples of top-performing Airbnb properties in Saint-Hymerbased on Trailing Twelve Month (TTM) revenue. Analyze their characteristics, revenue, occupancy rate, and ADR to understand what drives success in this market.
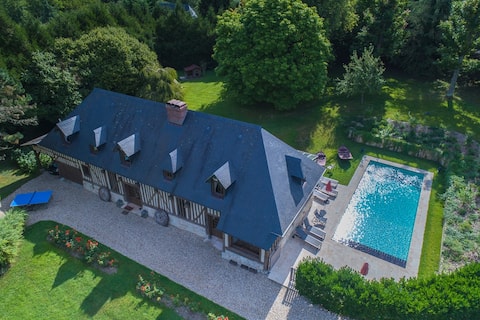
Superb Authentic 19th Century Normandy Property
Entire Place • 6 bedrooms
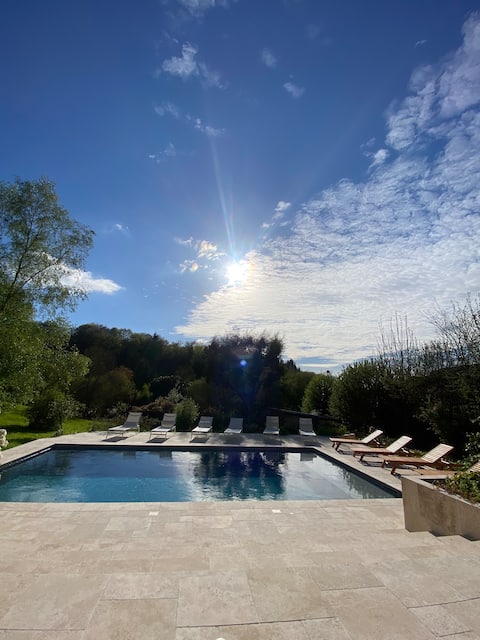
Dream location with pool near Deauville
Entire Place • 5 bedrooms
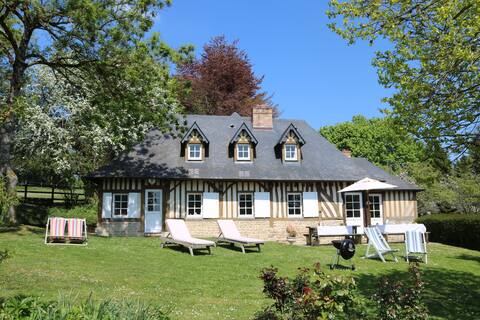
La Florale
Entire Place • 4 bedrooms
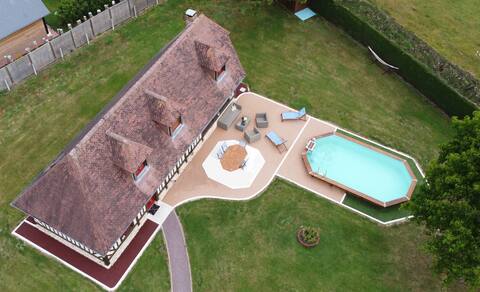
Gîte des Augettes
Entire Place • 6 bedrooms

15KM from DEAUVILLE
Entire Place • 3 bedrooms

The Valentin House
Entire Place • 2 bedrooms
Note: Performance varies based on location, size, amenities, seasonality, and management quality. Data reflects the past 12 months.
Top Performing Airbnb Hosts in Saint-Hymer (2026)
Learn from the best! This table showcases top-performing Airbnb hosts in Saint-Hymer based on the number of properties managed and estimated total revenue over the past year. Analyze their scale and performance metrics.
| Host Name | Properties | Grossing Revenue | Stay Reviews | Avg Rating |
|---|---|---|---|---|
| Sophie | 4 | $113,586 | 151 | 4.92/5.0 |
| Isabelle Et Nicolas | 1 | $106,768 | 62 | 4.94/5.0 |
| Alexandre | 1 | $80,009 | 11 | 4.91/5.0 |
| Heribert | 4 | $71,963 | 15 | 4.88/5.0 |
| Patricia | 1 | $32,423 | 121 | 4.76/5.0 |
| Véronique | 1 | $24,136 | 1 | Not Rated |
| Séverine | 3 | $15,500 | 801 | 4.79/5.0 |
| Marie Laure Et Christian | 1 | $10,746 | 60 | 4.95/5.0 |
| Jerome | 1 | $9,741 | 18 | 4.83/5.0 |
| Jean-Marie | 1 | $8,920 | 3 | 5.00/5.0 |
Analyzing the strategies of top hosts, such as their property selection, pricing, and guest communication, can offer valuable lessons for optimizing your own Airbnb operations in Saint-Hymer.
Dive Deeper: Advanced Saint-Hymer STR Market Data (2026)
Ready to unlock more insights? AirROI provides access to advanced metrics and comprehensive Airbnb data for Saint-Hymer. Explore detailed analytics beyond this report to refine your investment strategy, optimize pricing, and maximize your vacation rental profits.
Explore Advanced MetricsSaint-Hymer Short-Term Rental Market Composition (2026): Property & Room Types
Room Type Distribution
Property Type Distribution
Market Composition Insights for Saint-Hymer
- The Saint-Hymer Airbnb market composition is heavily skewed towards Entire Home/Apt listings, which make up 79.2% of the 24 active rentals. This indicates strong guest preference for privacy and space.
- Looking at the property type distribution in Saint-Hymer, House properties are the most common (83.3%), reflecting the local real estate landscape.
- Houses represent a significant 83.3% portion, catering likely to families or larger groups.
- The presence of 16.7% Hotel/Boutique listings indicates integration with traditional hospitality.
Saint-Hymer Airbnb Room Capacity Analysis (2026): Bedroom Distribution
Distribution of Listings by Number of Bedrooms
Room Capacity Insights for Saint-Hymer
- The dominant room capacity in Saint-Hymer is 2 bedrooms listings, making up 25% of the market. This suggests a strong demand for properties suitable for couples or solo travelers.
- Together, 2 bedrooms and 3 bedrooms properties represent 45.8% of the active Airbnb listings in Saint-Hymer, indicating a high concentration in these sizes.
- A significant 45.8% of listings offer 3+ bedrooms, catering to larger groups and families seeking more space in Saint-Hymer.
Saint-Hymer Vacation Rental Guest Capacity Trends (2026)
Distribution of Listings by Guest Capacity
Guest Capacity Insights for Saint-Hymer
- The most common guest capacity trend in Saint-Hymer vacation rentals is listings accommodating 8+ guests (29.2%). This suggests the primary traveler segment is likely larger groups.
- Properties designed for 8+ guests and 4 guests dominate the Saint-Hymer STR market, accounting for 45.9% of listings.
- 45.9% of properties accommodate 6+ guests, serving the market segment for larger families or group travel in Saint-Hymer.
- On average, properties in Saint-Hymer are equipped to host 4.8 guests.
Saint-Hymer Airbnb Booking Patterns (2026): Available vs. Booked Days
Available Days Distribution
Booked Days Distribution
Booking Pattern Insights for Saint-Hymer
- The most common availability pattern in Saint-Hymer falls within the 271-366 days range, representing 70.8% of listings. This suggests many properties have significant open periods on their calendars.
- Approximately 100.0% of listings show high availability (181+ days open annually), indicating potential for increased bookings or specific owner usage patterns.
- For booked days, the 31-90 days range is most frequent in Saint-Hymer (54.2%), reflecting common guest stay durations or potential owner blocking patterns.
Saint-Hymer Airbnb Minimum Stay Requirements Analysis
Distribution of Listings by Minimum Night Requirement
1 Night
4 listings
16.7% of total
2 Nights
7 listings
29.2% of total
3 Nights
1 listings
4.2% of total
4-6 Nights
1 listings
4.2% of total
7-29 Nights
2 listings
8.3% of total
30+ Nights
9 listings
37.5% of total
Key Insights
- The most prevalent minimum stay requirement in Saint-Hymer is 30+ Nights, adopted by 37.5% of listings. This highlights the market's preference for longer commitments.
- A significant segment (37.5%) caters to monthly stays (30+ nights) in Saint-Hymer, pointing to opportunities in the extended-stay market.
Recommendations
- Align with the market by considering a 30+ Nights minimum stay, as 37.5% of Saint-Hymer hosts use this setting.
- If feasible, allowing 1-night stays, especially midweek or during low season, could capture last-minute bookings, as only 16.7% currently do.
- Explore offering discounts for stays of 30+ nights to attract the 37.5% of the market seeking extended stays.
- Adjust minimum nights based on seasonality – potentially shorter during low season and longer during peak demand periods in Saint-Hymer.
Saint-Hymer Airbnb Cancellation Policy Trends Analysis (2026)
Flexible
7 listings
29.2% of total
Moderate
5 listings
20.8% of total
Firm
8 listings
33.3% of total
Strict
4 listings
16.7% of total
Cancellation Policy Insights for Saint-Hymer
- The prevailing Airbnb cancellation policy trend in Saint-Hymer is Firm, used by 33.3% of listings.
- There's a relatively balanced mix between guest-friendly (50.0%) and stricter (50.0%) policies, offering choices for different guest needs.
Recommendations for Hosts
- Consider adopting a Firm policy to align with the 33.3% market standard in Saint-Hymer.
- Regularly review your cancellation policy against competitors and market demand shifts in Saint-Hymer.
Saint-Hymer STR Booking Lead Time Analysis (2026)
Average Booking Lead Time by Month
Booking Lead Time Insights for Saint-Hymer
- The overall average booking lead time for vacation rentals in Saint-Hymer is 54 days.
- Guests book furthest in advance for stays during March (average 70 days), likely coinciding with peak travel demand or local events.
- The shortest booking windows occur for stays in February (average 13 days), indicating more last-minute travel plans during this time.
- Seasonally, Summer (61 days avg.) sees the longest lead times, while Winter (20 days avg.) has the shortest, reflecting typical travel planning cycles.
Recommendations for Hosts
- Use the overall average lead time (54 days) as a baseline for your pricing and availability strategy in Saint-Hymer.
- For March stays, consider implementing length-of-stay discounts or slightly higher rates for bookings made less than 70 days out to capitalize on advance planning.
- During February, focus on last-minute booking availability and promotions, as guests book with very short notice (13 days avg.).
- Target marketing efforts for the Summer season well in advance (at least 61 days) to capture early planners.
- Monitor your own booking lead times against these Saint-Hymer averages to identify opportunities for dynamic pricing adjustments.
Popular & Essential Airbnb Amenities in Saint-Hymer (2026)
Amenity Prevalence
Amenity Insights for Saint-Hymer
- Essential amenities in Saint-Hymer that guests expect include: Smoke alarm, Free parking on premises, Heating. Lacking these (any) could significantly impact bookings.
- Popular amenities like Hot water, TV, Coffee maker are common but not universal. Offering these can provide a competitive edge.
- Warning: Wifi is not universally provided but is considered essential globally. Ensure reliable Wifi is offered.
Recommendations for Hosts
- Ensure your listing includes all essential amenities for Saint-Hymer: Smoke alarm, Free parking on premises, Heating.
- Prioritize adding missing essentials: Heating.
- Consider adding popular differentiators like Hot water or TV to increase appeal.
- Highlight unique or less common amenities you offer (e.g., hot tub, dedicated workspace, EV charger) in your listing description and photos.
- Regularly check competitor amenities in Saint-Hymer to stay competitive.
Saint-Hymer Airbnb Guest Demographics & Profile Analysis (2026)
Guest Profile Summary for Saint-Hymer
- The typical guest profile for Airbnb in Saint-Hymer consists of primarily domestic travelers (74%), often arriving from nearby Paris, typically belonging to the Post-2000s (Gen Z/Alpha) group (50%), primarily speaking English or French.
- Domestic travelers account for 73.9% of guests.
- Key international markets include France (73.9%) and Netherlands (9.8%).
- Top languages spoken are English (35.1%) followed by French (34%).
- A significant demographic segment is the Post-2000s (Gen Z/Alpha) group, representing 50% of guests.
Recommendations for Hosts
- Target domestic marketing efforts towards travelers from Paris and Copenhagen.
- Tailor amenities and listing descriptions to appeal to the dominant Post-2000s (Gen Z/Alpha) demographic (e.g., highlight fast WiFi, smart home features, local guides).
- Highlight unique local experiences or amenities relevant to the primary guest profile.
- Consider seasonal promotions aligned with peak travel times for key origin markets.
Nearby Short-Term Rental Market Comparison
How does the Saint-Hymer Airbnb market stack up against its neighbors? Compare key performance metrics like average monthly revenue, ADR, and occupancy rates in surrounding areas to understand the broader regional STR landscape.
| Market | Active Properties | Monthly Revenue | Daily Rate | Avg. Occupancy |
|---|---|---|---|---|
| La Couture-Boussey | 11 | $4,086 | $464.04 | 28% |
| La Poterie-Cap-d'Antifer | 15 | $3,878 | $273.66 | 48% |
| Saint-Étienne-la-Thillaye | 23 | $3,486 | $390.94 | 35% |
| Roedean | 52 | $3,379 | $273.40 | 45% |
| Saint-Pierre-du-Val | 15 | $3,257 | $343.84 | 38% |
| Petiville | 13 | $3,232 | $379.66 | 33% |
| Rugles | 11 | $3,164 | $308.65 | 32% |
| Mesnils-sur-Iton | 24 | $3,099 | $348.65 | 41% |
| Charencey | 11 | $3,030 | $245.41 | 41% |
| Tourouvre au Perche | 31 | $3,003 | $254.65 | 39% |